3 short tasks:
EA extend, 1 more simple input:
i have an EA that reads orders from csv files, need following input added:
Minimum time between orders: 6 (seconds) (if csv file gets multiple orders at the same time, it always has to wait 6 seconds before placing next one)
Indicator simple extend:
i have this indicator that exports bid, ask, MA, ATR, and keeps updating the file (attached).
additionally after MA i need linear regression data as following:
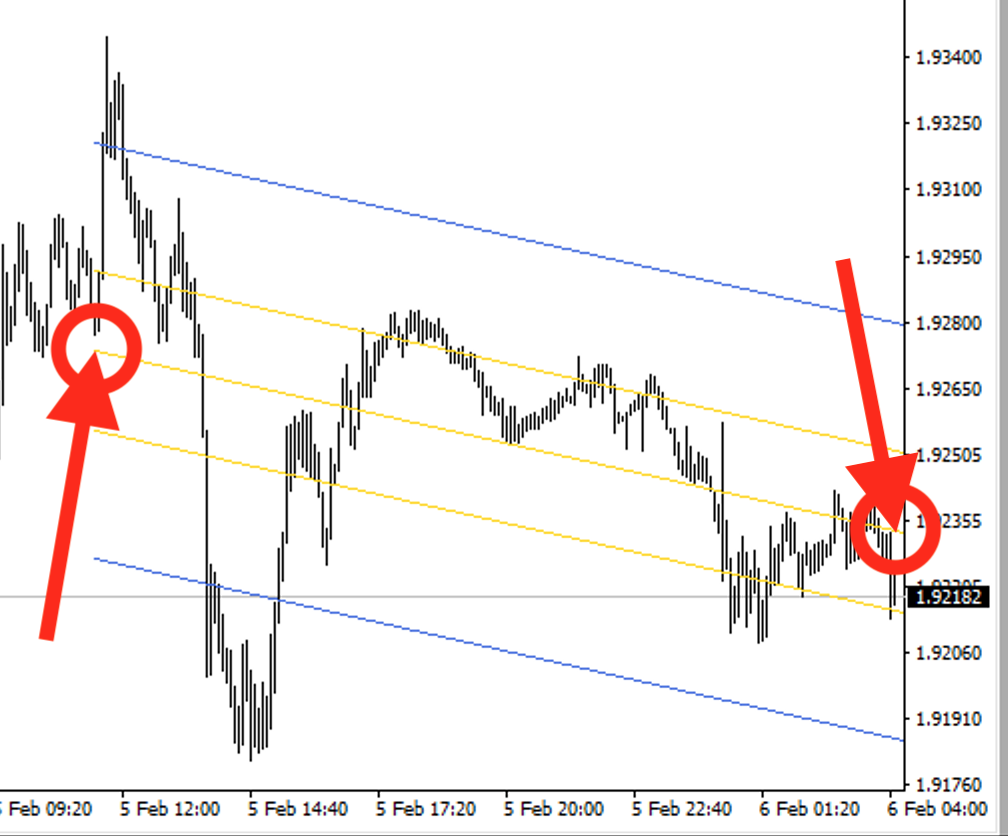
left and right price values of the linear regression line (see image "indicator simple extend").
for all 28 pairs
value 1: M1, 30 bars
value 2: M5, 30 bars
value 3: M15, 50 bars
value 4: H1, 62 bars
value 5: H4, 78 bars
value 6: D1, 65 bars
value 7: W1, 46 bars
attached source code of indicators with linear regression calculation.
if it takes too much work to put the data between MA and ATR of each pair and you would like to put the linear regression data at the very end
instead, you can do it (let me know!), but pairs have to be in alphabetical order and per line 1 symbol, and if possible 1 empty line after
existing exports.
EXPORT HISTORY WITH HIGH LOW OF TRADES
i need a script or indicator that exports the history with high and low of each individual trade to a csv, with all the other details of the
trade (comment etc etc).
important: see attached image regarding high & low. it is high & low of EACH trade separately, its NOT about balance or equity. The image is
only for comprehension of the high and low, everything else on image is irrelevant.
if possible it keeps updating the csv file, but not important. Let me know if you can do it, should be very easy.
INPUTS
File name:
Can be script or indicator, MT4.
all including source code. not for selling. copyright belongs to me.
Pedidos semelhantes
I need an MT5 Expert Advisor built as a high-precision volumizer for Forex. Its core purpose is to generate controlled trading volume for rebates, while still maintaining low-risk account growth. I am not looking for aggressive profit chasing. I am looking for a stable, intelligent EA that can produce volume in a disciplined way without damaging the account. The ideal system should trade major currency pairs, avoid
1. IF price forms: - Higher highs + higher lows → TREND = BUY - Lower highs + lower lows → TREND = SELL ELSE → NO TRADE 2. IF: - Trend = BUY - Price retraces to support zone - Bullish engulfing candle forms - TDI green crosses above red (optional) THEN: - Execute BUY 3. IF: - Trend = SELL - Price retraces to resistance - Bearish engulfing forms - TDI confirms THEN: - Execute SELL 4. Risk per trade = 1% of account Lot
I need a high frequency trading robot for gold in one or 5 minute timeframe the robot should have spread filter where it should only open trades below a set spread should have news filter to allow trading during fundal news or not the robot should have input in number of minutes to close all open trades and remove pending orders before fundamental news as part of news filter. It should also have the number of minutes
Hello! I want to programm EA that uses volume profile indicator, but I am not sure if this is possible. Only experienced programmers please, I will not select a programmer who did only few jobs. Before starting I need to make sure you understand everything and that this is for sure technically possible
Hello, I am looking for a professional trading system including: 1- Trading Bot (Expert Advisor): - Good profit performance - High security and strong risk management - Works efficiently during high market volatility (news and strong movements) - Works on all pairs (Forex + Gold) 2- Signal Indicator: - Provides clear Buy and Sell signals - Includes Take Profit and Stop Loss - No repaint (signals must not change or
Hi, I’m looking for a top-tier, profit-optimized EA that has the potential to scale trading returns significantly. My goal is to maximize growth over time. Can you help develop a bespoke EA that could potentially scale to high six or seven figures
max amount grid step for magic number do keep deleting .only when it is in negative floating .but when it is profit allow to go over the max and replays to grid step
Apply with a screen of your work . Symbol Specific Logic . Live Chart Optimization Check the Core logic . [back tests as well] Change points to pips . Create buffer for the zone
I will pay 3000+ USD (negotiable) for an EA for existing MT5 that generates a minimum of 15-20% or higher a month consistently (provide source code after final deal) Looking for a highly profitable EA Please send demo version directly subject (Buying profitable EA Budget up to $ 3000 USD), past results and optimal settings so I can test, if it performs in a strategy tester i will also need option to forward test it