Export history to CSV with High and Low of each trade

MQL4 Indicadores Scripts

Termos de Referência

(all 5 offers rejected because price above $100. max price $35)


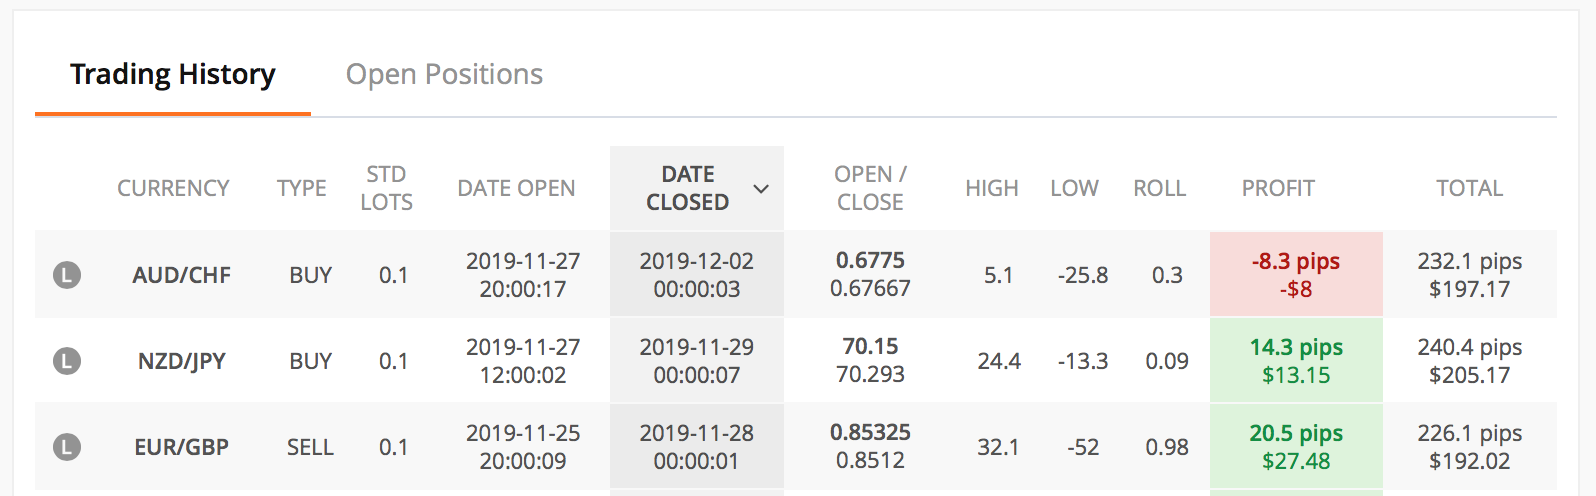
i need a script or indicator that exports the history with high and low of each individual trade to a csv. 


important: see attached image regarding high & low. it is high & low of EACH trade separately, its NOT about balance or equity. The image is only for comprehension of the high and low, everything else on image is irrelevant.


if possible it keeps updating the csv file, but not important. Let me know if you can do it, should be very easy.


Can be script or indicator, MT4. including source code. copyright belongs to me.


INPUTS: (not really necessary that i'm able to disable them, let me know if you would include inputs in the price of $30 or not. 

Custom File name has to be available.


(if it gets exported or not. if one gets disabled, the column will be empty. so for example "Commissions" will always be in 21th column, regardless how much have been disabled)


Keep updating file: true / false 

pair: (not to disable, gets exported either way)

type: true / false

lot: true / false

high in pips: true / false

low in pips: true / false

high in $: true / false

low in $: true / false

high in percentage of TP: true / false (example: take profit was 200 points, high was only 100 points, so its 50%)

low in percentage of SL: true / false 

duration of trade: true / false

comment: true / false

tp: true / false

sl: true / false

open date & time: true / false

close date & time: true / false

profit/loss: true / false

price: true / false

order nr.: true / false

Tax: true / false

Swap: true / false 

commissions: true / false

file name: History.csv  (if file name exists already, it gets replaced or updated)


Arquivos anexados:

Respondido

1
Desenvolvedor 1
Classificação
(163)
Projetos
193
48%
Arbitragem
2
50% / 50%
Expirado
1
1%
Livre
2
Desenvolvedor 2
Classificação
(258)
Projetos
395
28%
Arbitragem
69
19% / 49%
Expirado
120
30%
Livre
3
Desenvolvedor 3
Classificação
(54)
Projetos
53
17%
Arbitragem
7
0% / 100%
Expirado
5
9%
Livre
4
Desenvolvedor 4
Classificação
(12)
Projetos
16
31%
Arbitragem
0
Expirado
0
Livre
5
Desenvolvedor 5
Classificação
(7)
Projetos
8
38%
Arbitragem
3
33% / 33%
Expirado
2
25%
Livre
6
Desenvolvedor 6
Classificação
(135)
Projetos
193
42%
Arbitragem
17
29% / 59%
Expirado
28
15%
Livre
7
Desenvolvedor 7
Classificação
(277)
Projetos
334
55%
Arbitragem
14
36% / 29%
Expirado
1
0%
Livre
8
Desenvolvedor 8
Classificação
(66)
Projetos
143
34%
Arbitragem
10
10% / 60%
Expirado
26
18%
Livre
9
Desenvolvedor 9
Classificação
(36)
Projetos
45
47%
Arbitragem
5
40% / 60%
Expirado
9
20%
Livre
Pedidos semelhantes
hello here am looking for someone that can assist me in removing validation form my demo file and if anyone is interested dm the for more details i will be waiting to get any reply by some on that can assist me with this
A green point should be added at the Low point of candlesticks in the oversold zone—it is the L point. If there is at least one L point between two H points, search for a LL point in the interval between two H points. The candlestick with the lowest Low price will be the LL point. Generally, the LL point is not necessarily an L point. Search for candlesticks with the lowest Low price. If there is at least one H point
Trading robots are programs, which operate according to underlying algorithms. An algorithm is a set of actions that need to be performed in response to certain events. For example, the most common task in algo trading is the identification of the "New bar" event. When the event occurs, the robot checks the emergence of trading signals and acts accordingly. Before you decide to program or order a trading robot, you
RRB 50 - 400 USD
The overbought zone is determined as candlesticks, at which the indicator value Value > Lmax (Lmax=-20). The oversold zone is determined as candlesticks, at which the indicator value Value < Lmin (Lmin=-80). The values of Lmax and Lmin should be included in indicator parameters. A yellow point should be added at the High point of candlesticks in the overbought zone—it is the H point. A green point should be added at
At bot 30+ USD
Help me to trade create orders for me and analyze the markets and decide when is a good time to buy or sell. Determine which pairs are best to use to trade with and indicate trading signals to me
Fair Value Gap Scanner 30 - 100 USD
Hi, Greetings. Can somebody revert with an offer to code a FVG Scanner across Forex Pairs / Time Frame Selection / Alert please in order to support a Trading Strategy where entries are considered with the market direction confluence such as a Half Trend / Semafor Indicator. Look forward to hear back. Kind Regards. Anton
Project Description : I need an experienced programmer to convert the TradingView indicator "CURRENCY STRANGHT CHART by boitoki" into a MetaTrader 5 (MT5) format. The indicator should function identically to the original and be fully compatible for integration into an Expert Advisor (EA) on MT5. Requirements : Convert "TTD Middle Right Normal" from TradingView to a .mq5 file for MT5. Ensure all indicator features and
Project Description : I need an experienced programmer to convert the TradingView indicator "RSI BARS" into a MetaTrader 5 (MT5) format. The indicator should function identically to the original and be fully compatible for integration into an Expert Advisor (EA) on MT5. Requirements : Convert "TTD Middle Right Normal" from TradingView to a .mq5 file for MT5. Ensure all indicator features and visual signals are
Project Description : I need an experienced programmer to convert the TradingView indicator "TTD Middle Right Normal" into a MetaTrader 5 (MT5) format. The indicator should function identically to the original and be fully compatible for integration into an Expert Advisor (EA) on MT5. Requirements : Convert "TTD Middle Right Normal" from TradingView to a .mq5 file for MT5. Ensure all indicator features and visual
I want to create an indi to push notification when the candlestick chart forms 3 peaks or 3 bottoms forming a straight line: - 1,2,3 are 3 points in a straight line or NEARLY straight For example: Straight: NEARLY straight : means the peak/bottom of candle number 3 is NEAR the straight line connecting 1 and 2. Candle number 3 may or may not have crossed the straight line, as long as the peak/bottom of candle number 3

Informações sobre o projeto

Orçamento
30 - 33 USD
Desenvolvedor
27 - 29.7 USD
Prazo
para 4 dias