당사를 페이스북에서 찾아주십시오! 당사 팬 페이지에 가입하십시오
MetaTrader 5의 새로운 가능성 사용
The PZ Chipmunk Expert Advisor is an aggressive mathematical scalper that trades the M15 timeframe and tick data, implementing a universal strategy which can be applied to any instrument. It has evolved over time from Goldfinch to be more profitable and stable in live trading. It trades EURUSD, GBPUSD, USDJPY, EURGBP, EURJPY, GBPJPY and AUDUSD. It has only five input parameters (Signal, SL, TS, TSP and TP). The average profit factor is above 3.5. It makes around 90% winning trades. Conservative
Advanced new deals notificator. It always keeps you informed about ALL deals from your MetaTrader 5 trading terminal. Being placed on any chart it sends e-mail and Push Notification with all information about the new deal. The user can create his own message type and include only necessary information into the text. The best deal notification solution. It informs you about absolutely all deals, without missing a single one.
Angry Beaver — a Professional Forex Expert Advisor All you need to get started is an account at a reliable low-spread broker, VPS server, fast Internet connection and Angry Beaver. The EA's efficiency has been confirmed on real accounts . The strategy is constantly improved, since I use it myself and always follow the market sentiment. Plain and Simple EA Settings You may leave all the settings unchanged for EURUSD M5. Thought-out and Flexible Trading Strategy The analytical core of the system
Help scalper placing his manual orders faster so he can repeat his orders without worrying make a mistake when calculate their Stop Loss/Take Profit. Example: The price has a strong movement and breaks the upper Fractals at M5 chart. You want to open a long position to get small pips profits (scalping). On this stage you will you will feel confused to put your SL/TP while prices continue to soar up and you do not want to lose this opportunity but you need to prepare your values of SL/TP. In this
Ichimoku indicator. Standard technical indicator from the client terminal. This product is intended for internal testing only.
This Expert Adviser uses scalping based on the strength of the current trend movement. It's able to work on many instruments and brings significant profit with little drawdown.
This is the SMART BREAKOUT EA which allows you to trade HIGHs and LOWs of any hour and any day range you decide. SMART BREAKOUT allows you to trade favourite strategies such as London Breakout, Day Breakout, US Session, Asian Session. LONDON BREAKOUT (one of the strategies used by institutions and big players) you can set to trade range between 8-9 o'clock of London time. After 9 o'clock two pending orders are set up. Buy stop for High level and Sell limit for Low level. Once the prices reach on
Ulimate MTF Support & Resistance - 5 Star Best Seller New Year Sale - save $20 (normal price $79) Beginner or Professional our best selling multi-timeframe Pivot Prof will enhance your trading and bring you great trade opportunities with the Support and Resistance levels that professionals use. Pivot trading is a simple effective method for entering and exiting the market at key levels and has been used by professionals for decades and works on all symbols: Forex, Crypto, Stocks, Indicies et
Silver Mountain is one of the "Mountain" EA Series. It follows the rules of a good trader: Allows the profit to run and cuts the losses. Works with large take profit and medium stop loss. Usually price doesn't reach them. Expert Advisor is always in the market and works with stop & reverse technique using its indicator. Money management is based on available free margin. Default 1% . I suggest not to change it. Silver Mountain works only on symbol SILVER and H8 timeframe. Try also the other "Mou
Unlock key market insights with automated support and resistance lines Tired of plotting support and resistance lines? This is a multi-timeframe indicator that detects and plots supports and resistance lines in the chart with the same precision as a human eye would. As price levels are tested over time and its importance increases, the lines become thicker and darker, making price leves easy to glance and evaluate. [ Installation Guide | Update Guide | Troubleshooting | FAQ | All Products ] Boo
Monster Line is a Trajecta research based on the reverse engineering of some of our trading signals (Trajecta Labs Trading Ecosystem) using our very fast emulator (Trajecta Labs Strategy Emulator). The idea here is fit some of the best strategies and setups inside the Ecosystem and transform it into a highly profitable Expert Advisor. Our emulators line: Full Monster Line . The innovation power: our innovative and very fast Trajecta Labs Strategy Emulator can generate highly profitable Expert
This software has no equals in the world and represents a universal trade "console" covering trading signals, automated market entry, setting of Stop Loss and Take Profit, as well as Trailing Profit for multiple trades at the same time in a single open window. Intuitive control of the Expert Advisor in "three clicks" ensures a comprehensive use of all its functions on different computers, including tablets PCs. Interacting with additional signal indicators that mark the chart to give a real mark
이 스캘퍼 표시기는 2포인트의 위험으로 안전하게 10포인트 수익을 얻을 수 있는 순간을 보여줍니다. 적절하게 자금 관리를 사용하면 낮 동안 예금을 크게 늘릴 수 있습니다. 표시기에는 추세 계산에 사용되는 막대 수라는 하나의 입력 매개변수만 있습니다. 시그널이 나타나면 현재 가격(매수)보다 2포인트 높은 가격(매수) 또는 2포인트 낮은 가격(매도)에 Pending order를 합니다. 손절매 - 2-3점; 이익을 얻으십시오 - 10 pont에서; 권장 기간 - M1. 변동성이 크고 스프레드가 작은 기호 - EURUSD, AUDUSD, GBPUSD, EURJPY 등 포지션이 개설되었지만 가격이 이익실현 가격에 도달하지 않은 경우 손절매를 손익분기 수준으로 수정하고 이전 막대의 낮은 가격(롱 포지션의 경우) 또는 이전 막대의 높은 가격에서 포지션의 후행 스탑을 사용합니다. 숏 포지션용 바. 참고: 이 표시기를 임대하는 대신 구입하는 경우 지불 증명서를 보
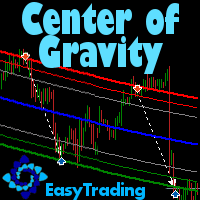
What is Center of Gravity? The Center of Gravity indicator allows you to get an instantly strong sentiment of where any market is going. It works with any kind of market: Forex, Stocks, Metals... The extreme ease of reading is the real power of this indicator. The basics behind Center of Gravity is a physics law: barycentre. When the market price deviates strongly from this centre of gravity, the probability is considered high that the market price will evolve back towards the centre of gravity.
Finally available on the mql5.com Market, you can now use the full Center of Gravity indicator. It is very easy to use , on all currency pairs, indices, all time frames. If you have not found an indicator that suits you, take a look at the screenshot and try it now! What is Your Situation? You lose money; You're not sure when to enter position; You close just before price goes back in your direction; You use indicators but they are not effective; Possibly you have taken courses, you used robots
Acceleration of Gravity is an Expert Advisor developed on the basis of the concept of gravitational acceleration . Trading Strategy: Acceleration of Gravity Expert Advisor trades on EURUSD currency pair with timeframe H1. Values calculated using the concept of gravitational acceleration are used to open positions. Positions are closed by Take Profit, Stop Loss or by the opposite signal. In addition, there is the Trailing Stop option. The money management is based on free margin. The Expert Advi
The Heiken Ashi indicator drawn using a tick chart. It draws synthetic candlesticks that contain a definite number of ticks. Parameters: option prices - price option. It can be Bid, Ask or (Ask+Bid)/2. the number of ticks to identify Bar - number of ticks that form candlesticks. price levels count - number of displayed price levels (no levels are displayed if set to 0 or a lower value). calculated bar - number of bars on the chart. Buffer indexes: 0 - OPEN, 1 - HIGH, 2 - LOW, 3 - CLOSE.
This indicator shows you the volume underlying the Bid and Ask quotes in the MetaTrader terminal. Volume is a key driver of price - if there is a large skew between Bid and Ask volume, this suggests price is going to make a movement in the skew direction. This indicator is a very useful tool for scalpers and other short-term traders as it allows you to confirm your existing signals. Settings include: Scale Percent - percentage of window to fit volumes inside; VolumeLotsAtMaxScale - number of lot
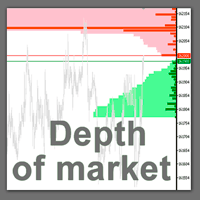
The professional tool of stock traders in now available on MetaTrader 5 . The Actual depth of market chart indicator visualizes the depth of market in the form of a histogram displayed on a chart, which refreshes in the real-time mode. Meet new updates according to user requests! Now Actual Depth of Market indicator displays the current ratio of volume of buy and sell requests (B/S ratio). It shows the share of volume of each type of requests in the entire flow of requests as well as the absolu
Smart Neurons Expert Advisor is developed on the basis of a neural net. It can trade on any currency pair. The efficiency of the net is a result of using a unique function for transmission of neurons and an original algorithm for preparing input data. The stop loss size is calculated automatically, you just need to set an acceptable level of risk per deal in percentage terms. The screenshots demonstrate the result of testing on EURJPY H1 for 10 years. Recommendations on Settings: The Expert Advi
Noise filtering: the key to mastering trends This indicator tracks the market trend with an unmatched reliability, by ignoring sudden fluctuations and market noise. It has been designed to trend-trade intraday charts and small timeframes. Its winning ratio is around 85%. [ Installation Guide | Update Guide | Troubleshooting | FAQ | All Products ] Amazingly easy to trade Find oversold/overbought situations Enjoy noise-free trading at all times Avoid being whipsawed in intraday charts The indi
Universal Trader (UT) This EA is part of the RPTrade Pro Solutions systems. UT is a trading robot using a trend and oscillator indicators. It's designed to be used by anyone, even the absolute beginner in trading can use it. Designed for every TimeFrames Uses Takes Profit, Stop Loss and Trailing stop. Can also work as a switch without SL/TP Works with any pairs How does it work UT is a trend follower. It's using A build in Supertrend Indicator to find trades entries and Parabolic SAR to S
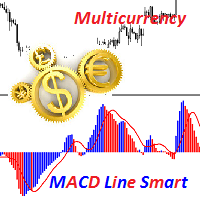
Description A colored universal multicurrency/multi-symbol indicator MACD Line Smart (the indicator moving average convergence divergence is displayed as a histogram) based on double or triple moving average . Comparing to the standard MACD this indicator is more sensitive to what allows generating advance signals. he indicator may be used with any broker, irrespective of the name of the financial instrument since it is necessary to manually enter the name as an input parameter. If you enter a
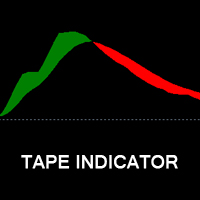
This indicator is based on MACD oscillator. The difference between the classic MACD and the Tape MACD is the drawing only one line. When it turns green, this means that the currency pair will rise; and when it turns red, it means that the currency pair will fall. How to trade with tape MACD: Buy: wait until the indicator color turns to green. Sell: wait until the indicator color turns to red.
Virtual Multi-currency Trailing Stop. It works exactly as the "regular" Trailing Stop, but it does not send trading orders to change the existing Stop Loss. It only changes Virtual Stop Loss level when the current price reaches Trailing Stop Start pips of profit, securing/"locking" more profit as the price moves in favor of a trade. When the price turns back and becomes equal to the Virtual Stop Loss level, the position is closed at the market price. It allows flexible positions filtering and pr
The script in the form of an expert was created to automatically place pending orders of the Stop Close Only type, which are not available in MT5 by default. This type of order involves entering a long position if the price closes above a specified price level and opening a short position if the price closes below the price specified by the trader. This does not take into account level punctures. The expert uses lines to indicate on the chart the levels of closing price levels, the overcoming o
El Asesor Experto Tick Scalper utiliza la estrategia del scalping. Sólo una posición puede estar abierta simultáneamente en cada instrumento en el que ha sido iniciado el Asesor Experto. El Asesor Experto utiliza el nivel fijo de Stop Loss y Take Profit. El usuario puede establecer el tiempo de trading en horas y los días para tradear.
The Expert Advisor trades on market surges, while not using any indicators. The Expert Advisor analyzes the speed of price movement and if the price starts moving faster than the set one, opens a position in the direction of price movement. Trades are closed by SL TP and trailing stop. If the averaging is set to greater than 0, then the stop loss is not set, but new deals are opened with an increased lot and averaged. Parameters: Lot = 0.1; LevelNewse = 50; strength of the news (price jumps in
This indicator is based on a classic Moving Average indicator. Moving averages help us to first define the trend and second, to recognize changes in the trend. Multi TimeFrame indicator MTF-MA shows MA data from the 4 timeframes by your choice. By default this indicator has external parameters: TF1 = 1; TimeFrame2b = true; TF2 = 5; TimeFrame3b = true; TF3 = 15; TimeFrame4b = true; TF4 = 60; InpPSARStep = 0.02; InpPSARMaximum = 0.2; You can change TF1-TF4 in the next limits: TF1 from M1 (1) to H4
The main purpose of the indicator is to detect and mark on a chart the following trade signals described in "New Trading Dimensions": Bullish and bearish reverse bars with angulation (including squat). Bars in the green and red zones according to the histogram color of Awesome Oscillator and Accelerator Oscillator. Bars in the grey zone, when the Awesome Oscillator and Accelerator Oscillator histograms below these bars have opposite directions. Blue squat bars on chart independent of the color o
Trading Strategy Ace Scalper works on the GBPUSD currency pair. The strategy is based on the finding of price fluctuations in the quiet periods for the currency market: from 22:00 to 03:00 Central European Time. During this period, as a rule, the strong unpredictable price movements are absent. It allows you to perfrom the relatively safe scalping with a profit of 10-14 points per trade, the average trade duration is 1-2 hours. The Expert Advisor uses a close Stop Loss of 40-70 points, which pr
Easy Order is an Expert Advisor allowing you to enter any type of trade with one click based on your RISK preferences. You can choose to enter a trade and automatically calculate your lot size based on how much of your account you want to risk. Risk is calculated based on your Stop Loss placement. You can use a fixed lot size if you don't want to use risk based calculation of lot size. Your previous setting of risk based or fixed lot size remains saved for your next use of this Expert Advisor. T
This is a half scalping system that analyzes the market using a transmission function. The system can be scalping or not depending on the "takeprofit" and "stoploss" parameters. This Expert Advisor is intended for trading on EURUSD,GBPUSD,EURCHF,EURAUD however it can work on other currency pairs. You should use timeframe M1 for trading. Parameters Bobra Adept Mode_trade (Market_Oders) - type of order placed. type_order (ORDER_FILLING_FOK) - type of order filling. Magic (123) - magic number. Use
MACD techniques are commonly used in the daily tradings. It is useful to find the market trend and divergence/convergence of current trend. This version of MACD is better for people who are doing real world trading to make decisions even faster. It is based on the default MACD, plus the features of the strength of the market force(green bar for long strength, red bar for short strength), and arrows indicating the type of position to open/close. By comparing the piles of the strength bars, you ca
Traders Dynamic Index (TDI) - Overview The Traders Dynamic Index (TDI) is a versatile indicator based on the RSI oscillator. It helps traders identify market conditions and potential reversals. The TDI combines multiple indicators into one, providing a comprehensive view of market dynamics. Components: - Green line: RSI Price Line - Red line: Trade Signal Line - Blue fill: Volatility Band - Yellow line: Market Base Line Visual Signals: 1. Trend Direction: - Immediate: - Green over
Multi-currency virtual Take Profit and Stop Loss. Virtual stops work as usual SL/TP on a server/broker side, but are not visible to your broker and are kept only within EA "memory". Allows flexible positions filtering and processing by: Pair Magic Position ID Position Type The Expert Advisor can be placed on any chart. You can use Virtual Stops simultaneously with any other trading Expert Advisor. The Expert Advisor also features: on screen display extended logging separate EA log file standa
DWMACD - Divergence Wave MACD . The indicator displays divergences by changing the color of the MACD histogram. The indicator is easy to use and configure. For the calculation, a signal line or the values of the standard MACD histogram can be used. You can change the calculation using the UsedLine parameter. It is advisable to use a signal line for calculation if the histogram often changes directions and has small values, forming a kind of flat. To smooth the histogram values set the signa
This indicator works on two signal lines combined with a channel. It produces a sell or buy signal depending on the lines. As output for an Expert Advisor there are 6 buffers. The high and low channels, the high and low signal lines and the buy and sell signals themselves. EATChannelSignals works on all periods and all symbols. Three parameters can be changed by the user: Signalline - Moving Average of the signal lines. ChannelAverage - Moving Average of the channel. ChannelWidth - width of the
MetaTrader 5용 Averager — 전문적인 평균 단가 조정 및 포지션 시리즈 관리 시스템 드로우다운에 들어간 포지션을 평균 단가 조정으로 관리하고, 추세 방향과 역추세 방향 모두에서 추가 진입까지 지원하는 강력한 Expert Advisor입니다. 이것은 단순한 물타기 도구가 아닙니다. 포지션 시리즈의 평균 진입가를 조정하고, 전체 바스켓의 공통 청산 지점을 관리하며, 수익 회복 구조를 더 유연하게 만들기 위한 전문 관리 시스템입니다. Averager는 독립적인 자동매매 전략이 아닙니다. 이미 열려 있는 거래를 감시하고, 평균 단가 조정, 추가 진입, 공통 트레일링 스톱을 통해 전체 포지션 시리즈를 관리하는 데 특화된 도구입니다. 수동 매매를 하는 트레이더, 자신의 진입 신호를 사용하는 트레이더, 또는 다른 매매 시스템과 함께 운용하려는 트레이더에게 적합합니다. 손실 구간에 들어간 포지션과 진행 중인 포지션을 하나의 명확한 구조 안에서 전문적으로 관리하고 싶은 사용자에게
The Envelopes indicator drawn using a tick chart. After launching it, wait for enough ticks to come. Parameters: Averaging period - period of averaging. Smoothing type - type of smoothing. Can have any values of the enumeration ENUM_MA_METHOD . Option prices - price to be used. Can be Ask, Bid or (Ask+Bid)/2. Deviation of boundaries from the midline (in percents) - deviation from the main line in percentage terms. Price levels count - number of displayed price levels (no levels are displayed if
This is a half scalping system that analyzes the market using a transmission function. The system can be scalping or not depending on the "takeprofit" and "stoploss" parameters. This Expert Advisor is intended for trading on EURUSD,GBPUSD,EURCHF,EURAUD however it can work on other currency pairs. You should use timeframe M1 for trading. Parameters Bobra Stable Mode_trade (Market_Oders) - type of order placed. type_order (ORDER_FILLING_FOK) - type of order filling. Magic (123) - magic number.
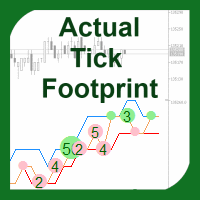
This new unique indicator Actual tick footprint (volume chart) is developed for using on Futures markets, and it allows seeing the volume of real deals right when they are performed. The indicator Actual tick footprint (volume chart) represents a greatly enhanced tick chart that includes additional information about the volume of deal performed at a specific price. In addition, this unique indicator for MetaTrader 5 allows to clearly detecting a deal type – buy or sell. Alike the standard tick c
Indicator-forecaster. Very useful as an assistant, acts as a key point to forecast the future price movement. The forecast is made using the method of searching the most similar part in the history (pattern). The indicator is drawn as a line that shows the result of change of the close price of bars. The depth of history, the number of bars in the forecast, the patter size and the quality of search can be adjusted via the indicator settings. Settings: PATTERN_Accuracy_ - quality of the search.
The indicator presents a new way of early trend detection using the popular ADX indicator methods. The new system adapts to the market and eliminates additional conditions. To generate a signal when using the standard ADX indicator, the ADX line should cross some level - 20, 22, 26, etc. However, it is very difficult to select such a level not only for different symbols but also for different timeframes on the same chart which makes ADX practically useless. The solution has turned out to be simp
This is the latest iteration of my famous scalper, Goldfinch EA, published for the first time almost a decade ago. It scalps the market on sudden volatility expansions that take place in short periods of time: it assumes and tries to capitalize of inertia in price movement after a sudden price acceleration. This new version has been simplified to allow the trader use the optimization feature of the tester easily to find the best trading parameters. [ Installation Guide | Update Guide | Troublesh
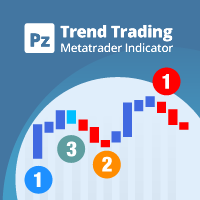
Capture every opportunity: your go-to indicator for profitable trend trading Trend Trading is an indicator designed to profit as much as possible from trends taking place in the market, by timing pullbacks and breakouts. It finds trading opportunities by analyzing what the price is doing during established trends. [ Installation Guide | Update Guide | Troubleshooting | FAQ | All Products ] Trade financial markets with confidence and efficiency Profit from established trends without getting whips
This is a visual trade panel that helps you to place and manage trades easily, avoiding human errors and enhancing your trading activity. It combines an easy to use visual interface with a sound risk and position management approach. [ Installation Guide | Update Guide | Troubleshooting | FAQ | All Products ] Amazingly easy to use Trade easily from the chart Trade with precise risk management, hassle free Capital preservation is top priority Let profits run without your attention Enjoy risk-free
The Smart Neurons Pro Expert Advisor is based on the neural network approach. It can trade on any currency pair. Working efficiency of the network is achieved through the unique neuron transfer function and a special algorithm for input data preparation employed. Stop Loss value is calculated automatically, you only need to set the acceptable trade risk expressed as percentage. The screenshots demonstrate testing results for EURJPY on H1. The optimization period: 10 years (2002.06.22 - 2012.06.2
Indicator to calculate swings (also called fractal or pivots) with a variable number of bars before and after relative highs and lows. Also, it calculates divergences at those swings based on MACD. This indicator has 3 parameters: NBars - number of bars what have to be lower (or higher) than a swing bar. FastEMA - fast EMA for MACD. SlowEMA - slow EMA for MACD. The swings are shown with green and red arrows, and the divergences are shown with magenta dots. A swing with divergence indicates a pot
The indicator produces signals according to the methodology VSA (Volume Spread Analysis) - the analysis of trade volume together with the size and form of candlesticks. The signals are displayed at closing of bars on the main chart in the form of arrows. The arrows are not redrawn. Input Parameters: DisplayAlert - enable alerts, true on default; Pointer - arrow type (three types), 2 on default; Factor_distance - distance rate for arrows, 0.7 on default. Recommended timeframe - М15. Currency pair
The indicator is intended for determining the spread and swap size, the distance for setting stop orders and stop losses from the current price allowed and the risk per 1 point in the deposit currency. The indicator informs a trader about possible additional expenses and profits connected with transferring a position to the next trade session of the financial instrument. It also informs about the spread size and the distance of pending orders, stop loss and trailing from the current price. In ad
This is an utility for automatic scaling of a chart and making at least 140 bars visible in it. This is necessary for a correct wave analysis according to the Bill Williams' strategy "Trading Chaos". The utility can be used on any timeframe available in МetaТrader 5. It draws a vertical line through the first bar the calculation starts from. This line allows you to see the probable starting point of the wave sequence along with a sufficient number of bars displayed in the chart. It also makes th
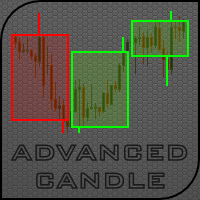
Advanced Candle indicator is designed to display four candle types (including non-standard ones) on the main chart: HTF Candles allow to display candles for any time frame, including non-standard ones. For example, М27 or М135; Box Candles (candles having their minimum height set in points or percentage value) allow to generate candles having specified minimum height, for example, of 100 points or 0.5%; Volume Candles (candles having their minimum volume set in tick volume or real volume) allow
Attention: You can view the program operation in the free version IShift Lite DEMO . IShift Lite is utility for trading directly from the depth of market. IShift Lite allows: - perform trade operations directly from the DoM with a "single touch"; - easily move your orders in the DoM: - automatically place Stop Loss and Take Profit; - Place limit order as Take Profit; - move position to breakeven; - automatically move Stop Loss along the price; - calculate the volume of an order dependi
The main purpose of the indicator is to detect and mark on a chart the following trade signals described in "Trading Chaos (2-nd edition)": Bullish and bearish divergence bars with angulation (including squat). Bars in the red and in the green zones according to the color of the Awesome Oscillator histogram. Squat bars on the chart independent of the color of the Awesome Oscillator histogram. Levels of "important" fractals relative to the "Teeth line" of the Alligator indicator. Drawing angulati
The main purpose of the indicator is to detect and mark trade signals on the histogram of the Awesome Oscillator according to the strategies "Trading Chaos, second edition" and "New Trading Dimensions". The indicator detects and marks the following trade signals: "Two peaks" - Divergence. The signal "Second wise-man" - third consequent bar of the Awesome Oscillator after its color is changed. The histogram crosses the zero line. The signal "Saucer". The indicator includes a signal block that inf
This indicator is the same as the popular Heiken Ashi Smoothed. The Heikin Ashi indicator for MetaTrader 5 already exists, but it has two disadvantages: It paints the candles not accurate. It's not possible to change the candle width. See also Heikin Ashi in MQL5 Code Base . In this version there are no such disadvantages.
Trade smarter, not harder: Empower your trading with Harmonacci Patterns This is arguably the most complete harmonic price formation auto-recognition indicator you can find for the MetaTrader Platform. It detects 19 different patterns, takes fibonacci projections as seriously as you do, displays the Potential Reversal Zone (PRZ) and finds suitable stop-loss and take-profit levels. [ Installation Guide | Update Guide | Troubleshooting | FAQ | All Products ] It detects 19 different harmonic pric
Ilan trailing for MetaTrader 5 Determines the direction of trading according to candlestick patterns. Settings: Initial volume. Lot increasing exponent. Density of averaging (step of bends opening). Maximum amount of averaging (the maximum number of bends). Take Profit in points. Selecting the volume accuracy (number of digits after a decimal point in the volume). Magic number of the Expert Advisor. Slippage. Trailing Stop. Maximum possible loss as a percentage of the deposit.
This multi-currency Expert Advisor works on 12 currency pairs (EURUSD, GBPUSD, USDCHF, USDJPY, USDCAD, AUDUSD, EURGBP, EURAUD, EURCHF, EURJPY, GBPCHF and GBPJPY) that can be selected in the parameters. Risk management can be set up manually. Optimization of all the parameters makes this EA powerful. It is based on filtered MACD to trigger the BUY or SELL signals. Open positions are closed by take profit, stop loss or according to opposite signals. You can perform optimization regularly for each
My Swing EA has become famous for its adaptability to the entire Forex market. However not everyone can benefit from Swing because of the cost. Therefore I have designed a simple and clean swing trading system at a very affordable price! Simple Swing capitalizes on the fact that markets range up and down far more often than they trend. Prove this to yourself by summing all the overlapping prices between bars for every bar on a chart and compare that number to the highest price minus lowest price
The indicator calculates fractal power. Depicts figures that reflect the number of bars in both sides, the highest (lower) from the given fractal. (all values above "9" - marked as "10"). It calculates the 4 types of fractals: classical HigestHigh and LowestLow and further HigestLow and LowestHigh. I think they have greater importance. Of course, if one of the types is redundant - can be excluded (see inputs). The indicator works by OnTimer() event, refresh rate is set in "Seconds" input parame
Description: The indicator draws the colored weighted moving geometrical mean in the price chart window. Besides, this indicator can be used for colored drawing of other indicators that do not have this feature as a default one. "Trend state Geometrical Mean" can be drawn using other indicator values but in this case, all values of this indicator should be greater than zero. Parameters: Averaging period – indicator averaging period. First weight – weight of the first (earliest) averaging period
This is an optimized version of MACD. If the indicator color is red, it is recommended to sell. Crimson color indicates a forthcoming reverse. If the color is light green, it is recommended to sell. Dark green color indicates a forthcoming reverse.
This is an easy-to-use tool for implementing Support Vector Machine Learning in your Expert Advisors, Indicators and other MetaTrader 5 projects. Until now, the use of support vector machine classification has been limited only by advanced coders via external java and c++ dll libraries. This tool has been developed using only the standard MetaTrader 5 tools and provides advanced support vector machine functionality using a very simple interface. Please note: this product is not an Expert Advisor
This is a universal constructor Expert Advisor for MetaTrader 5. The Constructor EA is provided with a large set of functions. It is a versatile trading system with custom functions and more than 15 signals for opening positions and placing pending orders. You can select one of 15 signals to open a position and 5 of 17 filters to sort out the signals of the standard indicators included in the MetaTrader package. Besides, you can adjust the indicator parameters, select a timeframe and specify a s
Indicator to measure market activity and to show speed of price in pips/sec. Have you been wondering, what is current speed of the market? I see the ticks jumping up and down, can I measure their speed? All these questions can be answered by Tick Speed v1.0 - good looking indicator with good configuration possibilities. It will show you directional movement speed in ticks per second or in time defined by you! Good for scalpers, good for long term-traders. Good for beginners, good for pros. Th
The Stochastic Oscillator indicator is drawn on the tick price chart. After launching it, wait for enough ticks to come. Parameters: K period - number of single periods used for calculation of the stochastic oscillator; D period - number of single periods used for calculation of the %K Moving Average line; Slowing - period of slowing %K; Calculated bar - number of bars in the chart for calculation of the indicator. The following parameters are intended for adjusting the weight of signals of the
The Moving Average Convergence/Divergence(MACD) indicator drawn using a tick chart. After launching it, wait for enough ticks to come. Parameters: Fast EMA period - indicator drawn using a tick chart. Slow EMA period - slow period of averaging. Signal SMA period - period of averaging of the signal line. calculated bar - number of bars on the chart for the indicator calculation. The following parameters are intended for adjusting the weight of MACD signals (from 0 to 100). You can find their desc
This is visualization tool based on the Depth of Market. It works with the symbols that have the Depth of Market available. It's a visual indicator that shows the volume of each Bid/Ask price and ratio of total volume of Bids/Asks. Note: check if your broker supports DOM before purchasing. 。。。。。。。。。。。。。。。。。。。。。。。。。。。。。。。。。。。。。。。。。。。。。。。。。。。 。。。。。。。。。。。。。。。。。。。。。。。。。。。。。。。。。。。。。。。。。。。。。。。。。。。
Protect against whipsaws: revolutionize your swing trading approach Swing Trading is the first indicator designed to detect swings in the direction of the trend and possible reversal swings. It uses the baseline swing trading approach, widely described in trading literature. The indicator studies several price and time vectors to track the aggregate trend direction and detects situations in which the market is oversold or overbought and ready to correct. [ Installation Guide | Update Guide | Tro
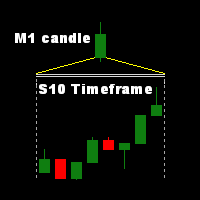
Indicator with second-timeframe in a separate window with separator line. Very useful for day traders to analyze the quick motion. Input parameters: TimeFrame - used time frame: S1 - one candle contains 1 second (max. 60 candle/sec); S2 - one candle contains 2 second (max. 30 candle/sec); S3 - one candle contains 3 second (max. 20 candle/sec); S4 - one candle contains 4 second (max. 15 candle/sec); S5 - one candle contains 5 second (max. 12 candle/sec); S6 - one candle contains
The indicator allows determining the strength and direction of the trend precisely. The histogram displayed in a separate window shows changes of the slope of the regression line. A signal for entering a deal is crossing the zero line and/or a divergence. The indicator is also useful for wave analysis. Input Parameters: Period - period of calculation, 24 on default; CalculatedBar - number of bars for displaying a divergence, 300 on default; AngleTreshold - slope at which a flat is displayed, 6.0
SARTrader is an Expert Advisor based on Parabolic SAR. All parameters are adjustable and their functions are quite understandable. The biggest problem with SAR is to stop trading, that's why I made a hybrid robot. You can let the robot work alone or help it a little bit. When you consider that it earns enough or know that awful news are to come, you can just stop it by pressing the STOP TRADE button. Equity and balance are displayed in big characters on the screen, so you can see it standing far
This is the Famous Timing Indicator You can now use the most famous Timing indicator on the planet. Millionaire Mostafa Belkhayate earned his reputation by using this specific indicator to validate the entry signals supplied by his also famous Center of Gravity indicator on the Forex market. I spent hours, days, weeks to decrypt the formula and now it is finally available to you. New and Unique for MetaTrader 5 Timing will give you perfect validations for your entry signals. It is the first tim
This Expert Advisor won 1st place in the Automated Trading Championship 2010. The trade system is based on analysis of Moving Average indicator. The EA can work at any symbol and timeframe, but better results can be achieved on EURUSD, GBPUSD and M5/M15 timeframes. It uses pending orders when trading, so the entry price has no slippage. Buy order is placed: At strong upper price movement the EA places pending order at price of the moving average - shift. When price is changed, it modifies the pe
This Expert Advisor allows controlling sl, tp and be (Stop Loss, Take Profit and Breakeven) using a panel and lines on the chart. It also features virtual settings. You can manage sl, tp and be using the panel on the chart. A flexible and convenient interface ensures quick and comfortable working with the Expert Advisor and your settings. Features Managing sl, tp and be settings right on the chart using the panel: The panel displays the sl\tp prices (useful if Virtual_sltp=true) and the number o
TimeFilter indicator allows to select visually bit masks (GoodHourOfDay, BadHoursOfDay, GoodDayOfWeek, BadDaysOfWeek), used in the Intraday Time Filter module of the Standard Library. The use of time filters allows to take into account the details of trade sessions. Parameters: GoodHourOfDay Number of the only hour of day (from 0 to 23) when trade signals will be enabled. If the value is -1, the signals will be enabled through the whole day. BadHoursOfDay The bit field. Each bit of this field c
Ilan for MetaTrader 5 Due to using the virtual trades, trading in both directions (buy and sell) simultaneously became possible. This allows users to adapt the popular strategy for the net accounting of positions applied by MetaTrader 5. Expert Advisor Settings The Expert Advisor setup is simple. However, all the important settings of the strategy are available for adjusting. Available tools: Unique MagicNumber for identification of trades; Trade direction option ( Trade direction ): buy onl
Expert Advisor Pipsburger is based on analyzing the price action. Positions are closed when opposite signals appear. Input Parameters Period - number of bars to be analyzed; Lifetime - minimum time of the position life in bars; Mode - operation mode of the Expert Advisor (0-80); Fixed Lot - fixed lot value; Variable Lot - variable lot as a percentage of the free margin. The screenshots demonstrate the backtesting results. The Expert Advisor was tested on EURUSD M1 in the "Every tick" mode from 0
Crazy Lion (CL) is an Expert Advisor that is based on Price Action and 3 technical indicators: Stochastic Oscillator, ADX and Commodity Channel Index with additional Standard Deviation to calculate Take Profit. Trading Strategy Price action confirmed by 3 technical indicators Stochastic Oscillator, ADX and Commodity Channel Index is used to open positions. Positions are closed by Stop Loss and Take Profit, where Take Profit is calculated using Standard Deviation indicator (if AutoTP is true). I
The indicator displays signals generated according to the "Inside day breakout play" strategy described in the book "Day Trading the Currency Market: Technical and Fundamental Strategies to Profit from Market Swings" by Kathy Lien. When an inside bar appears, the indicator draws a range through its maximum and minimum using horizontal lines. If the price breaks through this range, a signal for opening a position is generated. The indicator has only one input parameter - Inner bars. It determines
This indicator shows Pin Bar candlestick pattern on the chart. The bearish pin bars have red color, the bullish pin bars have blue color. The indicator shows alert when Pin Bar candlestick pattern is formed. It's recommended to use it at timeframes H1 and higher. The best moment (strong signal) is when Pin Bar is formed close to the support/resistance level.
This version of Stochastic evaluates the probability of taking the specified profit in points. The appropriate value is set in the parameters, and the product automatically shows possible options for the market it is currently applied to. There are much more options and the information is more extensive compared to conventional Stochastic (see the screenshots). Signals: The yellow channel is absent (flat movement, market entry is not recommended). The yellow channel is narrowing (trend is formin
The indicator is intended to predict a price level at which RSI will have a predefined value. The indicator has two input parameters: Period RSI (default value is 14); Required RSI level (default value is 70.0). During operation the indicator displays a line in the chart window. The line shows what price value is needed for the RSI with the specified period (14) to have the specified value (70). It allows analyzing the current overbought and oversold levels on the market, and place pending order
AIIV EURUSD - Active Index Inflection Values EURUSD The Indicator Shows: The intensity and the direction of the movement of USD. The intensity and the direction of the movement of EUR. The inflection value of EURUSD. This indicator allows determining a state of inflection on the market with a delay of one-two candlesticks and a 60% precision (precision depends on the chart timeframe - the higher the timeframe, the more precise is the forecast). AIIV is a series of indicators of inflection values
The indicator displays the "Morning star" and "Evening star" patterns on a chart. The Evening star is displayed in red or rose. The Morning star is displayed in blue or light blue. Input Parameters: Max Bars – number of bars calculated on the chart. Make Signal Alert – use alerts. Send Push Notification - send notification to a mobile terminal Type of rules pattern – type of the model of pattern determination (Hard – with the control of length of shadows of the second bar). If Soft is selected
This Expert Advisor uses a basic strategy (buy/sell when prices are upper/lower than a moving average). The trading robot starts with a small volume increasing it until the end of the wave, so be careful if you want to use it on real account . Since EA uses a martingale, an extended trend can blow up your account. Better currencies for the moment are published at this address: Genesissurfthewave and updated every month. For security reasons, it is better to withdraw the generated profits regular
ROMAN5 Parabolic SAR TrailingStop includes BreakEven facility. TrailingStop automatically moves the Stop Loss with the Parabolic SAR level. You can place ROMAN5 Parabolic SAR TrailingStop in any chart. It comes with an alert that will sound whenever a new signal appears. It also features an email facility. Your email address and SMTP Server settings should be specified in the settings window of the "Mailbox" tab in your MetaTrader 5. Version 1.1 Able to turn on or off the Buy/Sell entry (UseBuyS
표시기는 두 부분으로 구성됩니다. 1부: 색상 양초가 주요 추세를 보여줍니다. 컬러 캔들(Color Candles)은 컬러 캔들스틱으로 시장 상태를 파악하는 것입니다. 스크린샷에서 보듯이, 색상이 아쿠아(Aqua)라면 시장은 매수 주문을 해야 하거나 매도 주문을 종료해야 하는 상태입니다. 색상이 토마토라면 짧은 주문을 하거나 긴 주문을 종료할 때입니다. 색상이 변경되는 경우 완료될 때까지 기다리는 것이 좋습니다(현재 막대가 닫힐 때까지). 파트 II: 밴드 그리기 안쪽 밴드는 안전 구역으로 정의되고, 바깥쪽 밴드는 마감 주문용으로 정의됩니다. 아래와 같은 거래 전략: 색상이 아쿠아이고 가격이 내부 밴드에 있는 경우 장기 주문을 하고, 가격이 외부 밴드를 넘으면 주문을 마감할 시간입니다. 색상이 토마토이고 가격이 안쪽 밴드에 있으면 짧은 주문을 하고, 가격이 바깥쪽 밴드를 넘으면 주문을 마감할 시간입니다. 참고 : 가격이 내부 밴드에 있을 때 진입 시장에만 해당됩니다. 이는 매우
This indicator gives full information about the market state: strength and direction of a trend, volatility and price movement channel. It has two graphical components: Histogram: the size and the color of a bar show the strength and direction of a trend. Positive values show an ascending trend and negative values - a descending trend. Green bar is for up motion, red one - for down motion, and the yellow one means no trend. Signal line is the value of the histogram (you can enable divergence sea
Parabolic SAR indicator is used on the markets with changing trend directions for calculating the most efficient market entry/exit points. Its main objective is stop loss level calculation. A stop loss is calculated for each candle using the previous bar data. One of the indicator advantages is that a stop level can be defined for the next bar before it is opened. In general, trading method involving Parabolic SAR indicator is quite simple. If the price level exceeds the indicator, open long pos
About EA This EA is designed to take advantage of price retracement. It enters a trade with minimum volume size when the price is exhausted and uses averaging with increase of volume when the market goes deeper into oversold/overbought zones. There is no stop loss. Positions are only closed in profit. To better yield with this EA, it is recommended to trade multi-currency pairs. Input Parameters Trade Direction - trading in a single or both direction; Entry Period - entry logic; Spacing - di
The Precision scalper Expert Advisor is designed to give scalpers the cleanest and the most compact scalping interface on the market. Working on the minute timeframes, especially M1, you should move very fast to catch a profit. Using the standard MetaTrader interface for buying and selling is very slow, opportunities can be easily missed and, moreover, the standard interface takes up a lot of screen space. Precision scalper provides a very quick access to the common scalping requirements: Buy/Se
Momentum Pinball indicator helps to determine a day for trading. The trading strategy depends on values of Momentum Pinball indicator (at the moment, when daily bar is completed). Usage: If Momentum Pinball>70, it is recommended to open short positions only; If Momentum Pinball<30, it is recommended to open long positions only; Momentum Pinball indicator is based on Momentum (the difference between the today's and yesterday' close price). It uses the Relative Strength Index (RSI) indicator (Ex
Multi-TimeFrame version of the Super Trend (SuperTrend) indicator with filling function based on MQL4 code . Input parameters: TimeFrame - used time frame: Can be any of ENUM_TIMEFRAMES values. TimeCorrection - use time correction: Can be true or false (see the first screenshot with true input and a second is false). Period - period to calculate the index: Can be larger than 0. Multiplier - value of multiplier parameter: Can be larger than 0. ShowFilling : Can be true or false. You can use sev
Semi-automated Forex strategy for the MetaTrader 5 platform. It works best during the London and New York trading sessions on M30 or H4 chart. Red arrows indicate points for selling and green arrow - points for buying. Red and green lines show where to put Stop losses. Profit target is 20-100 points only.
The main purpose of the Overloaded Candles indicator is displaying common and Heiken Ashi candlesticks. The indicator also colors the overbought and oversold zones according to the signals from embedded indicators. The input parameters are the candlestick types to be displayed: Common OHLC candlesticks Heiken Ashi candlesticks It is recommended to use the indicator for exiting from a position or for determining when to enter using a correction.
Classic Multi-currency Break-Even. It only changes order Stop Loss level when the current price reaches Break Even Level pips of profit, securing/"locking" Break Even Profit pips of profit. Allows flexible positions filtering and processing by: Pair Magic Position ID Position Type The Expert Advisor can be placed on any chart. You can use Advanced Break Even simultaneously with any other trading Expert Advisor. Also features: On Screen Display Extended logging Separate EA log file Standard Met
The EAmicroMoney Expert Advisor works on EURUSD. It has the following parameters: maximum step price, moving average period and moving average shift. It is not bound to any specific timeframe. It uses a unique technology to identify small trends and make large volume deals. Default input parameters: StepPrice=0.00031, moving average period=12, moving average shit=9. Nothing more to say, just look at the screenshots.
This utility is used to visually choose an indicator for trailing stop and select its parameters. The Expert Advisor modifies the Stop Loss order position opened for the instrument of the current chart based on indicator values. Uses indicators Parabolic SAR , NRTR (Nick Rypock Trailing Reverse) , Moving Average or linear regression channel. The indicators are added to or removed from the chart using the 'show' checkbox. The following options are available: Parabolic - trailing stop based on th
EAmicroMoney Bet Expert Advisor works on 1 currency pair - EURUSD. Lots are set up manually in the Lots parameter. Optimization of the Lots parameter makes this Expert Advisor powerful. It is based on filtered-MACD & CCI to trigger the BUY or SELL signals. Open positions are closed by Take Profit, Stop Loss or according to opposite signals. Maximum value of the Lots parameter is 0.09 and minimum value is 0.01. If you have enough money you can use 0.09. For more details please see the screensho
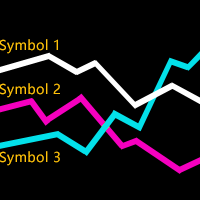
This indicator is used to compare the relative strength of the trade on the chart against the other several selected symbols. By comparing the price movement of each traded variety based on the same base day, several trend lines of different directions can be seen, reflecting the strong and weak relationship between the several different traded varieties, so that we can have a clearer understanding of the market trend. For example, you can apply this indicator on a EurUSD chart and compare it w
Virtual TrailingStop is an Expert Advisor that manages trailing stop without sending its information to the broker server. Input Parameters EnableVirtualTrailingStop: enable or disable whole function VirtualTrailingStop: the pip use for determine how far the Virtual Trailing Stop will placed calculated from current price StartFromBreakEven: true/false. If true, Virtual Trailing Stop will placed after breakeven BreakEvenPoint: point profit from order open price where the Virtual Trailing Stop w
Bullish Bearish Volume is an indicator that divides the volume into the bearish and the bullish part according to VSA: Bullish volume is a volume growing during upward motion and a volume falling during downward motion. Bearish volume is a volume growing during downward motion and a volume falling during upward motion. For a higher obviousness it uses smoothing using MA of a small period. Settings: MaxBars – number of bars calculated on the chart; Method – smoothing mode (Simple is most preferab
ROMAN5 Time Breakout EA with Advanced TrailingStop includes the BreakEven feature. It automatically draws the boxes for daily support and resistance breakouts. When the price is below the support line, it is a sell signal; and when the price is above the resistance line, it is a buy signal. Advanced TrailingStop comes with 6 indicators: Fractals, Parabolic SAR, Bollinger Bands, Heiken Ashi, Moving Average and a combination of Fractals+Parabolic SAR. Advanced TrailingStop automatically moves the
The indicator draws a trend channel and adds Fibonacci levels (extension). It is a part of Argo - Trix strategy's set. However, it can also work as an independent strategy (trading within a channel, side channel's breakdown or Fibonacci levels). The indicator has plenty of settings that can be changed according to your strategy and trading style. For those who trade within a channel, the indicator displays inclined or inclined + side channels and defines the side channel's width in the terminal
Some trading strategies are suitable for the quiet market with less volatility, while others are suitable for the volatile and violent market. Either way, traders should have a clear measure of how hot or cold the market is. This product is convenient for traders to compare the degree of cold heat of different trading varieties, or the trading heat of the same trading variety in different time periods. You can put it on different charts to get the intuition. It's easy to see which is more hot an
VirtualTradePad is a panel for managing main orders in МetaТrader 5: Buy, Sell, Buy Stop, Buy Limit, Sell Stop, Sell Limit, Close, Delete, Modify, Trailing Stop. This version is for informational purposes. Analyzing the main trade strategies using 10 indicators and 8 timeframes, the panel draws signal direction. This pane is a part of the VirtualTradePad series that took 2-nd place in the Best Graphic Panel . A free of charge demo version - VirtualTradePad Lite . Graphical Features х - no si
Overview The Expert Advisor sends notifications to a mobile phone, via e-mail or activates an audio alarm in case any changes are detected on the trading account: opening/closing positions, changing order and position parameters, balance or leverage. Also, the Expert Advisor can inform that Equity on the trading account has dropped below a specified value or Free Margin is small compared to Margin. The Expert Advisor does not trade, it only monitors your account and orders. Launching the Expert
Reverse TradeCopier Follow can copy trades from an account that is running Reverse TradeCopier Source. Features: Copies trades from one source (master) account to multiple following (slave) accounts. Allows investor (read only) password for source (master) account. There are no complicated settings and input parameters, everything is easy. Works with different brokers. Works with different quotes symbols (EURUSD_FX, eurusd_m, etc.). Can copy orders from 4-digit quotes platform to 5-digit quotes
Precision trading: leverage wolfe waves for accurate signals Wolfe Waves are naturally occurring trading patterns present in all financial markets and represent a fight towards an equilibrium price. These patterns can develop over short and long-term time frames and are one of the most reliable predictive reversal patterns in existence, normally preceding strong and long price movements. [ Installation Guide | Update Guide | Troubleshooting | FAQ | All Products ] Clear trading signals Amazingly
The indicator shows the strength of bulls and bears on symbols. Period for which the strength is show are customizable: M1, M5, M15, M30, H1, H4, D1, W1, MN1, etc. It supports automatic and manual scrolling to help you find bullish and bearish symbols quickly and clearly. It also supports custom currency sets. Attention: At first run of the indicator, your terminal will probably download required historical data from the server, it is normal process. Both MetaTrader 5 and MetaTrader 4 versions a
Brief Description ElliottWaveMaker 5 Offers: control of manual labeling of Elliott Waves in real time mode (you will always know, if there are labeling errors); view wave rules in Russian or in English language in the terminal window (the wave inspector), edit the wave labeling rules; automatic calculation of price and time targets; fast removal of any part of the wave labeling; assessment of waves according to Fibonacci ratio, internal structure, rules compliance and their sorting in the wave i
거래량 가중 MACD 볼륨 가중 MACD(VW-MACD)는 Buff Dormeier가 작성했으며 그의 책 Investing With Volume Analysis에 설명되어 있습니다. 볼륨 가중 가격 추세의 수렴과 발산을 나타냅니다. 볼륨을 포함하면 VW-MACD가 일반적으로 기존 MACD보다 응답성과 신뢰성이 높아집니다. MACD(이동 평균 수렴 발산)란 무엇입니까? 이동 평균 수렴 발산은 1979년 Gerald Appel에 의해 만들어졌습니다. 표준 MACD는 단기 지수 평균과 장기 지수 평균 간의 차이를 표시합니다. 차이(MACD 라인)가 양수이고 상승하면 가격 추세가 상승하고 있음을 나타냅니다. MACD 라인이 음수이면 가격 추세가 하락하고 있음을 나타냅니다. 이 차이의 부드러운 지수 평균이 계산되어 MACD 신호 라인을 형성합니다. MACD선이 MACD 신호선 위에 있으면 MACD의 모멘텀이 상승하고 있음을 나타냅니다. 마찬가지로 MACD가 MACD 신호선 아래
The iRenkoChart indicator allows creating custom Renko charts. It uses an open format of history files, easy switching between the charts based on Bid and Ask prices, history quality control, ability to use the Expert Advisors, indicators and chart objects for technical analysis and many other things. This indicator is based on iCustomChart and represents its particular implementation. iCustomChart demo version can be downloaded for free . Contents: Advantages and Features Input Parameters Indic