당사를 페이스북에서 찾아주십시오! 당사 팬 페이지에 가입하십시오
MetaTrader 5의 새로운 가능성 사용
Informer for VPS - report on the state of your account via e-mail. Useful for controlling your Expert Advisors that run on a VPS or a dedicated computer. Information about open positions and last deals for a day, week, month or year grouped by currency pairs. Adjustable periodicity of reports and depth of deals included in the report. A possibility to add own comment to each report. You will receive reports on e-mail with specified periodicity: from 15 minutes to once a day. The reports are sen
FXG_Info – the most important data in one place. MetaTrader 5 Indicator FXG_Info provides basic statistical information about a particular currency pair. So that in combination with a chart representing currency price it is easy to determine whether the current situation is good for trading. And when you open a position it will clearly show you the current data such as SL, TP, RR. You are not limited to currency. You can use any market which is provided by you broker. The following information i
This multi-currency Expert Advisor works on 12 currency pairs (EURUSD, GBPUSD, USDCHF, USDJPY, USDCAD, AUDUSD, EURGBP, EURAUD, EURCHF, EURJPY, GBPCHF and GBPJPY) that can be selected in the parameters. Risk management can be set up manually. Optimization of all the parameters makes this EA powerful. It is based on filtered MACD to trigger the BUY or SELL signals. Open positions are closed by take profit, stop loss or according to opposite signals. You can perform optimization regularly for each
Jack Pot is an Expert Advisor based on trend and price action. Advance Money Management provides profits and protects balance from significant loss. Input parameters: Risk - Risk (in percents); Take Profit - Take Profit (in pips); Stop Loss - Stop Loss (in pips); Maximum Lots - Maximum Lots allowed; Control Balance Multiplier - Determine how aggressive lot will grow after loss; First Profit - First Partial Profit point (in pips); System has best results on H2 time frame on symbol EURUSD . Pres
A multi-currency Expert Advisor that works on 8 currency pairs (EURUSD, GBPUSD, USDCHF, USDJPY, AUDUSD, EURJPY, GBPCHF and GBPJPY) that can be selected in the parameters. Risk management can be set up manually. Optimization of the Risk Reward parameter makes this Expert Advisor powerful. It is based on filtered- MACD to trigger the BUY or SELL signals. Open positions are closed by Take Profit, Stop Loss or according to opposite signals. Input parameters: MM - money management usage (true or fals
The Reverse Bar indicator paints the reversal bars according to trade strategy, described by Bill Williams in "Trading Chaos. Maximize Profits with Proven Technical Techniques" book. The bearish reversal bar has red or pink color (red-stronger signal) The bullish reversal bar has blue or light blue color(blue - stronger signal) It is recommended to use it on hourly timeframe (H1) and higher.
This indicator shows Pin Bar candlestick pattern on the chart. The bearish pin bars have red color, the bullish pin bars have blue color. The indicator shows alert when Pin Bar candlestick pattern is formed. It's recommended to use it at timeframes H1 and higher. The best moment (strong signal) is when Pin Bar is formed close to the support/resistance level.
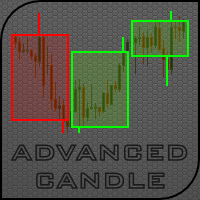
Advanced Candle indicator is designed to display four candle types (including non-standard ones) on the main chart: HTF Candles allow to display candles for any time frame, including non-standard ones. For example, М27 or М135; Box Candles (candles having their minimum height set in points or percentage value) allow to generate candles having specified minimum height, for example, of 100 points or 0.5%; Volume Candles (candles having their minimum volume set in tick volume or real volume) allow
This indicator let user clearly see Buy/Sell signals. When a bar is closed and conditions meet, arrow signal will come up at Close Price, up is Buy and down is Sell. It works on all Timeframes. And you can set sound alert when signals come up.
Multi-currency Trailing Stop. Classic Trailing Stop. It only changes order Stop Loss when the current price reaches Trailing Stop Start pips of profit, securing/"locking" more profit as the price moves in favor of a trade. It allows flexible position filtering and processing by: Pair Magic Position Position Type The Expert Advisor can be placed on any chart. You can use Advanced Trailing Stop simultaneously with any other Expert Advisor. It also features: On Screen Display Extended logging Sep
MACD Histogram tracks the difference between the MACD line and the Signal line (which is the exponential moving average of the first line). For better visibility, when plotting the lines and the histogram in the same window, we scale up the histogram by a factor of 2. Furthermore, we use two separate plots for the histogram, which allows us to color-code the bars for upticks and downticks. The MACD Combo overlays MACD lines on MACD Histogram. Putting both plots in the same window enables you to
The MACD XOver indicator was developed by John Bruns to predict the price point at which MACD Histogram will reverse the direction of its slope. The indicator is plotted one day ahead into the future, allowing, if your strategy depends on MACD Histogram, to predict its reversal point for tomorrow (or the next bar in any timeframe). If the closing price tomorrow is above the value of this indicator, then MACD Histogram will tick up. If the closing price tomorrow is below the value of this indicat
Better Neural Network is the next generation of Kub Expert Advisor, which won the Automated Trading Championship'2007 . It is based on the modified probabilistic neural network forecasting price dynamics for the next several bars. Compared with the standard probabilistic network, the Expert Advisor is provided by preliminary inputs quantization to reduce the network dimension. Also, it has recurrence relations in the neurons output layer to better determine the time patterns. Besides, the networ
Flash Neural Network EA is Expert Advisor based on Neural Network with back propagation learning algorithm. This software can be used on ANY market and on ANY time frame. Every parameter of network is fully configurable. Most complicated and time-consuming part of building successful neural decision model is proper input data preparation. Now everything is fully automated . You need to only pick input symbols, set neural network parameters as number of hidden layer neurons, maximal training ep
Features The Expert Advisor's conditions for entering and exiting the market are based on the MultiSignals_PCH indicator, which can be downloaded for free from Code Base . The Expert Advisor can be used for trading in the manual, semi-automatic or automatic mode. Multi-currency trading. This version supports 3 symbols. Multi-system trading. In this version, you can set up 4 strategies for each symbol. The Expert Advisor sets a unique magic number for each strategy. Multi-timeframe trading. You
MetaTrader 5용 트레이딩 패널 — 차트와 키보드에서 실행하는 프로페셔널 원클릭 트레이딩 활동적인 트레이더를 위해 설계된 고급 Trading Panel로, MetaTrader 기본 인터페이스보다 훨씬 빠르고 직관적으로 포지션과 주문을 열고, 관리하고, 종료할 수 있습니다. 이 패널은 포지션 관리, 대기 주문 제어, 총수익 관리, 체결 속도를 하나의 전문적인 작업 공간에 통합하고 싶은 트레이더를 위한 솔루션입니다. 이것은 단순한 보조 유틸리티가 아닙니다. MetaTrader 5를 위한 진정한 trading cockpit입니다. 차트에서 직접 거래하고, 키보드로 빠르게 명령을 실행하며, 자동 계산과 시각적 가이드를 통해 수동 트레이딩을 더 빠르고, 더 명확하고, 더 편리하게 만들어 줍니다. 이 패널을 사용하면 차트에서 단 한 번의 클릭으로 거래를 실행할 수 있으며, 표준 MetaTrader 컨트롤보다 최대 30배 빠르게 거래 작업을 수행할 수 있습니다. 새로운 프리미엄 버전
The indicator shows the timetable of the world's stock exchanges in a separate window in visual mode. Based on Time, Forex sessions and Trade Hours monitor by Vadim Baklanov (2009), converted to MQL5 by ARIES Software Corp . Input parameters: Brokers standard time zone (UTC+): - Local Time, Standard UTC + offset broker server time; Broker DST start - Date and time daylight savings time server time broker; Broker DST end - Date and time of the transition to winter time; Clock color - Clock colo
EasyPen is designed as beautiful and innovative way to create and manage all your chart analysis, scribbles, notes and more. The app takes advantage of new MQL5 technology to offer an experience unseen in the other apps or in older MQL versions. An App That Changes Everything There is no existing drawing app that allows the level of customization that EasyPen offers. Change color of your pen, choose brush size, save drawings, keep drawings attached to specific position in chart, and more. With o
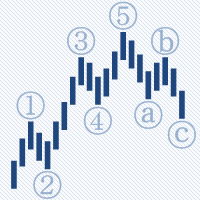
AutoElliottWaveMaker is the first tool for MetaTrader 5 , created for semi-automatic analysis of Elliott waves. It has many unique features: Automatic bar binding of waves for all timeframes; The waves can be labelled in 2 ways: drag and drop from the Labels panel and using the mouse click on the bar; Automatic arranging of the labels at all timeframes according to wave levels seniority; Automatic and manual control of the number of wave levels shown on a chart; Wave levels custom labelling sty
This Expert Advisor is version of MetaQuant-ATC10 , modified for one currency pair, with the possibility to adjust and optimize all parameters. Of course, can be attached to more/several currency pairs and get a result like in the Automated Trading Championship 2010 . The Expert Advisor is based on the "Averaging Grid". If the position is developing at a loss, open new orders in variable step. The aim is to approach the average price of a position to the market price, so the correction will turn
ZoneSession allows you to visually show various trading zones on your chart. Excellent for live trading, but also at a glance you can review history for optimum trading sessions to analyse your trade setups. Zone Session shades the chart into sessions of your choice in any combination of colors.
This script help user to record the values of Bollinger Bands indicator and OHLC at the moment once deals happen. The data saved as .CSV file so you can quantitative analysis someone's trading. Please input value of Bollinger Bands parameters you like. It tells you the path of data file when script is stopped.
Spiral 12 is not the result of excessive optimization or curve fitting, but rather analysing the medium-term characteristics of the Euro-Sterling and redesigning a stable system based on these observations. Spiral12 trades the EURGBP M30, places less trades than the Spiral11 M15 ( ATC 2011 ) but selects more refined, profitable entries and exits. Expert Advisor uses Moving Average , Envelopes and grid applied at specific times during the close of the US session. Full input control over all ind
MACD techniques are commonly used in the daily tradings. It is useful to find the market trend and divergence/convergence of current trend. This version of MACD is better for people who are doing real world trading to make decisions even faster. It is based on the default MACD, plus the features of the strength of the market force(green bar for long strength, red bar for short strength), and arrows indicating the type of position to open/close. By comparing the piles of the strength bars, you ca
The Red Green Trade Signals indicator just gives you the direct signal to open and close your positions, just like traffic signals. When the signal turns to red, the market goes to short position, while the signal turns to green, the market goes to long position. This indicator also provides the precise time and price to open/close your positions with the 'buy' (green) and 'sell' (red) arrows. It's easy to use, and it's ready to go without any parameter to set. This indicator is implemented by c
This Expert Advisor won 1st place in the Automated Trading Championship 2010. The trade system is based on analysis of Moving Average indicator. The EA can work at any symbol and timeframe, but better results can be achieved on EURUSD, GBPUSD and M5/M15 timeframes. It uses pending orders when trading, so the entry price has no slippage. Buy order is placed: At strong upper price movement the EA places pending order at price of the moving average - shift. When price is changed, it modifies the pe
This utility is used to visually choose an indicator for trailing stop and select its parameters. The Expert Advisor modifies the Stop Loss order position opened for the instrument of the current chart based on indicator values. Uses indicators Parabolic SAR , NRTR (Nick Rypock Trailing Reverse) , Moving Average or linear regression channel. The indicators are added to or removed from the chart using the 'show' checkbox. The following options are available: Parabolic - trailing stop based on th
이 스캘퍼 표시기는 2포인트의 위험으로 안전하게 10포인트 수익을 얻을 수 있는 순간을 보여줍니다. 적절하게 자금 관리를 사용하면 낮 동안 예금을 크게 늘릴 수 있습니다. 표시기에는 추세 계산에 사용되는 막대 수라는 하나의 입력 매개변수만 있습니다. 시그널이 나타나면 현재 가격(매수)보다 2포인트 높은 가격(매수) 또는 2포인트 낮은 가격(매도)에 Pending order를 합니다. 손절매 - 2-3점; 이익을 얻으십시오 - 10 pont에서; 권장 기간 - M1. 변동성이 크고 스프레드가 작은 기호 - EURUSD, AUDUSD, GBPUSD, EURJPY 등 포지션이 개설되었지만 가격이 이익실현 가격에 도달하지 않은 경우 손절매를 손익분기 수준으로 수정하고 이전 막대의 낮은 가격(롱 포지션의 경우) 또는 이전 막대의 높은 가격에서 포지션의 후행 스탑을 사용합니다. 숏 포지션용 바. 참고: 이 표시기를 임대하는 대신 구입하는 경우 지불 증명서를 보
Traders Dynamic Index (TDI) - Overview The Traders Dynamic Index (TDI) is a versatile indicator based on the RSI oscillator. It helps traders identify market conditions and potential reversals. The TDI combines multiple indicators into one, providing a comprehensive view of market dynamics. Components: - Green line: RSI Price Line - Red line: Trade Signal Line - Blue fill: Volatility Band - Yellow line: Market Base Line Visual Signals: 1. Trend Direction: - Immediate: - Green over
DCMV Trade Channel Oscillator The indicator calculates the values of DCMV trade channel oscillator: Trade channel width. The value of trade channel depends on the trend (it increases at start of the trend and has the maximum values at end of the trend). The value of trade channel decreases at flat movement. The lowest values of channel width indicates the high probability of the very strong price movement. The +DC line shows the "bulls" power. The -DC line shows the "bears" power. The value of
This indicator is used to distinguish between different trading hours. By Asia, Europe and the Americas volatility, it has drawn with different colors.
The purpose of Impulse Release is to prevent trading in the wrong direction. While the Impulse System operates in a single timeframe, Impulse Release is based on two timeframes. It tracks both the longer and the shorter timeframes to find when the Impulse points in the same direction on both. Its color bar flashes several signals: If one timeframe is in a buy mode and the other in a sell mode, the signal is "No Trade Allowed", a black bar. If both are neutral, then any trades are allowed, showi
Some traders don't like expose Take Profit/Stop Loss level in their positions, this Expert Advisor can help them. Put it to chart and set Take Profit/Stop Loss pips (0 means ignore), it watch the price of the symbol on chart and close the position if price reach Hidden TP/SL level. It hide user's TP/SL price in effect. Welcome to contact me. 。。。。。。。。。。。。。。。。。。。。。。。。。。。。。。。。。。。。。。。。。。。
The AdvancedTrend indicator automatically traces market price movement and draws a pair of resistance and support lines. It's easy to figure out market trend with resistance level and support level and when/how market breaks out key price level.
One of the key rules in trading is never move your stops in such a way that your risk increases. Our stop sequence shows the automatic tightening of stops. They appear as a series of decreasing risk points until the trade is eventually stopped out. The problem is that if you enter a trade at any other point than the initial dot of the sequence, you may be placing the stop too close. Stop-entry plots show you the initial value for the stop for each bar. You can use them when you put on a trade,
엔벨로프 또는 채널 라인은 이동 평균과 평행하게 설정됩니다(두 개의 MA를 사용하는 경우 느린 MA로). 두 채널 라인은 일별 차트에서 지난 2~3개월 동안의 모든 가격의 약 95%를 포함해야 하며, 극단만 외부로 돌출되어 있어야 합니다. 채널 라인은 매력적인 수익 목표를 제공합니다. 상단 라인 근처에서 매수를 매도하고 하단 라인 근처에서 매도를 커버합니다. AutoEnvelope는 마지막 100개 막대에 대한 표준 편차를 계산하여 채널 너비를 자동으로 선택하는 원래 도구인 사용자 지정 표시기입니다. 고정 채널 크기를 사용하거나 최대 한 주에 한 번(주간 차트에서 한 달에 한 번) 값을 변경하도록 설계되어 하루 중 데이터에도 적합합니다("고정 채널 크기" 매개변수를 사용하여 전환 한 모드에서 다른 모드로). EMA는 AutoEnvelope에 추가로 표시됩니다. 이 조합을 사용하면 두 개의 별도 표시기를 조정하지 않고도 EMA를 변경하고 봉투가 이를 따르도록 할 수 있습니다. 이
Indicator to measure market activity and to show speed of price in pips/sec. Have you been wondering, what is current speed of the market? I see the ticks jumping up and down, can I measure their speed? All these questions can be answered by Tick Speed v1.0 - good looking indicator with good configuration possibilities. It will show you directional movement speed in ticks per second or in time defined by you! Good for scalpers, good for long term-traders. Good for beginners, good for pros. Th
FXJet is a Expert Advisor, using price action, to determine trend. Advance Money Management provides profits and protects balance from significant loss. Input parameters: Risk - Risk (in percents); Take Profit - Take Profit (in pips); Stop Loss - Stop Loss (in pips); Maximum Lots - Maximum Lots allowed; Control Balance Multiplier - Determine how aggressive will grow lot after loss; First Profit - First Partial Profit point (in pips); Second Profit Parameter - Second Profit Parameter; Move Stop
This script allows users to obtain MACD and OHLC values for each bar on the current chart. The information is saved as a CSV file allowing you to perform quantitative analysis using MACD. Please specify MACD parameters you like. After exporting the report, the script tells you the path where the file is saved.
GoodTrade is the very first Expert Advisor purchased on the Market. On the occasion of the second anniversary of availability of the Expert Advisor on the Market, you are now looking at the second version of the Expert Advisor featuring a completely updated operating logic. GoodTrade now uses a new universal trading signal suitable for various trading instruments and working over long time periods. By default, the Expert Advisor is set to trade GBPUSD. Try it for other trading instruments. Set a
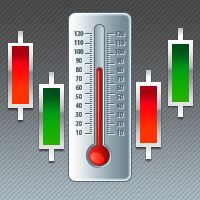
The Market Thermometer is described in "Come into my Trading Room" book. It measures the degree of volatility, as reflected in greater or smaller intraday ranges. When the Market Temperature spikes above its average or stays below its average for a number of days, it gives trading signals, as described in the book. Parameters: Thermometer_EMA_Length (22) – The length of the moving average of the Market Temperature. The default 22, the average number of trading days in a month. Spike_Alert_Facto
If you want something as below: Sell FOREX trading signal. Manage multiple accounts. Follow somebody's trading. "TradeCopier_source" and "TradeCopier_follow" can help you! Features: Copying from one source (master) account to multiple follower (slave) accounts. Allow investor (read only) password for the source (master) account. There are no complicated settings and input parameters, everything is easy. Works with different Brokers. Works with different symbols (EURUSD_FX, eurusd_m, etc.). Can c
Some trading strategies are suitable for the quiet market with less volatility, while others are suitable for the volatile and violent market. Either way, traders should have a clear measure of how hot or cold the market is. This product is convenient for traders to compare the degree of cold heat of different trading varieties, or the trading heat of the same trading variety in different time periods. You can put it on different charts to get the intuition. It's easy to see which is more hot an
The script creates account summary report in a separate window. The report can be created for all deals and on deals for selected financial instruments. It is possible to specify a time interval of calculation and save report to htm-file. The script creates account summary report in a separate window. The report can be created for all deals and for deals of the selected financial instruments. It is possible to specify a time interval of calculation and save report to htm-file. Input parameters
This script notifies a user about different events by playing sounds, sending emails and text messages to a mobile device. The following events are supported: New deals (in/in out/out). Expiration of Pending orders. The terminal disconnected. The terminal or the script closed. Please set a notification type for each event separately. If you need notifications via Email, please make sure that the settings on the Email tab are correct. If you need to receive notifications on a mobile device, pleas
The script allows to easily watch the date and time of several cities selected by the user from more than 30 important cities all over the world. It also shows GMT, Server time and Local time. The cities on the screen are automatically sorted by the date and time. You can save your setting on the Inputs tab and use them in future. Notice: Daylight saving time is not considered.
Info tool helps to estimate the current risks of open positions and orders. It allows to analyze open positions or/and pending orders, also there are USD/Percentage modes. Expands the margin load and the share of profit participation for individual positions. Информационная панель помогает оценить текущие риски по открытым позициям и ордерам. Есть возможность отдельного анализа рисков по позициям/отложенным ордерам, а также в режимах USD/Percentage. Раскладывает маржинальную нагрузку и долю учас
The script shows statistics of trades for the specified period. For example, if you want to know the details of trades of the ATC2010 Winner ( bobsley ): Login with his account using the investor (read-only) password (MetaTrader5); Open the chart of his trading symbol (EURUSD); Run this script on the chart; Specify 2010.10.1 in "date from", and the diagram will be shown.
The idea of the system is to indentify the reversal patterns using the calculation of the composite candle. The reversal patterns is similar to the "Hammer" and "Hanging Man" patterns in Japanese candlestick analysis. But it uses the composite candle instead the single candle and doesn't need the small body of the composite candle to confirm the reversal. Input parameters: Range - maximal number of bars, used in the calculation of the composite candle. Minimum - minimal size of the composite can
The trade strategy is based on three moving averages. To determine the trend, it uses three exponentially smoothed moving averages: FastEMA, MediumEMA and SlowEMA. Trade signals: Buy signal: FastEMA>MediumEMA>SlowEMA (upward trend). Sell signal: FastEMA<MediumEMA<SlowEMA (downward trend). Input parameters: Inp_Signal_ThreeEMA_FastPeriod = 8; Inp_Signal_ThreeEMA_MediumPeriod = 38; Inp_Signal_ThreeEMA_SlowPeriod = 48; Inp_Signal_ThreeEMA_StopLoss = 400; Inp_Signal_ThreeEMA_TakeProfit = 900; Inp_
The strategy is based on price crossover with Moving Average indicator, confirmed by ADX indicator. The trade signals: Buy: closing price of the last completed bar is higher than moving average, the moving average increases at the current and last completed bars. Sell: closing price of the last completed bar is lower than moving average, the moving average decreases at the current and last completed bars. To filter the false signal, it checks the trend power (ADX>ADXmin) and trend direction usin
The strategy is based on the Alligator technical indicator, described by Bill Williams in "Trading Chaos". The system is based on three moving averages (Lips, Teeth and Jaw lines), and oscillators, calculated using the difference between them. The trading signals are generated after crossover of the Alligator lines, depending on trend, determined by order of these lines. In the case of upward trend the Lips line (with minimal period) is the highest, the next is the Teeth line, and the lowest is
Chaikin's volatility indicator calculates the spread between the maximum and minimum prices. It judges the value of volatility basing on the amplitude between the maximum and the minimum. Unlike Average True Range , Chaikin's indicator doesn't take gaps into account. According to Chaikin's interpretation, a growth of volume indicator in a relatively short space of time means that the prices approach their minimum (like when the securities are sold in panic), while a decrease of volatility in a l