Evgeniy Zhdan / 프로필
- 정보
|
13+ 년도
경험
|
175
제품
|
288
데모 버전
|
|
1
작업
|
0
거래 신호
|
0
구독자
|
Products: https://www.mql5.com/en/users/trendhunter/seller
➖➖➖➖➖➖➖➖➖➖➖➖➖➖➖➖➖➖➖➖➖➖
📢 TELEGRAM CHANELL: https://t.me/algotrdr
➖➖➖➖➖➖➖➖➖➖➖➖➖➖➖➖➖➖➖➖➖➖
💬 Channel: https://www.mql5.com/ru/channels/algotrader
➖➖➖➖➖➖➖➖➖➖➖➖➖➖➖➖➖➖➖➖➖➖
https://fundrates.net — real-time crypto funding screener. Track negative funding, spot early trend shifts, and catch reversals before they happen. Be one step ahead.
➖➖➖➖➖➖➖➖➖➖➖➖➖➖➖➖➖➖➖➖➖➖
The strategy of the adviser determines the direction, the strength of the trend and the behavior of prices in the zone of "round" price levels. If several factors coincide, the adviser starts working in the direction of the most likely price movement. The Expert Advisor uses a unique algorithm for tracking open positions. Each position advisor has a stop loss and take profit. Dangerous trading methods are NOT used. Recommended trading instruments (TF 5m): GBPUSD, EURUSD. For 24/7 advisor
🎁🎁🎁Buy one, the second for free!🎁🎁🎁
MT4: https://www.mql5.com/en/market/product/3793
MT5: https://www.mql5.com/en/market/product/70409
The EA uses a unique non-linear formula for calculating market entry points and a unique algorithm for fixing the result of work. The trading expert does not use the increase in the volume of transactions to block unprofitable positions. Mandatory take profit and stop loss levels are used. Support: https://www.mql5.com/en/channels/TrendHunter The adviser controls the spread increase by the broker and skips trading until the spread returns to its "normal" values. The best results are achieved
✅The indicator defines the market status.
✅If the price is below any of the two histograms and two lines (red and blue), this is the sell zone.
✅If the price is above any of the two histograms and two lines (red and blue), this is the buy zone.
✅If the price is between the two lines or within the borders of any of the two histograms, the market is flat.
✅See the screenshots for better understanding. https://www.mql5.com/en/market/product/3793
This indicator is capable of replacing an entire trading system.
https://www.mql5.com/en/market/product/70689
Indicator of trend lines and trend reversal points on different timeframes. This indicator is capable of replacing an entire trading system. The main red line shows the direction of the overall trend. Other lines represent support and resistance lines. Other signals: Small red squares: high / low of the lower timeframe; Purple rhombus: high / low of the current timeframe; Circles in a dot: high / low of the higher timeframe; Settings: Fast period - Fast average period; Slow period - Slow
The main red line shows the direction of the overall trend.
https://www.mql5.com/en/market/product/70689
Indicator of trend lines and trend reversal points on different timeframes.
https://www.mql5.com/en/market/product/70689
Indicator of trend lines and trend reversal points on different timeframes. This indicator is capable of replacing an entire trading system. The main red line shows the direction of the overall trend. Other lines represent support and resistance lines. Other signals: Small red squares: high / low of the lower timeframe; Purple rhombus: high / low of the current timeframe; Circles in a dot: high / low of the higher timeframe; Settings: Fast period - Fast average period; Slow period - Slow
평면 및 추세를 결정하기 위한 표시기. 가격이 2개의 히스토그램과 2개의 선(빨간색 및 파란색) 중 하나보다 낮으면 판매 영역입니다. 이 버전의 표시기를 구매할 때 하나의 실제 계정과 하나의 데모 계정에 대한 MT4 버전 - 선물로(수신하려면 개인 메시지를 작성하세요)! 가격이 2개의 히스토그램과 2개의 선(빨간색 및 파란색) 중 하나보다 높으면 구매 영역입니다. MT4 버전: https://www.mql5.com/en/market/product/3793 가격이 두 라인 사이 또는 히스토그램 영역에 있으면 시장에 명확한 추세가 없습니다. 간단히 말해서 시장은 평평합니다. 표시기의 작업은 스크린샷에 더 명확하게 표시됩니다. 지표는 선행 데이터를 얻는 데 사용할 수 있습니다. 또는 현재 추세의 상태를 확인합니다
The trend expert determines the patterns of price consolidation and works towards the continuation or change of the trend. The best results are achieved when trading on trading instruments (TF 5M) EURUSD, GBPUSD, USDJPY . It is important that your broker's spread does not exceed: EURUSD 10 pips; GBPUSD 20 pips; USDJPY 80 pips. The Expert Advisor does not use dangerous trading methods: there is no martingale system, no averaging. Each trade has a stop loss and a take profit. The Expert Advisor
MT4: https://www.mql5.com/en/market/product/3793
MT5: https://www.mql5.com/en/market/product/70409
평면 및 추세를 결정하기 위한 표시기. 가격이 2개의 히스토그램과 2개의 선(빨간색 및 파란색) 중 하나보다 낮으면 판매 영역입니다. 이 버전의 표시기를 구매할 때 하나의 실제 계정과 하나의 데모 계정에 대한 MT4 버전 - 선물로(수신하려면 개인 메시지를 작성하세요)! 가격이 2개의 히스토그램과 2개의 선(빨간색 및 파란색) 중 하나보다 높으면 구매 영역입니다. MT4 버전: https://www.mql5.com/en/market/product/3793 가격이 두 라인 사이 또는 히스토그램 영역에 있으면 시장에 명확한 추세가 없습니다. 간단히 말해서 시장은 평평합니다. 표시기의 작업은 스크린샷에 더 명확하게 표시됩니다. 지표는 선행 데이터를 얻는 데 사용할 수 있습니다. 또는 현재 추세의 상태를 확인합니다
Trade expert with proof of work.
Download demo right now:
https://www.mql5.com/en/market/product/52949
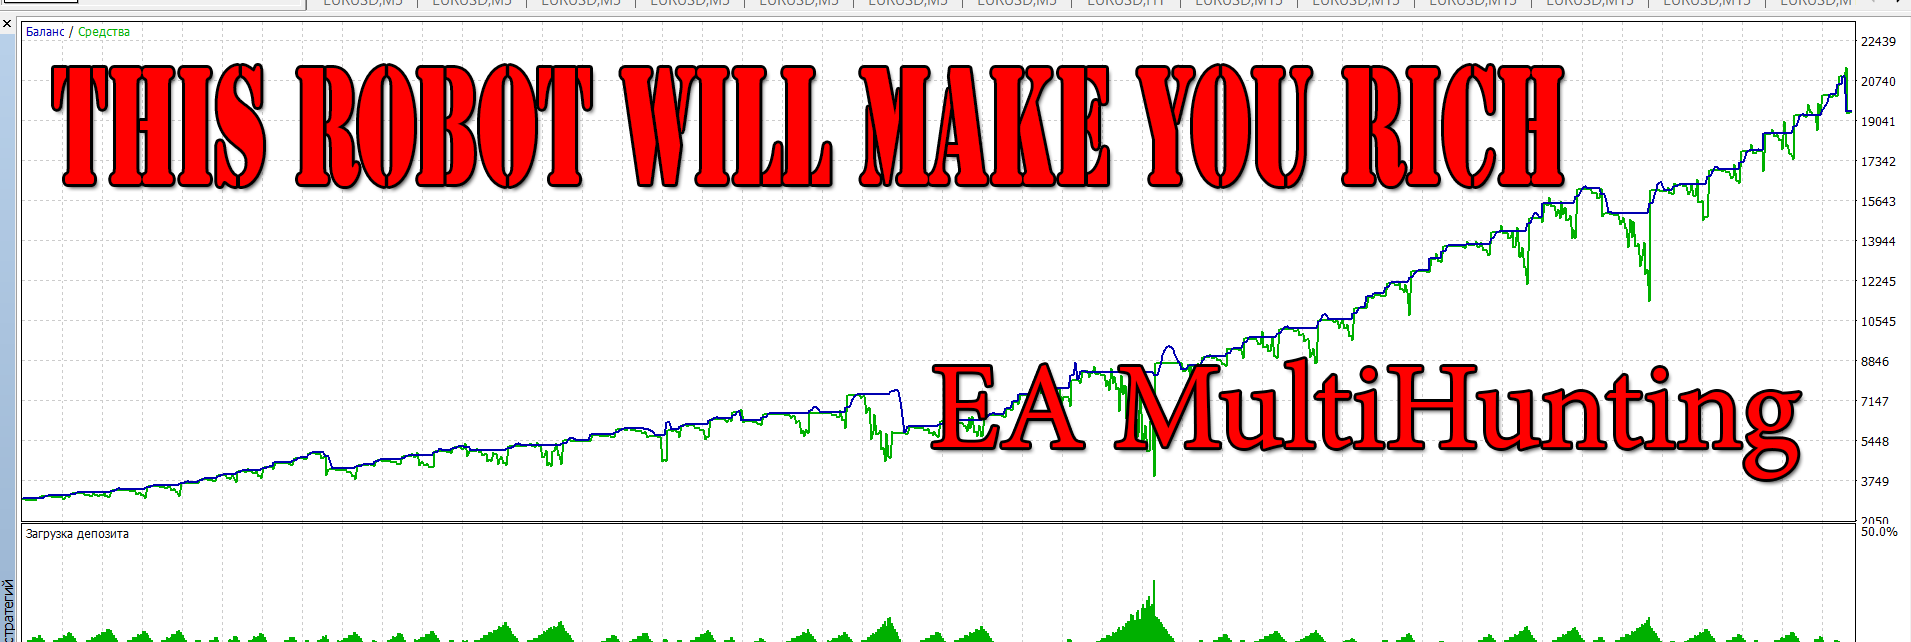
MultiHunting
✅Multicurrency Expert Advisor is based on a correlation system between trading instruments and position volumes.
✅The key role is played by the money management system and the unique ratio of the number and direction of open transactions.
📈 Download it now and check its work!
❗❗❗ ATTENTION - the advisor can be removed from sale at any time!
https://www.mql5.com/en/market/product/52856
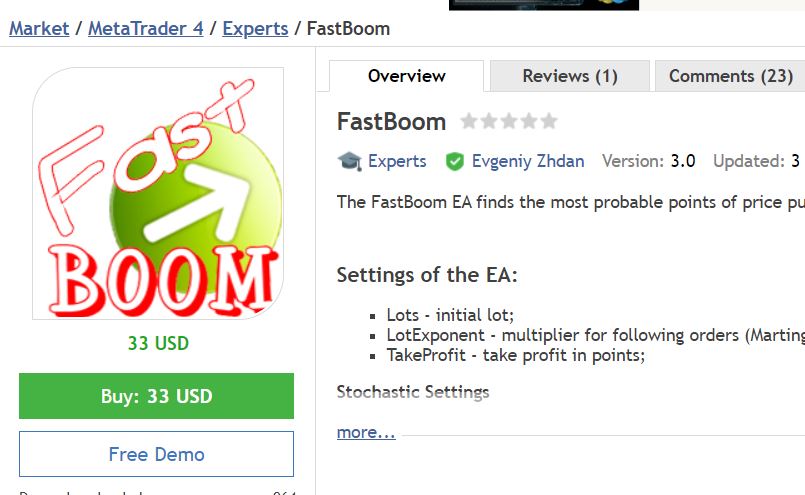
The FastBoom EA finds the most probable points of price pullback/reverse and places an order. It places averaging orders if the price moves further against take profit. Settings of the EA: Lots - initial lot; LotExponent - multiplier for following orders (Martingale). 1 - no multiplier. TakeProfit - take profit in points; Stochastic Settings InpKPeriod - K Period of Stochastic InpDPeriod - D Period of Stochastic InpSlowing - Stochastic Slowing LevHigh - level for sell positions of Stochastic
https://www.mql5.com/en/market/product/67302
The indicator combines several types of calculation: calculation of price channels and determining the direction of the trend. The green line is a buy signal ; The magenta line is a signal for sales . Two yellow lines of the "small" channel above the middle green line - getting ready for sales; Two yellow lines below the magenta line - getting ready to shop. Blue channel lines - the higher the distance between the lines, the closer the price rollback or trend reversal. The indicator can be used