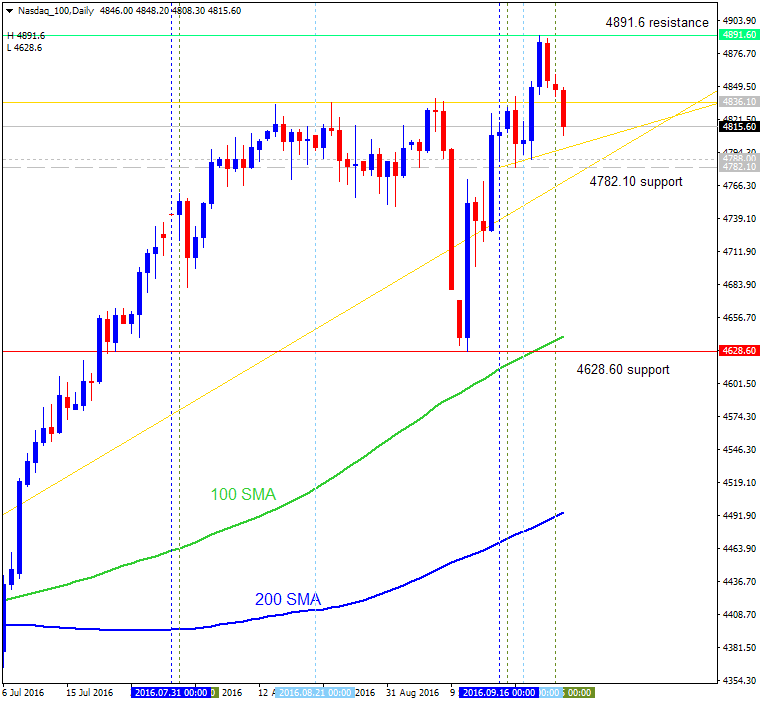
If we analyse NASDAQ in 'american way' using 100 SMA/200 SMA (Moving Averages) so we can get the following: Dailty chart (till October this year) . The price is located on the primary bullish area for
Intra-Day Fundamentals - EUR/USD and USD/CAD: U.S. New Home Sales 2016-09-26 14:00 GMT | [USD - New Home Sales] past data is 659K, forecast data is 598K, actual data is 609K according to the latest
S&P 500 October-December 2016 Forecast: bullish ranging within s/r channel W1 price is on bullish ranging condition located above Ichimoku cloud for the ranging within 2191.25 resistance level for the bullish trend to be resumed and 2106.75
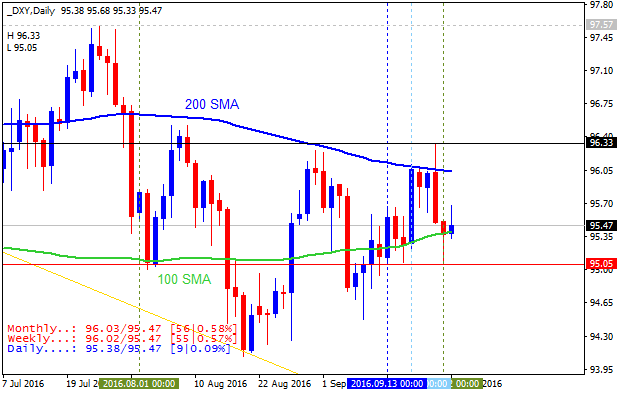
Dollar Index October-December 2016 Forecast: bearish ranging near weekly bullish reversal W1 price is on ranging to be near and below Ichimoku cloud on the border between the primary bearish market condition to be started. The symmetric triangle
GOLD (XAU/USD) October-December 2016 Forecast: ranging for the bullish trend to be continuing or for the secondary correction to be started W1 price is located above Ichimoku cloud in the bullish area of the chart. The price is on ranging within the
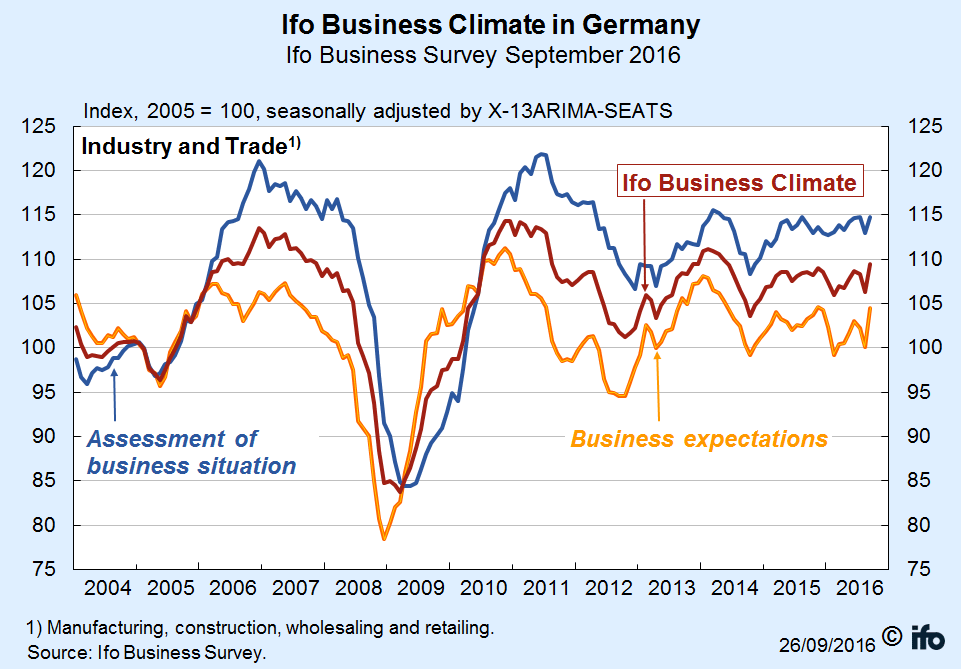
EUR/USD Intra-Day Fundamentals: German IFO Business Climate and 11 pips price movement 2016-09-26 08:00 GMT | [EUR - German IFO Business Climate] past data is 106.2, forecast data is 106.3, actual
The new version of the MetaTrader 5 Android mobile platform features the optimized use of price charts: The application supports the multi-window mode allowing traders to monitor price changes on multiple symbols simultaneously. Added the ability to
NZD/USD Intra-Day Fundamentals: New Zealand Overseas Merchandise Trade and 16 pips price movement 2016-09-25 21:45 GMT | [NZD - Trade Balance ] past data is -351M, forecast data is -730M, actual data
USD/CNH October-December 2016 Forecast: ranging within narrow s/r levels for the bullish trend to be continuing or to the correction to be started W1 price is located above Ichimoku cloud in the bullish area of the chart for the ranging within the
DAX Index October-December 2016 Forecast: ranging inside Ichimoku cloud waiting for direction of the trend W1 price was on the local uptrend as a bear market rally within the primary bearish market condition: the price came to the Ichimoku cloud from
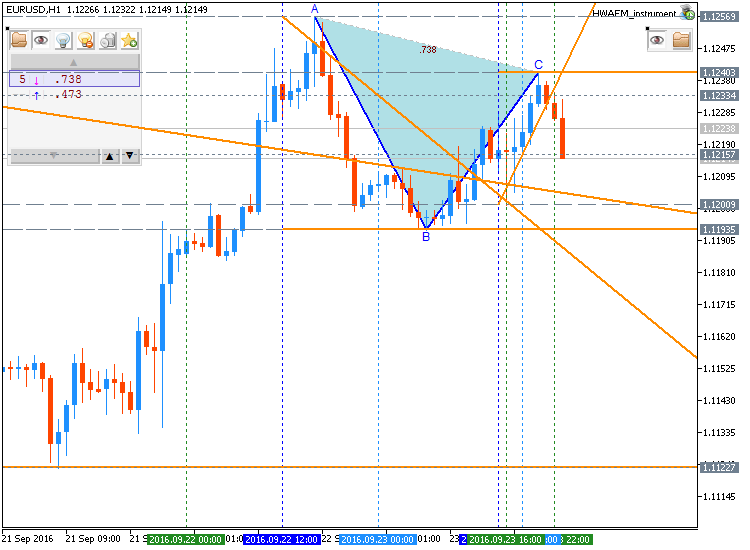
Daily price is located above Ichimoku cloud in the bullish area of the chart: the price is on ranging within the following key support/resistance levels: 1.1283 resistance located above Ichimoku cloud in the bullish trend to be resumed, and 1.1122
Weekly Outlook: 2016, September 25 - October 02 (based on the article ) The Fed came and went and so did the BOJ, leaving a mixed picture after the high tension. Speeches from Yellen and Draghi among
Fundamental Weekly Forecasts for Dollar Index, USD/JPY, GBP/USD, AUD/USD, USD/CNH and GOLD (based on the article ) Dollar Index - " Where rate speculation will offer the most proactive market
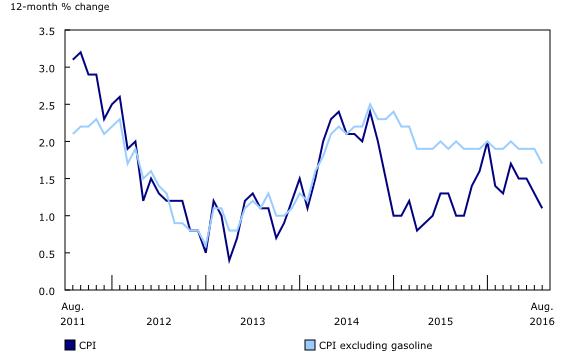
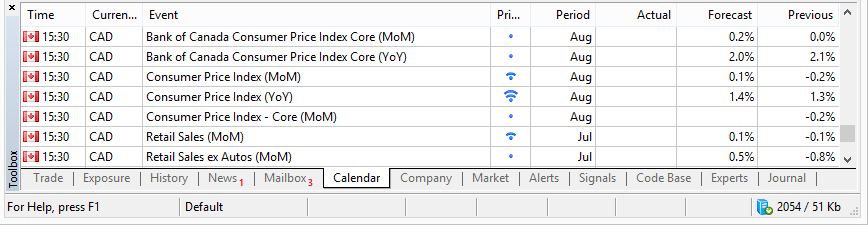
USD/CAD Intra-Day Fundamentals: Canada's Consumer Price Index and 123 pips range price movement 2016-09-23 12:30 GMT | [CAD - CPI] past data is 1.3%, forecast data is 1.4%, actual data is 1.1%
Trading News Events: Canada Consumer Price Index (adapted from the article ) " Despite forecasts for a uptick in Canada’s Consumer Price Index (CPI), a marked slowdown in the core rate of inflation
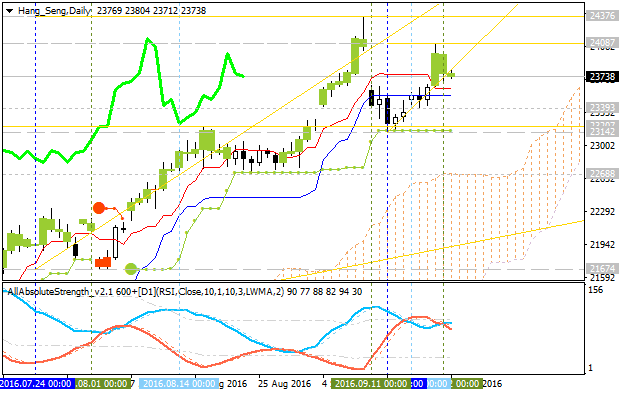
Hang Seng Index (HSI): End Of Week Technicals - bullish continuation or the correction to the bearish reversal This trading week is ended with some results concerning HSI: the price was continuing