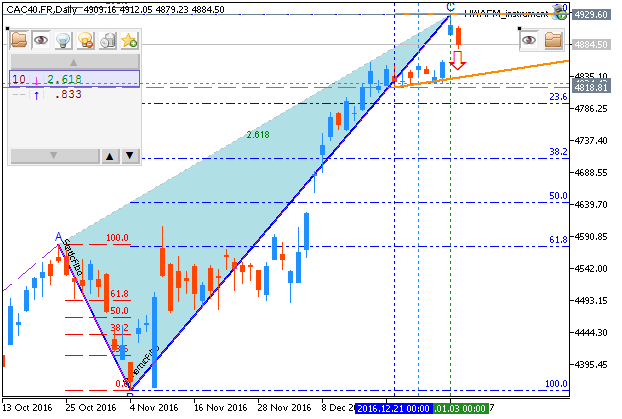
CAC 40 Stalls Under Previous High (based on the article ) "The CAC40 has stalled under yesterday’s high of 4,929.60, and is currently trading down -0.11% for the session. Top winners for the Index
CAC 40 January-March 2017 Forecast: bullish with key resistance at 4924.69 W1 price is located above Ichimoku cloud in the bullish area of the chart. The price broke 4860.85 resistance level to above on close weekly bar with 4924.69 as a
Laguerre scalping system Template file is attached for this scalping system, Laguerre indicator (for MT5) is on this page free to download. Forum on trading, automated trading systems and testing
2017 Energy Outlook: Must-Follow Sectors (based on the article ) OPEC: "Market watchers will need to keep tabs on OPEC and non-OPEC monthly production decreases to see if key oil producers are
XAU/USD January-March 2017 Forecast: bearish ranging to the bear market rally W1 price is located below Ichimoku cloud in the berish area of the chart. The price broke Ichimoku cloud together with Senkou Span lines to below in the beginning of
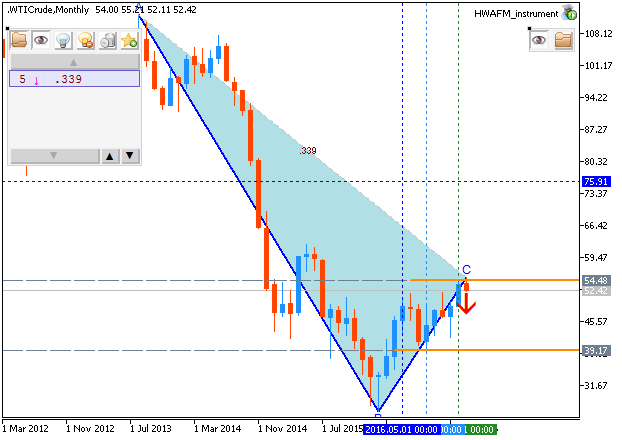
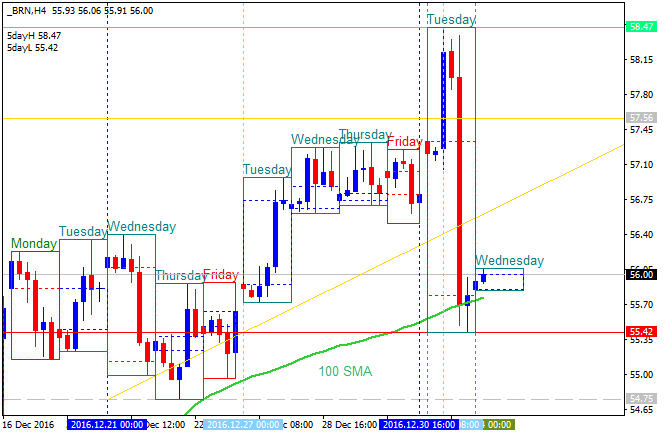
CRUDE OIL Short-Term Technical Analysis: intra-day ranging bullish or the secondary correction (adapted from the article ) H4 price is located above 200 SMA with near and above 100 period SMA (100
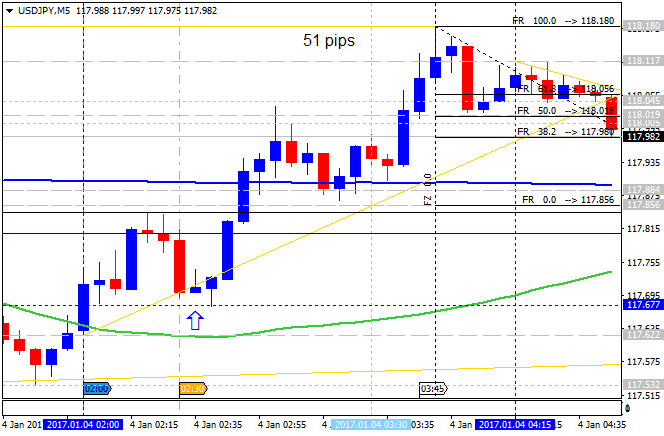
USD/JPY Intra-Day Fundamentals: Nikkei Japan Manufacturing PMI and 51 pips range price movement 2017-01-04 00:30 GMT | [JPY - Manufacturing PMI] past data is 51.9, forecast data is 51.9, actual data
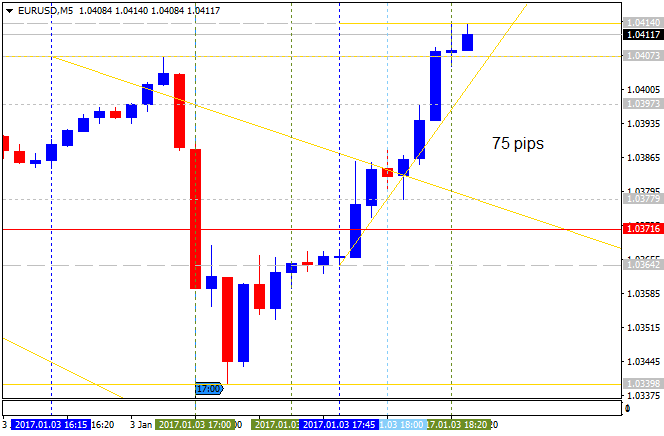
Intra-Day Fundamentals - EUR/USD, GBP/USD and S&P 500: ISM Manufacturing PMI 2017-01-03 15:00 GMT | [USD - ISM Manufacturing PMI] past data is 53.2, forecast data is 53.7, actual data is 54.7
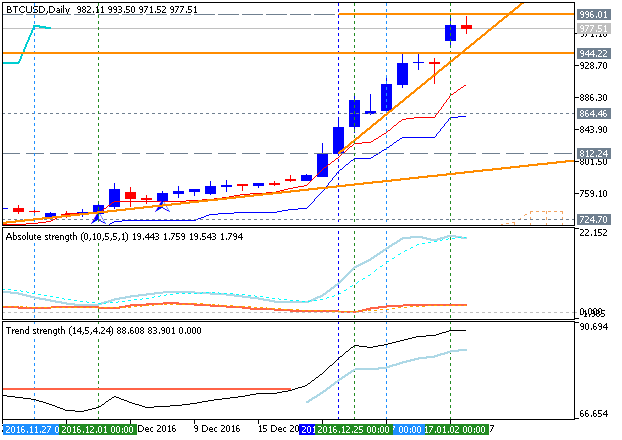
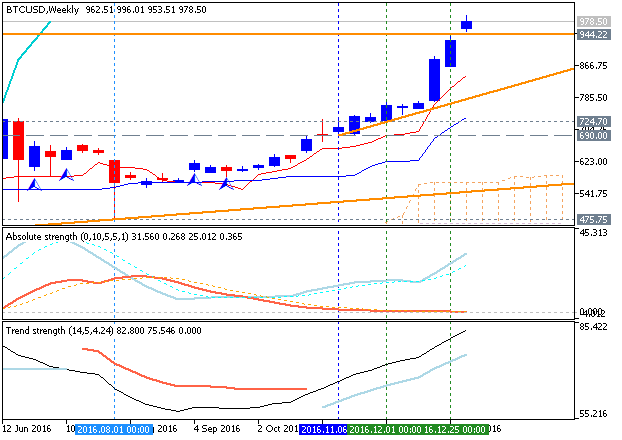
Sergey Golubev : Bitcoin vs USD January-March 2017 Forecast: key resistance level at 850.15 to be broken for the bullish trend to be continuing Weekly (W1) price is located above Ichimoku cloud in the
GBP/USD January-March 2017 Forecast: weekly ranging bearish; daily possible bullish reversal W1 price is located below Ichimoku cloud in the bearish area of the chart. The price is on ranging within narrow support/resistance levels since the
S&P 500 January-March 2017 Forecast: long-term bullish ranging within the narrow s/r levels for direction W1 price is located far above Ichimoku cloud in the bullish area of the chart. The price is on ranging within the following narrow
EUR/USD January-March 2017 Forecast: bearish ranging with 1.0324 key support level W1 price is located below Ichimoku cloud in the bearish area of the chart within the following support/resistance levels: 61.8% Fibo level at 1.1123 located near and
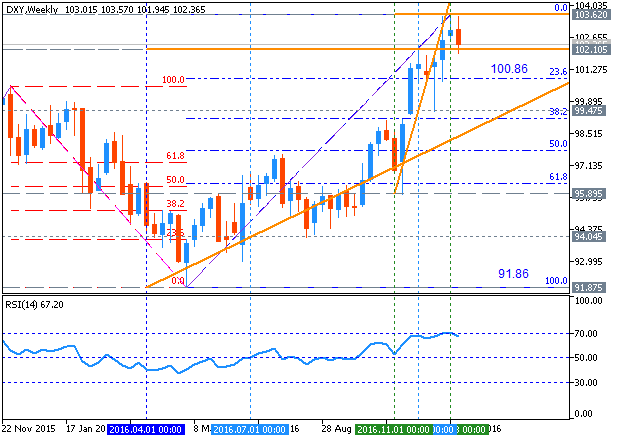
Key Levels To Watch In The U.S. Dollar (based on the article ) "The chart below shows the former trading range between 92 and 100 in the U.S. Dollar Index. The dollar's break to the upside creates a
Xудожник Филипп Кубарев Кубарев Филипп Вячеславович родился в 1969.г в Москве. В 1987г. окончил Московскую среднюю художественную школу при Московском государственном художественном институте им
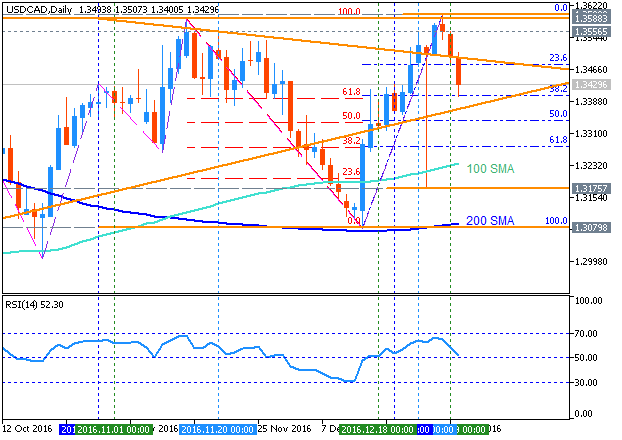
USD/CAD Technical Analysis: At Strong Support For 2017 (based on the article ) "The last week of 2016 trading has brought about USD weakness. As we come into the Macro Opening Range of 2017, traders
U.S. Bank Stocks Have Bubble Trouble (based on the article ) "Banks are back. Of all the post-election stock stories, “Buy banks!” is the most popular." JP Morgan Chase "The largest U.S. bank's stock