• 정보
6+ 년도
경험
32
제품
136
데몬 버전
0
작업
0
거래 신호
0
구독자
👑 이론물리학자, 프로그래머. 저는 15년 동안 시장에서 수학적 패턴을 찾는 데 중점을 두고 거래해 왔습니다.
---------------------------------------------------------------------------------------------------------------------
💰 제시된 제품
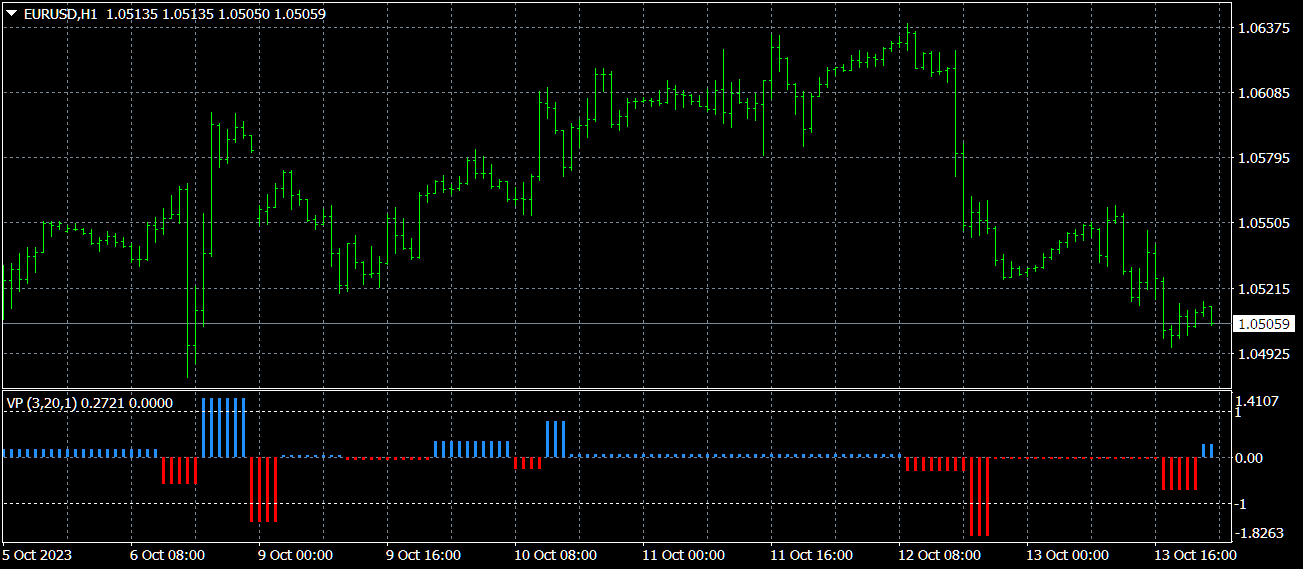
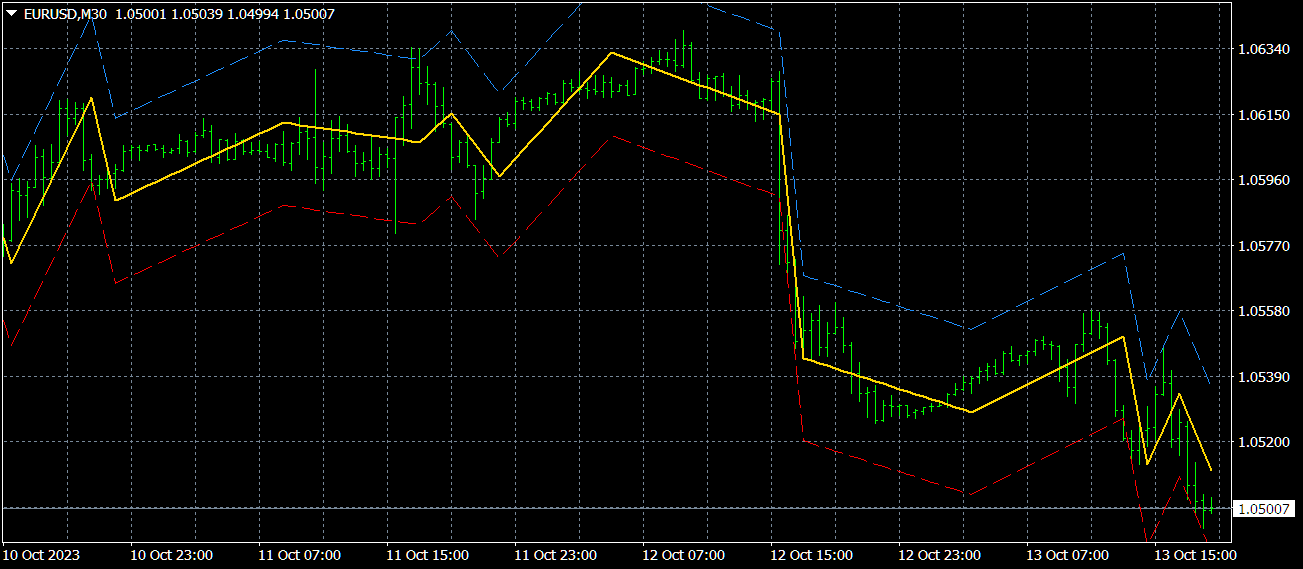
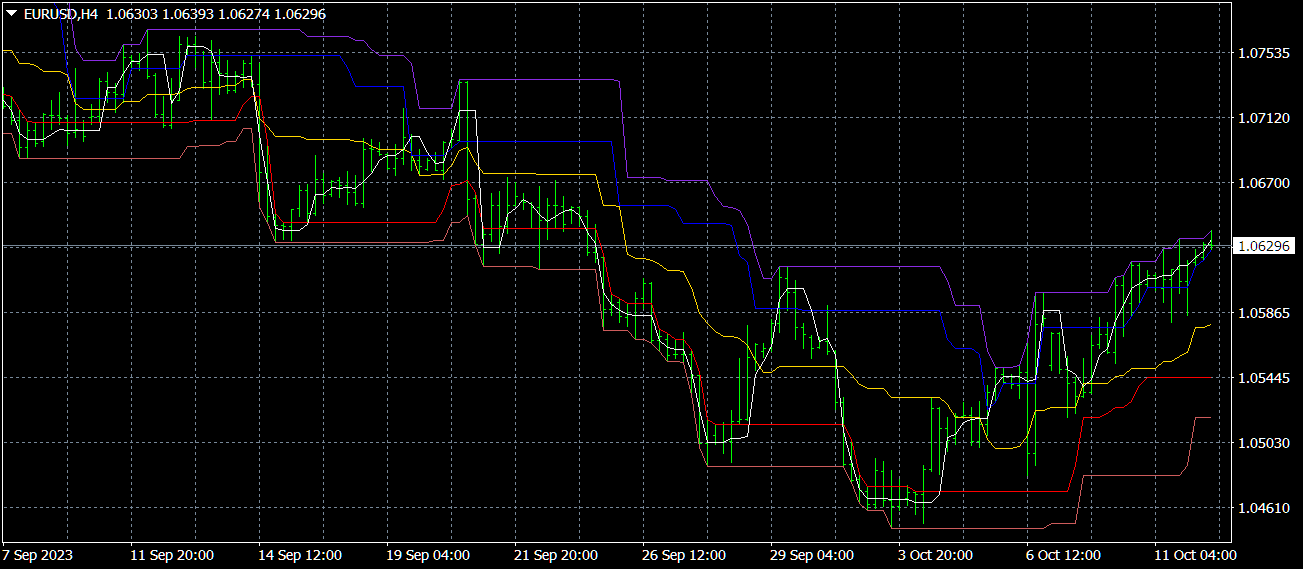
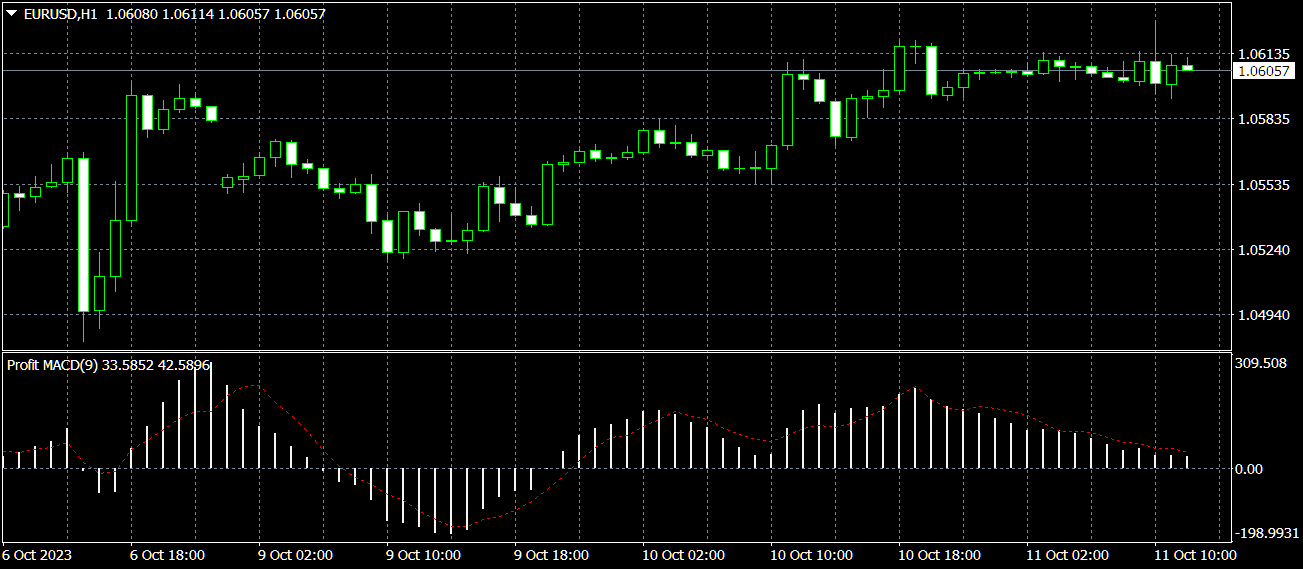
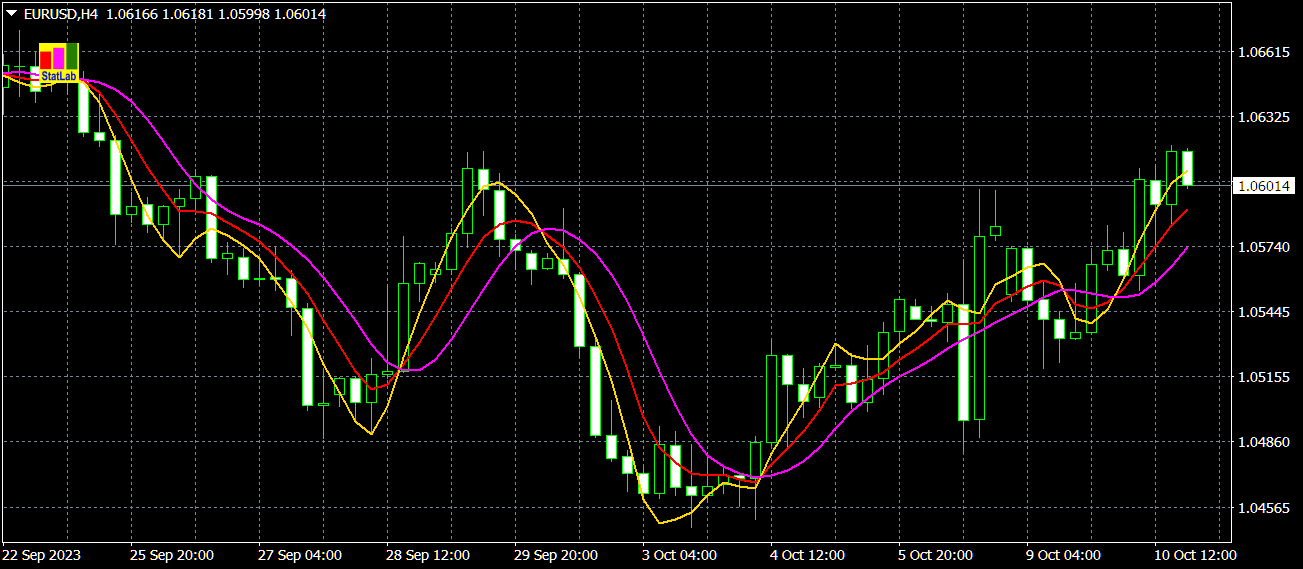
1) 🏆 시장 소음을 최적으로 필터링하는 표시기(오픈 및 클로징 위치 선택용).
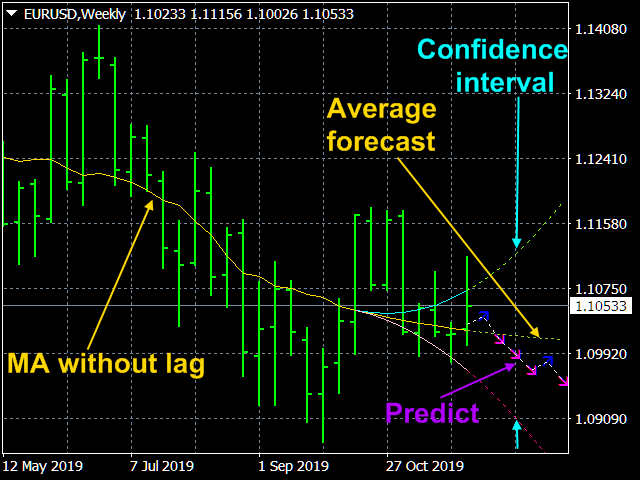
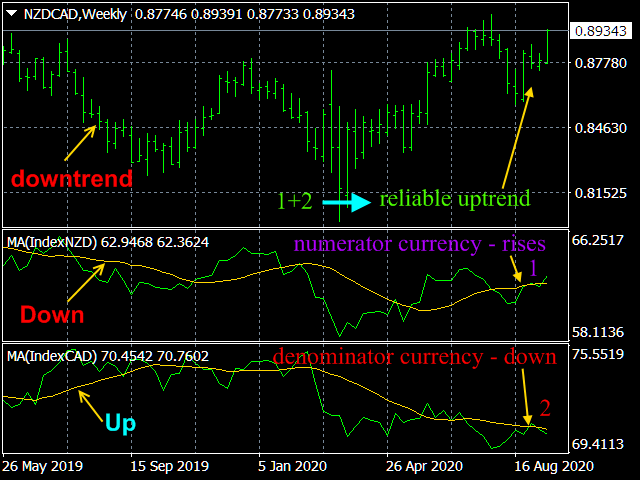
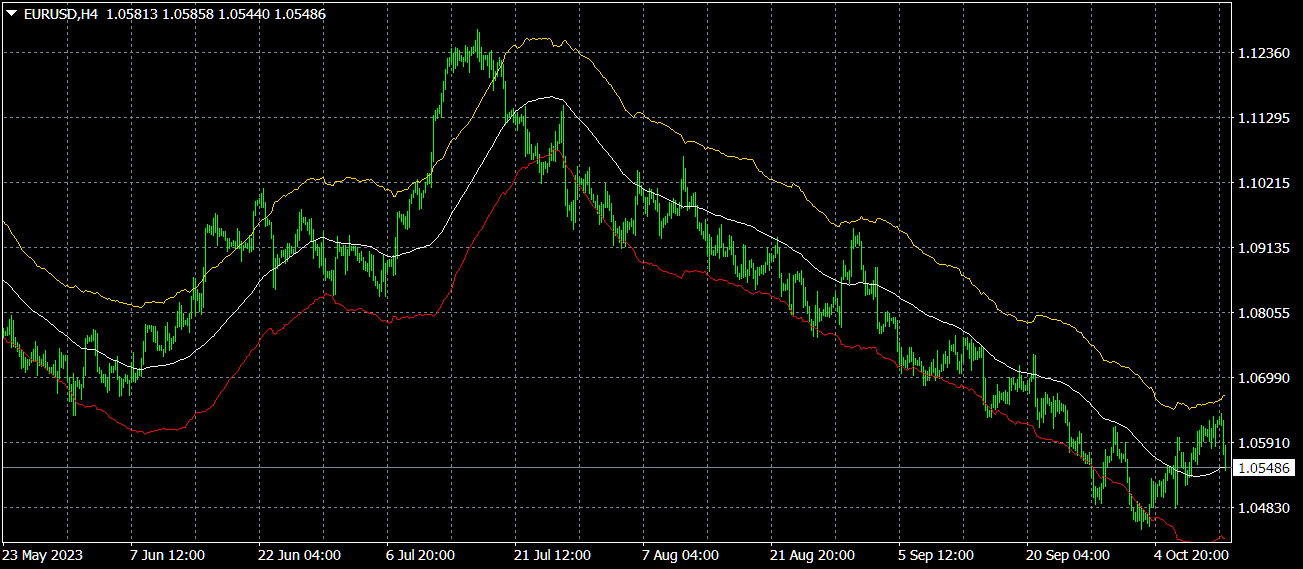
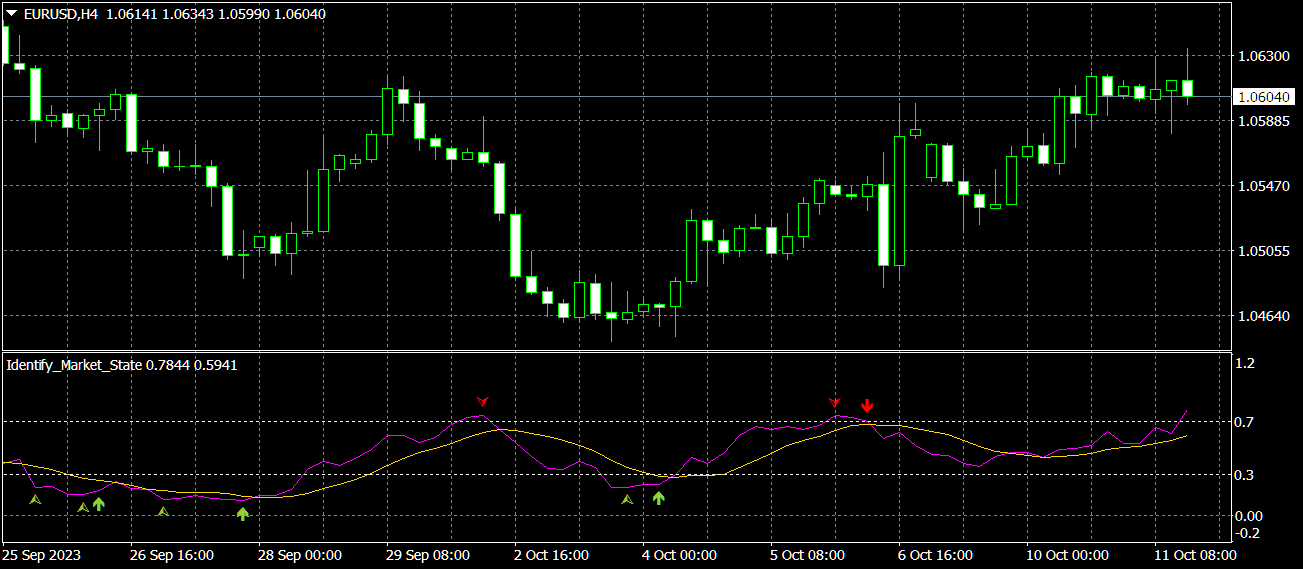
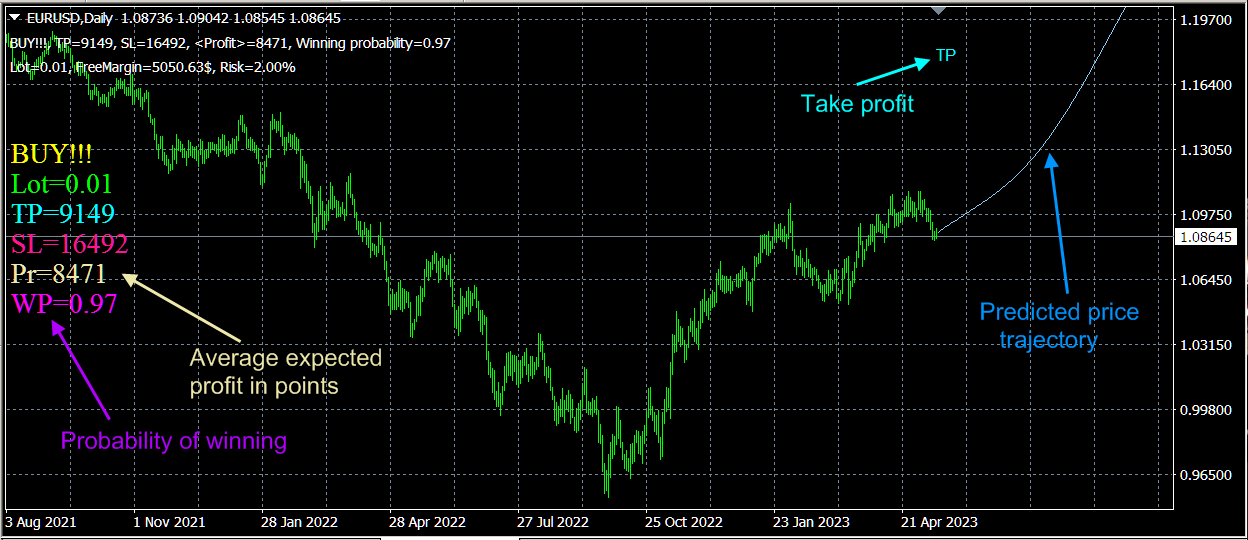
2) 🏆 통계 지표(글로벌 추세를 결정하기 위한).
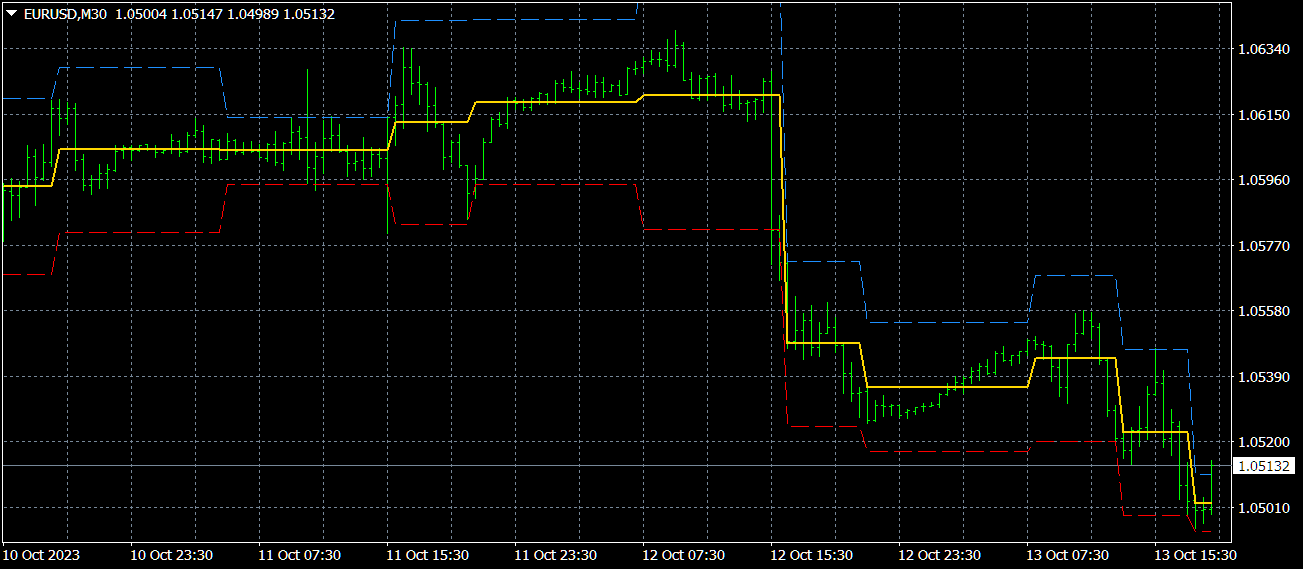
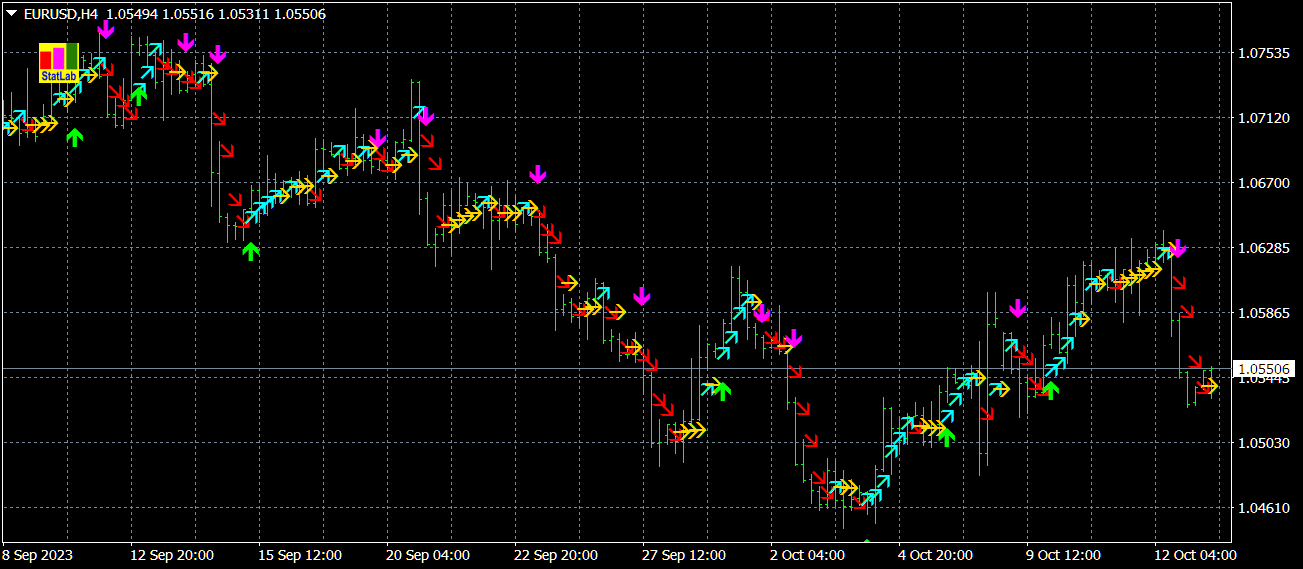
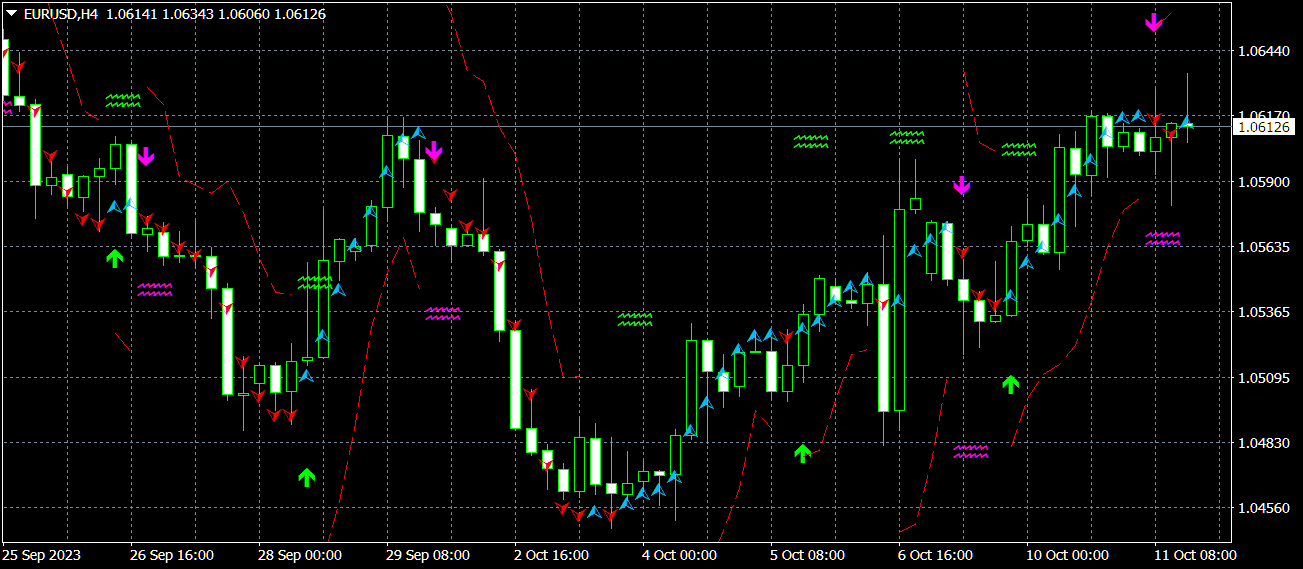
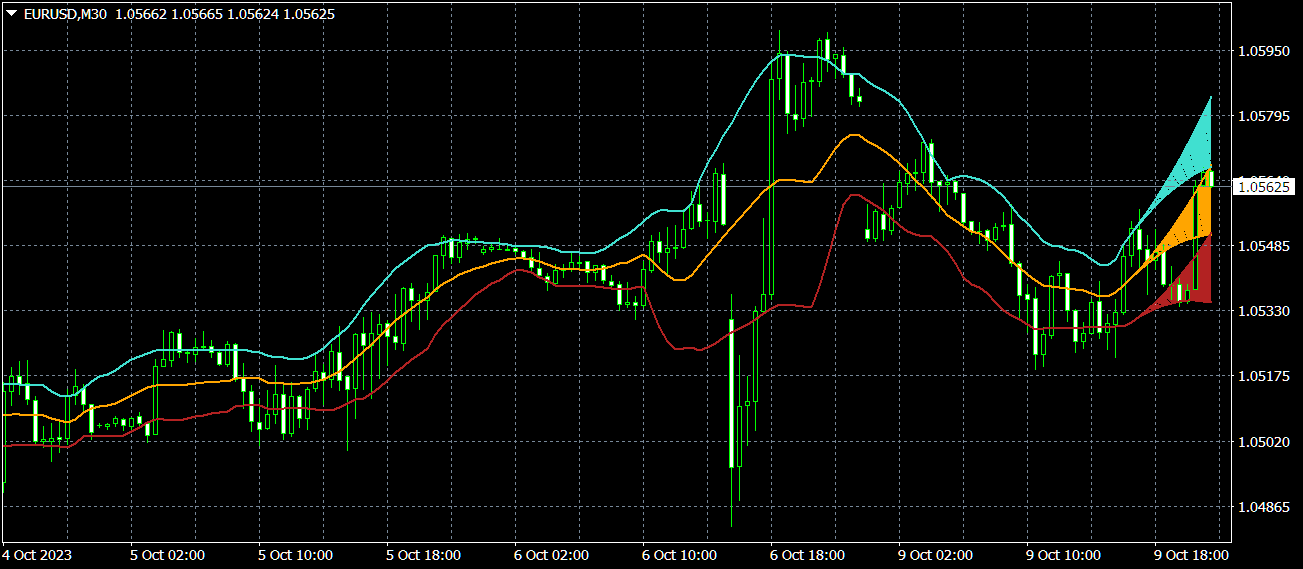
3) 🏆 시장 조사 지표(가격의 미세 구조를 명확히 하고, 채널을 구축하고, 추세 반전과 후퇴 간의 차이점을 식별하기 위해).
----------------------------------------------------------------------------------------------------------------------------------
☛ 더 많은 정보는 블로그에서 https://www.mql5.com/en/blogs/post/741637
공유 제품
리뷰: 4
FREE

Principles of construction of the indicator.               The Absolute Bands (AB) indicator is reminiscent of the Bollinger Bands indicator with its appearance and functions, but only more effective for trading due to the significantly smaller number of false signals issued to them. This effectiveness of the Absolute Bands indicator is due to its robust nature

Aleksey Ivanov
Aleksey Ivanov
Absolute Bands FREE https://www.mql5.com/en/market/product/33826
The Absolute Bands indicator is reminiscent of the Bollinger Bands indicator with its appearance and functions, but only more effective for trading due to the significantly smaller number of false signals issued to them. This effectiveness of the Absolute Bands indicator is due to its robust nature.
✔️ One of the best indicators with optimal market noise filtering.Absolute Bands FREE https://www.mql5.com/en/market/product/33826 
The Absolute Bands indicator is reminiscent of the Bollinger Bands indicator with its appearance and functions, but only more effective for trading due to the significantly smaller number of false signals issued to them. This effectiveness of the Absolute Bands indicator is due to its robust nature.
✔️ One of the best indicators with optimal market noise filtering.
1
공유 제품

49.00 USD

Introduction.             The indicator predicts the price in accordance with the prevailing trend  and its own small statistical price fluctuations around this trend. At the same time, in StatPredict , you need to set the time horizon of the forecasted events, which is set by the parameter settings of the “ Length of forecast in bars ” indicator and determined by the characteristic time scale of the current   trend, which is

Aleksey Ivanov
Aleksey Ivanov
StatPredict https://www.mql5.com/en/market/product/38721
✔️The indicator predicts the price in accordance with the prevailing trend and its own small statistical price fluctuations around this trend. Using mathematical methods for predicting random processes, StatPredict indicator predicts the most probable values of the future price and calculates the confidence interval for them.
✔️StatPredict also provides the option to calculate the lot, based on the positions of the last points of the calculated channel of confidence probability, as well as the size of the deposit and the allowable risk, which are specified in the indicator settings.
✔️The algorithms of this indicator are unique and developed by their authorStatPredict https://www.mql5.com/en/market/product/38721 
✔️The indicator predicts the price in accordance with the prevailing trend and its own small statistical price fluctuations around this trend. Using mathematical methods for predicting random processes, StatPredict indicator predicts the most probable values of the future price and calculates the confidence interval for them.
✔️StatPredict also provides the option to calculate the lot, based on the positions of the last points of the calculated channel of confidence probability, as well as the size of the deposit and the allowable risk, which are specified in the indicator settings. 
✔️The algorithms of this indicator are unique and developed by their author
1
공유 제품

The principle of the indicator.               A simple moving average (SMA) with an averaging period (2n + 1) of bars is always obtained lagging by n bars. If SMA or other types of moving averages are the basis for making trading decisions, then their strong delay does not allow   to open positions in time and close positions, which leads to losses.             

Aleksey Ivanov
Aleksey Ivanov
Estimation moving average without lag https://www.mql5.com/en/market/product/36945
A simple moving average (SMA) with an averaging period (2n + 1) of bars is always obtained lagging by n bars. If SMA or other types of moving averages are the basis for making trading decisions, then their strong delay does not allow to open positions in time and close positions, which leads to losses.
The Estimation moving average without lag indicator calculates an estimate of a non-lagging moving average and displays the corresponding confidence interval.
✔️The algorithms of this indicator are unique and developed by their author
Author Aleksey Ivanov https://www.mql5.com/en/users/60000382Estimation moving average without lag https://www.mql5.com/en/market/product/36945 
A simple moving average (SMA) with an averaging period (2n + 1) of bars is always obtained lagging by n bars. If SMA or other types of moving averages are the basis for making trading decisions, then their strong delay does not allow to open positions in time and close positions, which leads to losses.
The Estimation moving average without lag indicator calculates an estimate of a non-lagging moving average and displays the corresponding confidence interval.
✔️The algorithms of this indicator are unique and developed by their author
Author Aleksey Ivanov https://www.mql5.com/en/users/60000382
1
Aleksey Ivanov
Aleksey Ivanov
Friends, I am a theoretical physicist and a trader, mathematically rigorously studying market processes, aspects of which I have already begun to present in my articles. https://www.mql5.com/en/articles/10955
https://www.mql5.com/en/articles/11158
Based on a rigorous theory, I have developed indicators with optimal market noise filtering for trading. https://www.mql5.com/en/blogs/post/741637
However, it should be emphasized that a trader (investor) should choose the direction of his positions on the basis of fundamental analysis, and correctly applied indicators of optimal filtering of market noise should be only its auxiliary tool. These indicators are used to determine:

(1) market entry points are determined,
(2) the positions of stop-loss and profit and their order (time and number of points) of movement are determined,
(3) determine the size of the opened lots (calculated through money management built into the work of many indicators presented here).

I emphasize that for today's highly volatile market, these (1-3) statistically calculated parameters of the game are also (like fundamental analysis) key, in the sense that without them it will be generally impossible to get a stable profit.

Subscribe to my channel and you will be aware of my latest developments in the field of trading
https://www.mql5.com/en/channels/statlab
Aleksey Ivanov
Aleksey Ivanov
Friends! The foreign exchange market in our time is an absolute chaos. If you play on the foreign exchange market, then you should treat it exactly like a game, i.e. it is the same as playing in a casino. Don't expect this game to be your main source of income. These are false hopes. Therefore, play for extra money. In no case do not play with borrowed money from someone (banks, friends, etc.). This will lead to disaster.

There is a little more order in the stock market than in the foreign exchange market. Here you can rely on fundamental data on the economic condition (financial statements, etc.) of the companies that issue the respective shares. But here, in our time, when the global crisis is approaching, the data provided by even reputable experts can be unreliable. However, the indicators I provide are better applied to the stock market, which is more orderly.

Modern profitable indicators https://www.mql5.com/en/blogs/post/741637
Aleksey Ivanov
Aleksey Ivanov
Channel Builder FREE https://www.mql5.com/en/market/product/34818
The Channel Builder (CB) or Ivanov Bands indicator is a broad generalization of the Bollinger Bands indicator. First, in CB, the mean line is calculated using various averaging algorithms. Secondly, the mean deviations calculated by Kolmogorov averaging are plotted on both sides of the middle line .
✔️The algorithms of this indicator are unique and developed by their author
공유 제품
리뷰: 6
FREE

               The Channel Builder (CB) or Ivanov Bands indicator is a broad generalization of the Bollinger Bands indicator. First, in CB, the mean line <X> is calculated using various averaging algorithms. Secondly, the mean deviations calculated by Kolmogorov averaging are plotted on both sides of the middle line <X>.                The middle line

Aleksey Ivanov
Aleksey Ivanov
Alligator Analysis FREE https://www.mql5.com/en/market/product/35227
The “Alligator Analysis” (AA) indicator allows you to build various (by averaging types and by scales) “Alligators” and their combinations, i.e. allows you to analyze the state of the market based on the correlation of this state with a whole range of different "Alligators". The classic "Alligator" by Bill Williams is based on moving averages and Fibonacci numbers, which makes it one of the best indicators now. The classic "Alligator" is based on Fibonacci numbers and is a combination of three smoothed moving averages (SМMA) with periods 5, 8 and 13, which are part of the Fibonacci sequence. In this case, the moving averages are shifted forwards by 3, 5, and 8 bars, respectively, which are numbers from the same sequence (preceding the corresponding period values).
Alligators from the AA indicator is based, on the same principle as the classic “Alligator”, but on different parts of a number of Fibonacci numbers, as well as on different moving average averaging algorithms.
The indicator AA uses 6 types of averaging, where the classical averaging SMA, EMA, SMMA, LMA are supplemented by averaging the moving average by the median and averaging weighted by volume.
Line shifts can be removed. The colors of the AA indicator lines are set according to the type of color spectrum: from violet for a small smoothing period to red - for the largest period.
공유 제품
리뷰: 4
FREE

Indicator description.            The “ Alligator Analysis ” ( AA ) indicator allows you to build various (by averaging types and by scales) “ Alligators ” and their combinations, i.e. allows you to analyze the state of the market based on the correlation of this state with a whole range of different " Alligators ".  The classic " Alligator " by Bill Williams is based on moving averages and Fibonacci numbers, which makes it one of the best

Aleksey Ivanov
Aleksey Ivanov
Friends! The foreign exchange market in our time is an absolute chaos. If you play on the foreign exchange market, then you should treat it exactly like a game, i.e. it is the same as playing in a casino. Don't expect this game to be your main source of income. These are false hopes. Therefore, play for extra money. In no case do not play with borrowed money from someone (banks, friends, etc.). This will lead to disaster.

There is a little more order in the stock market than in the foreign exchange market. Here you can rely on fundamental data on the economic condition (financial statements, etc.) of the companies that issue the respective shares. But here, in our time, when the global crisis is approaching, the data provided by even reputable experts can be unreliable. However, the indicators I provide are better applied to the stock market, which is more orderly.
(Modern profitable indicators https://www.mql5.com/en/blogs/post/741637 )
Aleksey Ivanov
Aleksey Ivanov
Estimation moving average without lag https://www.mql5.com/en/market/product/36945
A simple moving average (SMA) with an averaging period (2n + 1) of bars is always obtained lagging by n bars. If SMA or other types of moving averages are the basis for making trading decisions, then their strong delay does not allow to open positions in time and close positions, which leads to losses.
The Estimation moving average without lag indicator calculates an estimate of a non-lagging moving average and displays the corresponding confidence interval.
✔️The algorithms of this indicator are unique and developed by their author
Author Aleksey Ivanov https://www.mql5.com/en/users/60000382
Aleksey Ivanov
Aleksey Ivanov
Iterative Moving Average https://www.mql5.com/en/market/product/31714
Iterative Moving Average – IMA. IMA is obtained by correcting the usual MA. The correction consists in addition to MA averaged difference between the time series (X) and its MA, i.e. IMA(X)=MA(X) + MA (Х-MA(X)). Correction is done in several iterations (and, exactly, 2 iterations in this indicator) and with a change in the averaging period.
As a result, the time-series points begin to cluster around (on all sides) of the getting IMA and with a smaller delay than around the usual MA. Therefore, IMA is a more effective tool for manual and automatic trading than all types of conventional MA (SMA, EMA, SSMA, LMA).
✔️The algorithms of this indicator are unique and developed by their author
공유 제품
리뷰: 2
30.00 USD

              Iterative Moving Average – IMA.   IMA is obtained by correcting the usual   MA.   The correction consists in addition   to MA averaged difference between the time series (X) and its MA, i.e.   IMA(X)=MA(X) + MA ( Х -MA(X)). Correction is done in several iterations (and, exactly, 2 iterations in this indicator) and with a change in the averaging period

Aleksey Ivanov
Aleksey Ivanov
Signal Bands https://www.mql5.com/en/market/product/29171
Signal Bands is a sensitive and convenient indicator, which performs deep statistical processing of information. It allows to see on one chart (1) the price trend, (2) the clear price channel and (3) latent signs of trend change. The indicator can be used on charts of any periods, but it is especially useful for scalping due to its high sensitivity to the current market state.
✔️The indicator has all types of alerts.
✔️The indicator does not redraw.
✔️The algorithms of this indicator are unique and developed by their author
Stefan Giehler
Stefan Giehler 2022.12.31
why not with arrow for buy and sell ?
Aleksey Ivanov
Aleksey Ivanov 2023.01.01
In the settings of this indicator, there is a function to display such arrows.
공유 제품

49.00 USD

Signal Bands is a sensitive and convenient indicator, which performs deep statistical processing of information. It allows to see on one chart (1) the price trend, (2) the clear price channel and (3) latent signs of trend change. The indicator can be used on charts of any periods, but it is especially useful for scalping due to its high sensitivity to the current market state. The functions of the indicator : First, the Signal Bands indicator draws channels into which all price fluctuations

Aleksey Ivanov
Aleksey Ivanov
Robust filter https://www.mql5.com/en/market/product/52668
The Robust filter indicator is based on the robust filtering algorithm developed by the author using the multi-period averaged moving median.
The indicator calculates and shows:
✔️1. The direction of the trend;
✔️2. Entry and exit points of positions;
✔️3. StopLoss lines calculated from current price probability distributions and selected probability of closing an order by StopLoss before the trend reversal;
✔️4. Lot sizes based on the accepted risk level, deposit size and StopLoss position.
============================================================
✔️The indicator has all kinds of alerts.
✔️The indicator does not redraw.
✔️The indicator can be used both for trading scalper strategies and for long-term trading strategies.
공유 제품
리뷰: 1
49.00 USD

            The Robust filter   indicator is based on the robust filtering algorithm developed by the author using the multi-period averaged moving median. The algorithm for this averaging is shown in the last screenshot.                The indicator calculates and shows: 1. The direction of the trend; 2. Entry and exit points of positions; 3. StopLoss   lines