Maxim Romanov
Maxim Romanov
3.7 (4)
  • 정보
10+ 년도
경험
6
제품
291
데몬 버전
3
작업
0
거래 신호
0
구독자
Quant Researcher Bidsbee
Трейдинг - основная работа. На рынке с 2008 года, занимаюсь исследованиями рынков FOREX, фондовых, сырьевых и криптовалютных. Изучаю закономерности, причины их появления и исчезновения. Развиваю собственную теорию ценообразования, описывающую и предсказывающую появление тех или иных закономерностей. Разрабатываю уникальные индикаторы, на основе исследований, строю сложные торговые алгоритмы и использую их для своей работы.
Maxim Romanov
추가된 주제 반전 확률 계산
수학을 이해하는 사람, 문제를 해결하는 데 도움을 주세요. 어떻게 해야 할지 모르겠습니다. 정규 분포에 대한 확률 밀도 그래프가 있고 정규 분포에 메모리가 없으며 각 다음 단계의 방향 확률 = 50%입니다. 10걸음을 걷는 사람이 있고 오른쪽이나 왼쪽으로 걸을 수 있고 각 다음 단계는 이전 단계에 의존하지 않고 오른쪽이나 왼쪽으로 갈 확률이 50%라고 가정합니다. 그런 다음 확률 밀도 테이블을 만들고 10단계로 시작점에서 멀어질 확률을 추정할
Maxim Romanov
추가된 주제 진동 진폭 측정
이제 나는 시장의 변동 이론을 개발하고 있습니다. 저는 2가지에 대해 생각했습니다. 1) 추세를 따르는 방법과 동시에 하락세를 마감하지 않고 추세를 따라 하락세에 더 많은 매수를 할 수도 있습니다. 2) 지표와 오셀레이터를 기반으로 하는 단순 거래 시스템이 최적화(최적화된 Expert Advisor가 항상 수익성 있게 거래하는 것을 방지)를 통해서만 짧은 기간 동안만 수익성이 있는 이유. 반성을 통해 시장 상황에 따라 지표의 기간을 조정해야
Maxim Romanov
추가된 주제 안정적인 거래 로봇 개발
나는 수익 안정성과 드물게 손실되는 거래를 결합할 안정적인 거래 시스템을 개발하고 있습니다. 이 시스템은 반전 마틴게일을 기반으로 합니다. 나는 고전적인 마틴게일의 모든 가능성의 부족을 이해한다는 것을 즉시 유보하겠습니다. 그러나 이 시스템에서는 손실 거래의 수를 최소한으로 줄이기 위해 정확히 약간 다른 형태로 사용됩니다. 현재 이 문제에 대해 어느 정도 성공했지만 이제는 새로운 아이디어와 접근 방식이 필요합니다. 사실, 저는 여러 방향에서
Maxim Romanov
추가된 주제 프랙탈 이론
시장은 프랙탈 구조라는 의견이 있습니다. 세상의 모든 것은 우리의 두뇌를 포함하여 궁극적으로 시장을 생성하는 프랙탈 구조이기 때문에 그 의견은 상당히 정당합니다. 프랙탈은 자기 유사체입니다. 즉, 프랙탈은 특정 패턴으로 여러 번 반복되는 일부 조각으로 구성됩니다. 사람의 얼굴까지 프랙탈로 무엇이든 그릴 수 있는 공식이 있습니다. 그림을 생성하는 공식이 있기 때문에 그림을 공식으로 다시 복원할 수 있지만 어떻게 해야 할까요? 시장이 프랙탈이면
Maxim Romanov
Добавить новый режим расчета блоков в индикаторы max_block 작업에 대한 피드백을 개발자에 남김
Maxim Romanov
The latest version of the robot 50% with the block indicator 작업에 대한 피드백을 고객에게 남김
Maxim Romanov
Purchase fully of ea 작업에 대한 피드백을 고객에게 남김
Maxim Romanov
게재된 기고글 Self-adapting algorithm (Part IV): Additional functionality and tests
Self-adapting algorithm (Part IV): Additional functionality and tests

I continue filling the algorithm with the minimum necessary functionality and testing the results. The profitability is quite low but the articles demonstrate the model of the fully automated profitable trading on completely different instruments traded on fundamentally different markets.

8
ron33
ron33 2021.06.18
I read all your self-adaptation articles are great but in chapter three I did not find the 50% V3 robot, I found the block indicators but in EA code it is not anywhere in the compressible . Although this is an excellent guide on how it works. Does the robot code exist?
Maxim Romanov
Maxim Romanov 2021.06.18
The code exists, but it is not distributed free of charge. If there is a strong desire, then I consider proposals
ron33
ron33 2021.06.18
Thank you, I'll think about it
Maxim Romanov
게재된 기고글 Self-adapting algorithm (Part III): Abandoning optimization
Self-adapting algorithm (Part III): Abandoning optimization

It is impossible to get a truly stable algorithm if we use optimization based on historical data to select parameters. A stable algorithm should be aware of what parameters are needed when working on any trading instrument at any time. It should not forecast or guess, it should know for sure.

9
Maxim Romanov
게재된 기고글 Developing a self-adapting algorithm (Part II): Improving efficiency
Developing a self-adapting algorithm (Part II): Improving efficiency

In this article, I will continue the development of the topic by improving the flexibility of the previously created algorithm. The algorithm became more stable with an increase in the number of candles in the analysis window or with an increase in the threshold percentage of the overweight of falling or growing candles. I had to make a compromise and set a larger sample size for analysis or a larger percentage of the prevailing candle excess.

11
Maxim Romanov
게재된 기고글 Developing a self-adapting algorithm (Part I): Finding a basic pattern
Developing a self-adapting algorithm (Part I): Finding a basic pattern

In the upcoming series of articles, I will demonstrate the development of self-adapting algorithms considering most market factors, as well as show how to systematize these situations, describe them in logic and take them into account in your trading activity. I will start with a very simple algorithm that will gradually acquire theory and evolve into a very complex project.

12
Maxim Romanov
게재된 기고글 A scientific approach to the development of trading algorithms
A scientific approach to the development of trading algorithms

The article considers the methodology for developing trading algorithms, in which a consistent scientific approach is used to analyze possible price patterns and to build trading algorithms based on these patterns. Development ideals are demonstrated using examples.

7
Maxim Romanov
Покупка готового индикатора у автора 작업에 대한 피드백을 고객에게 남김
Maxim Romanov
게재된 기고글 What is a trend and is the market structure based on trend or flat?
What is a trend and is the market structure based on trend or flat?

Traders often talk about trends and flats but very few of them really understand what a trend/flat really is and even fewer are able to clearly explain these concepts. Discussing these basic terms is often beset by a solid set of prejudices and misconceptions. However, if we want to make profit, we need to understand the mathematical and logical meaning of these concepts. In this article, I will take a closer look at the essence of trend and flat, as well as try to define whether the market structure is based on trend, flat or something else. I will also consider the most optimal strategies for making profit on trend and flat markets.

6
Maxim Romanov
게재된 기고글 Price series discretization, random component and noise
Price series discretization, random component and noise

We usually analyze the market using candlesticks or bars that slice the price series into regular intervals. Doesn't such discretization method distort the real structure of market movements? Discretization of an audio signal at regular intervals is an acceptable solution because an audio signal is a function that changes over time. The signal itself is an amplitude which depends on time. This signal property is fundamental.

3
Maxim Romanov
Maxim Romanov
Само адаптирующийся алгоритм совершенствуется. Тест за 2,5 года по 28 инструментам проходит без проблем. Параметры торговли для каждого инструмента корректируются в реальном времени без оптимизации!
Aleksey Vyazmikin
Aleksey Vyazmikin 2018.11.15
Много ли параметров автоматически корректируется без оптимизации?
Maxim Romanov
Maxim Romanov 2018.11.16
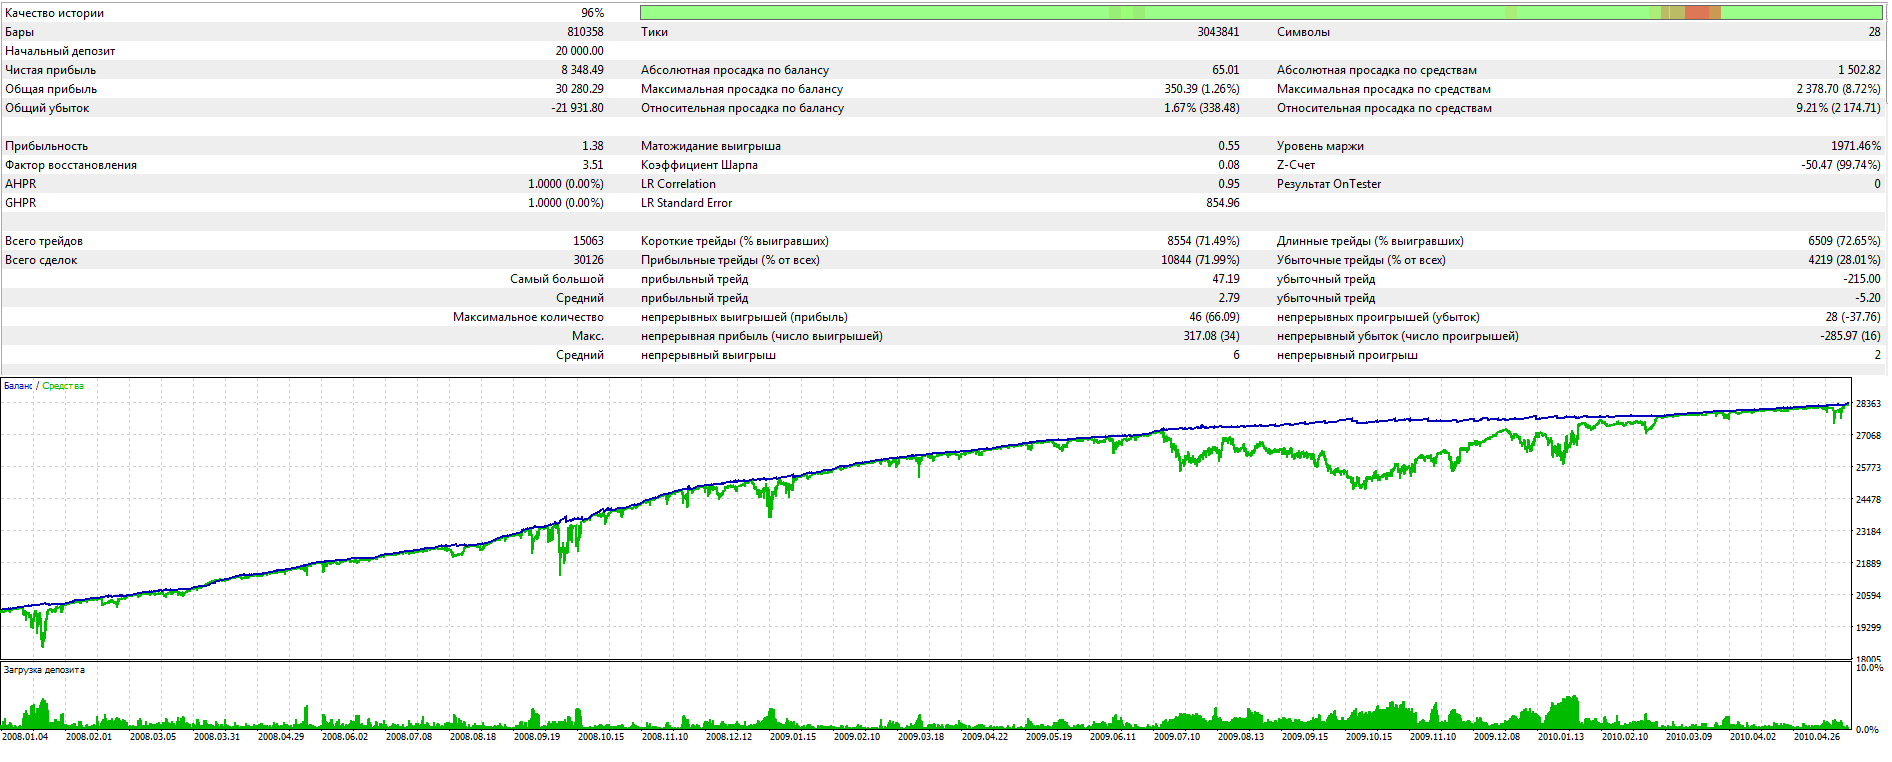
Aleksey Vyazmikin не оптимизируется вообще ничего. В роботе есть параметры, отвечающие за работу самого алгоритма, их очень много, чуть больше 2000. Но устанавливаются они вручную без оптимизации. Да и оптимизация просто невозможна с такой скорость работы (2 месяц теста проходят за сутки). Дальше на каждом инструменте, автоматически определяется тайм фрейм для торговли и период для анализа тоже автоматически, эти параметры корректируются по мере движения цены. Если открыта позиция, то определяется точка профита и лосса автоматически и корректируется от текущего состояния рынка. У торговой стратегии нет как таковых настроек, у нее есть закономерность, которую она должна отрабатывать, а все параметры торговли корректируются под эту закономерность в реальном времени.
Maxim Romanov
Maxim Romanov
Самоадаптирующийся алгоритм становится лучше с каждой модификацией. Тест по 1 инструменту за год. Прибыль уже соразмерна просадке.
Maxim Romanov
Сложный мультивалютный советник для МТ5 작업에 대한 피드백을 개발자에 남김
Maxim Romanov
Maxim Romanov
Чем отличаются случайные дынные от рыночных? На эту тему проведено множество исследований, но четкого ответа никто толком не дает. Я визуализировал отличие рыночных данных от случайных. На картинках распределение приращений рыночных данных и случайных, теперь не сложно на глаз отличить где рынок, а где ГСЧ.
Maxim Romanov
Maxim Romanov 2020.08.02
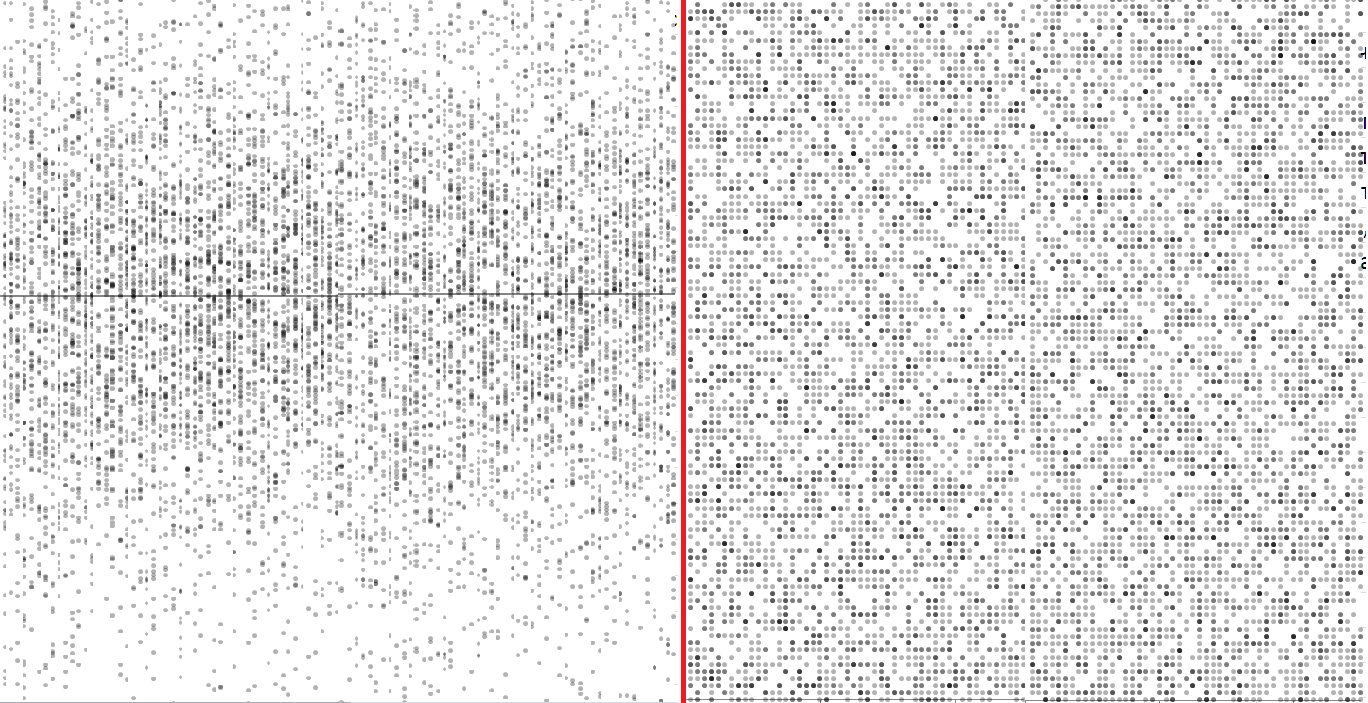
Это был размер свечей. По оси Y размер свечей в пунктах от -n до n. Одна точка это одна свеча. График состоит из столбцов, набранных по К точек. Например в одном столбце делаем 1000 измерений размера свечей и ставим полупрозрачные точки. Как только 1000 измерений сделано, переходим к следующему столбцу. и так заполняем все пространство. Тут есть одна особенность. Я делал это достаточно давно и не учел один нюанс: Справа рисунок построен для равномерного распределения, а слева для рынка. Но рынок ближе к нормальному распределению, из-за особенностей формирования цен! Поэтому правильнее было бы сравнивать рыночные данные с ГСЧ, формирующим нормальное распределение.
Enrique Enguix
Enrique Enguix 2020.11.20
I think you are a genius, although many times I don't understand what you're talking about. Every time I read something of yours, I have to think about your words for hours. You are a humility cure for many of the people who are in this market
Dzmitry Maksimov
Dzmitry Maksimov 2021.12.16
Потому,что на графике образуются "контрольные точки" вероятность их закрытия 95% (но по логике 99)и только время определяет , когда эти точки будут закрыты.Скопление точек ближе к середине это и есть точки с наименьшем временем, ближе к краям те самые 5%.Я больше,чем уверен,если каждый пипс пронумеровать и сделать следующий тест вперёд-то При сравнении те самые 5% окажутся ближе к середине,а по краям будут только новые пипсы с другими цифрами.
Maxim Romanov
Отправка данных на сайт 작업에 대한 피드백을 개발자에 남김
123