Signal M5

trading is not a game. trading is business. and the main thing to consider in business is to limit losses.
Stop Loss is the lowest price limit set to limit losses. When price movements touch this value, the system will automatically close the order or position.

For most traders, the decision to put this stop loss is an uncomfortable choice. Why? because that means they have received the loss. However, every trader has the right to decide for himself which trading model is the most suitable for him, whether by using a stop loss or ignoring it, it returns to the trading strategy used by each trader.

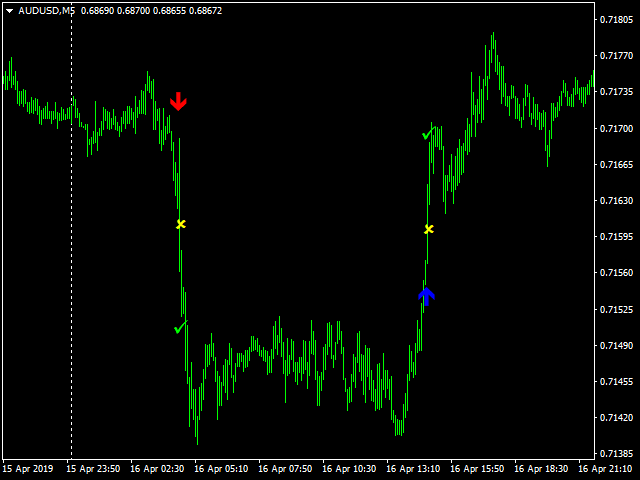
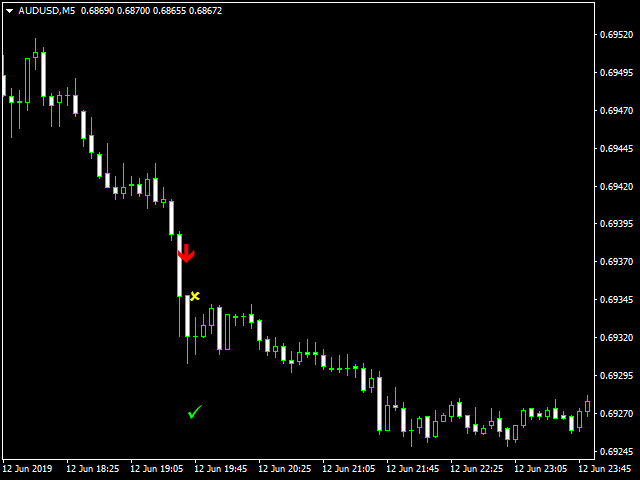
this indicator is equipped with TP SL, so the user knows when he has to enter the market and exit.

please place this indicator on M5 or M1 time frame
추천 제품
Limitless MT4
Dmitriy Kashevich
Limitless MT4 is a universal indicator suitable for every beginner and experienced trader. works on all currency pairs, cryptocurrencies, raw stocks Limitless MT4 - already configured and does not require additional configuration And now the main thing Why Limitless MT4? 1 complete lack of redrawing 2 two years of testing by the best specialists in trading 3 the accuracy of correct signals exceeds 80% 4 performed well in trading during news releases Trading rules 1 buy signal - the ap
This indicator works on MT4 and is very easy to use. When you receive a signal from it, you wait for that candle with the signal to close and you enter your trade at the beginning of the next new candle . A red arrow means sell and a green arrow means buy. All arrows comes with Alert  like for easy identification of trade signal. Are you okay with that? 1 minute candle 1 minute expire
EARLY REMINDER: The Starting price is 65 price will rise soon up to 365$ and then 750$ after first 10 copies of sales. Grab this offer now! Introduction Hello, traders! Welcome to the demonstration of the Forex Beast Indicator , a comprehensive tool designed to assist aspiring traders in navigating the complexities of the forex market. This indicator incorporates seven essential components to provide a well-rounded trading experience: Moving Averages Colored Zones Support and Resistance Levels
Boba Binary
Anthonius Soruh
5 (1)
Result look on  https://t.me/BonosuProBinary Pair : All Forex Pairs Time Frame : M1 Expaired : 1-2 Minutes Trade Time Once Time a Day Backtester, Alert Avaliable Average Signals Generate 5 - 20 Signals All Pair A Day Broker Time Zone GMT+3 Default Setting [Example Broker GMT+3 : Alpari, FBS, XM] Support Broker : Deriv, IQOption, Alpari, Binomo, Olymtrade, Qoutex, GCoption, etc Support Auto Trading : MT2 Trading, Binary Bot, Intrade Bot, Binomo Bot, Olymptrad Bot, MX2 trading, Price Pro, etc Ind
Cota Binary
Anthonius Soruh
5 (2)
Result look on  https://t.me/BonosuProBinary Pair : All Forex Pairs Time Frame : M1 Expaired : 1-2 Minutes Trade Time Once Time a Day Backtester, Alert Avaliable Average Signals Generate 5 - 20 Signals All Pair A Day Broker Time Zone GMT+3 Default Setting [Example Broker GMT+3 : Alpari, FBS, XM] Support Broker : Deriv, IQOption, Alpari, Binomo, Olymtrade, Qoutex, GCoption, etc Support Auto Trading : MT2 Trading, Binary Bot, Intrade Bot, Binomo Bot, Olymptrad Bot, MX2 trading, Price Pro, etc Ind
Binary Option Signal
Yaroslav Varankin
Indicator for binary options arrow is easy to use and does not require configuration works on all currency pairs, cryptocurrencies buy signal blue up arrow sell signal red down arrow tips do not trade during news and 15-30 minutes before their release, as the market is too volatile and there is a lot of noise it is worth entering trades one or two candles from the current period (recommended for 1 candle) timeframe up to m 15 recommended money management fixed lot or fixed percentage of the depo
Hrumer Alpha
Andrey Kozak
Hrumer Alpha - a fundamentally new forex indicator, which is built on the algorithm of tracking the peak values ​​of the price. This is not ZigZag and not Fraclals and despite the visual similarity, does not have anything to do with these indicators. It does not redraw its values ​​and works from the zero bar, that is, with Open [0]. He quickly reacts to any changes in the price and informs the trader about the reversals. Works on all currency pairs and timeframes. You can use for long trading,
"다이나믹 스캘핑 오실레이터"는 MT4를 위한 고급 맞춤형 암호화폐/외환 지표이자 효율적인 트레이딩 도구입니다! - 차세대 오실레이터 - 사용 방법은 그림을 참조하세요. - 다이나믹 스캘핑 오실레이터는 적응형 과매도/과매수 영역을 제공합니다. - 오실레이터는 동적인 과매도/과매수 영역에서 정확한 진입 시점을 찾는 보조 도구입니다. - 과매도 값: 녹색선 아래, 과매수 값: 주황색선 위. - 이 지표는 가격 변동 패턴과도 결합하기 좋습니다. - 일반 오실레이터보다 훨씬 정확합니다. 적합한 시간대: M30, H1, H4, D1, W1. - PC 및 모바일 알림 기능 제공. .......................................................................... 여기를 클릭하여 고품질 트레이딩 로봇과 지표를 확인하세요! MQL5 웹사이트에서만 제공되는 오리지널 제품입니다.
PZ Mean Reversion MT4
PZ TRADING SLU
3 (4)
평균 회귀 거래에 대한 전문적이고 정량적인 접근 방식을 구현하는 고유한 지표입니다. 이는 가격이 예측 가능하고 측정 가능한 방식으로 평균으로 전환되고 반환된다는 사실을 이용하여 비정량적 거래 전략을 훨씬 능가하는 명확한 진입 및 퇴장 규칙을 허용합니다. [ Installation Guide | Update Guide | Troubleshooting | FAQ | All Products ] 명확한 거래 신호 놀랍도록 쉬운 거래 사용자 정의 가능한 색상 및 크기 성능 통계 구현 대부분의 거래 전략을 능가합니다. 적절한 SL 및 TP 레벨을 표시합니다. 이메일/음향/시각 알림을 구현합니다. 작동 원리 이 지표는 더 높은 기간에서 완전히 사용자 정의 가능한 이동 평균 주변의 표준 편차를 측정하고 추세 추종 접근 방식을 사용하여 정확하게 거래를 찾습니다. 거래는 현재 차트의 가격 동작을 살펴보고 선택한 더 높은 기간에서 계산된 평균 가격대로 가격이 돌아오면 닫힙니다. 코딩 방식 때문에 지
Al in one level
Kundan Kumar Srivastava
5 (1)
This indicator is collection of important dynamic support and resistance giving a trader crystal clear idea , where to sell and where to buy. it completely complements trend lines, support, resistance, and sideways market and allow a trader to make sustainable profits. The thickness of lines suggests its strengths, the thicker the dynamic line, the stronger is rejection or pullback allowing a trader to make multi-fold profit, as they can clearly see them. Introducing Your Ultimate Trading Edge:
Precision Buy Sell Arrows
Muhammad Shariyar Bukhari
Product Description: Buy Sell Arrow Indicator for MT4 Elevate your trading to new heights with the Buy Sell Arrow Indicator for MT4 , a cutting-edge tool crafted to pinpoint high-probability trading opportunities based on advanced candlestick patterns. Tailored for forex traders, especially those targeting GOLD on the 5-minute chart, this MT4 indicator delivers exceptional accuracy with an impressive 85% win rate , empowering you to seize profitable trades with unwavering confidence. Key Fea
Impulse fractals indicator - is counter-trend oriented complex market fractal pattern.  Market creates bull/bear impulse, trend starts, fractals on impulsed wave are an agressive pullback signals. Buy arrow is plotted when market is bearish and it's impulse showed up-side fractal, and sell arrow is plotted when market is bullish and it's impulse showed dn-side fractal. Main indicator's adjustable inputs : impulsePeriod - main period of impulse histogram  filterPeriod  - smoothes impulse accordi
Happy Kangaroo
Pui Yan Leung
Overview Happy Kangaroo is a trend-following tool designed to identify market direction and provide high-probability entry signals based on volatility. By combining price action with the Average True Range (ATR), it visualize a dynamic support and resistance level of the price.     Key Features   The indicator's power lies in its customizable parameters and mathematical precision:  Dynamic Trend Detection: Uses the ATR period and factor to calculate the volatility bands. It identifies an Uptrend
SMC Venom Model BPR 지표는 Smart Money(SMC) 개념 내에서 일하는 트레이더를 위한 전문 도구입니다. 가격 차트에서 두 가지 주요 패턴을 자동으로 식별합니다. FVG (공정 가치 갭)는 3개의 캔들의 조합으로, 첫 번째와 세 번째 캔들 사이에 갭이 있습니다. 이는 볼륨 지원이 없는 레벨 사이에 구역을 형성하여 종종 가격 수정으로 이어집니다. BPR (균형 가격 범위)은 두 개의 FVG 패턴의 조합으로, "브리지"를 형성합니다. 이는 가격이 낮은 볼륨 활동으로 움직일 때 브레이크아웃과 레벨로의 복귀 구역으로, 캔들 사이에 갭을 생성합니다. 이러한 패턴은 거래자가 차트에서 거래량과 가격 역학을 분석하여 주요 지지/저항 수준, 돌파 구역 및 진입 지점을 식별하는 데 도움이 되며, 여기서 대형 시장 참여자와 일반 참여자 간의 상호 작용이 발생합니다. 이 지표는 사각형과 화살표 형태로 패턴을 시각화하며 유연한 경고 설정도 지원합니다. 주요 특징: 패턴 표시 모드:
The Binary Profit Maker,  This indicator works on MT4 and is very easy to use. When you receive a signal from it, you wait for that candle with the signal to close and you enter your trade at the beginning of the next new candle . A Up Purple arrow means Buy and a Down Purple arrow means Sell. All arrows comes with Alert  like for easy identification of trade signal. Are you okay with that? How To Enter Trade? 1 minute candle 1 minute expire
이 지표는 실제 거래에 완벽한 자동 파동 분석 지표입니다! 사례... 참고:   웨이브 그레이딩에 서양식 이름을 사용하는 데 익숙하지 않습니다. Tang Lun(Tang Zhong Shuo Zen)의 명명 규칙의 영향으로 기본 웨이브를   펜   으로 명명하고 2차 웨이브 밴드를   세그먼트   로 명명했습니다. 동시에, 세그먼트에는 추세 방향이 있습니다.   주요 추세 세그먼트에는   이름이 지정되지만(이 이름 지정 방법은 향후 노트에서 사용됩니다. 먼저 말씀드리겠습니다.) 알고리즘은 굴곡 이론과 거의 관련이 없으므로 그렇게 해서는 안 됩니다. 이는 나의 시장 분석을   통해 요약된 끊임없이 변화하고 복잡한 운영 규칙을   반영합니다. 밴드는 더 이상 사람마다 다르지 않도록 표준화되고 정의되었습니다. 인위적인 간섭의 드로잉 방법은 시장 진입을 엄격하게 분석하는 데 핵심적인 역할을 합니다. 이 지표를 사용하는 것은 거래 인터페이스의 미학을 개선하고 원래의 K-line 거래를
TRADING STRATEGY GUIDE DELIVERY The full Trading Strategy Guide will be sent directly to you after purchase. Just message me on MQL5 and ask for it — you'll receive it instantly, along with priority support and setup help. Powered Market Scanner for Smart Trading Decisions Keypad Support & Resistance is a next-generation MT4 trading system built for serious traders who demand precision, reliability, and clarity. It combines advanced smart filters with real-time price structure logic to genera
Deep Analyst Expert Advisor    (mt5  https://www.mql5.com/en/market/product/163998 ) Deep Analyst   is a professional analytical tool powered by a specialized algorithm designed for deep analysis of market cycles and price amplitude fluctuations. By analyzing market conditions over a specific timeframe, the Expert Advisor determines price strength and amplitude using a unique indicator system based exclusively on real-time data. When the global trend and its vector shift, the algorithm automati
This Indicator is use the ZigZag to calculate the Upper and  Lower Bound and the uptrend and the downtrned. Red for downtrend, Green for uptrend and Yellow is for the horizontal trend this horizontal trend also bookmarked the upper limited and the lower limited the the price swings.  Or in simple the Support and the Resistance level. However, You may use the Heikin Ashi to confirm the trend of the buy sell signal above. I cannot guarantee the win rate, Nevertheless, you must study well the timef
Altopium Trend
Antony Famulari
Altopium Trend is an indicator that identifies short-term trends. The signals it generates can be used to open long or short positions or can be integrated with other indicators/strategies. This is a trend indicator, be careful during narrow sideways phases. I recommend using it as a short-term trend indicator, complemented by other indicators that show the best times to enter the market. Wait for the bar to close to confirm the signal.
FREE
Gold Titan King Scalper
Dodong Christian Arnon
Indicator Description GOLD TITAN KING SIGNAL INDICATOR High-Precision Gold Scalping Buy/Sell Signals – Manual Trading Assistant Overview The Gold Titan King Signal Indicator is a manual trading assistant tool designed for high-frequency scalping on Gold (XAUUSD) and other major pairs. It generates clear BUY/SELL signals with precise entry levels, along with adjustable Stop Loss and Take Profit levels displayed directly on the chart. ️ This tool is NOT an EA. It does not execute trades
Gold Crazy EA MT4
Nguyen Nghiem Duy
Gold Crazy EA   is an Expert Advisor designed specifically for trading Gold H1/ EU M15. It use some indicators to find the good Entry. And you can set SL or you can DCA if you want. It can be an Scalping or an Grid/ Martingale depend yours setting. This EA can Auto lot by Balance, set risk per trade. You also can set TP/ SL for earch trade or for basket of trade. - RSI_PERIOD - if = -1, then the default strategy works, if >0, then the RSI strategy works - MAX_ORDERS - to trade with only 1 order,
Lineverse Trendlines
Arkady Segal
5 (1)
Automatic, live & interactive picture of all trendlines. Assign push, email and sound alerts to the lines of your choice and be informed about price rollback, breakout, rollback after breakout, number of rollbacks, line expiration by double breakout. Correct, drag or delete the lines and interactively tune the line system. https://youtu.be/EJUo9pYiHFA . Chart examples https: //www.mql5.com/en/users/efficientforex Price Interaction Events All events are effective immediately and only after one
The indicator allows you to trade binary options. The recommended time frame is М1 and the expiration time is 1,2,3 minutes. The indicator suitable for auto and manual trading. A possible signal is specified as a arrows above/under a candle. You should wait until the candle closes! Arrows are not re-painted Trade sessions: TOKYO section (Half-end) Currency pairs: USD/JPY Working time frame: M1 Expiration time: 1,2,3 minutes. The indicator also shows good results when using the martingale strateg
FREE
Hammer Shooting Star v1.1 – Advanced Candlestick Pattern Scanner Author: LIANG1990 Are you searching for a reliable tool to identify market reversals with precision? Hammer Shooting Star v1.1  is a professional MT4 indicator designed to scan and detect high-quality Hammer and Shooting Star candlestick formations. Unlike basic pattern indicators, this tool applies multiple built-in filters (shape, size, trend alignment, and contextual conditions) to reduce false signals and highlight only the cle
The new update makes this indicator a complete tool for studying, analyzing and operating probabilistic patterns. It includes: On-chart Multi-asset percentage monitor. Configurable martingales. Twenty-one pre-configured patterns , including Mhi patterns and C3. An advanced pattern editor to store up to 5 custom patterns. Backtest mode to test results with loss reports. Trend filter. Hit operational filter. Martingale Cycles option. Various types of strategies and alerts. Confluence between patte
ManualTradingTrend
Mukhriddin Ibragimov
Трендовый индикатор МТ4, дающий точные сигналы для входа в сделки. Работает без перерисовки и запаздываний! Только покупателем данного индикатора прилагается основной фильтр,обращайтесь в личку.   Идеальные точки входа в сделки для     валют, крипты, металлов, акций, индексов . Наилучшие результаты на таймфрейме M30 и выше! Наш канал в Telegram  |   Версия индикатора для MT5 Скоро   видео  for indicator Большинство трейдеров улучшают торговые результаты в первую неделю торговли с инд
Introduction to Fractal Pattern Scanner Fractal Indicator refers to the technical indicator that makes use of the fractal geometry found in the financial market. Fractal Pattern Scanner is the advanced Fractal Indicator that brings the latest trading technology after the extensive research and development work in the fractal geometry in the financial market. The most important feature in Fractal Pattern Scanner is the ability to measure the turning point probability as well as the trend probabi
Some informations on the chart with the single attachment. RangeBorder Buy Sell (RBBS) Non Repaint Indicator will provide trend line, buy sell arrows,reversal arrows, range channel, order exit area,high average price line and low average price line.All arrows and lines don't repaint and not lagging. Once candle closed it won't  repaint. Reading Indicator: 1. Small Stars , Indicates oversold and overbought with certain logic and price may reverse when this small star triggers. Useful to identify
Scalp88
Andrey Kozak
Scalp88 — MTF Scalp Indicator for XAUUSD (M1) Scalp88 is a professional scalping indicator for MetaTrader 4 , designed for fast market reading on the M1 timeframe and trading in the direction of the prevailing impulse. The indicator combines dynamic trend logic , volatility normalization (ATR) , and multi-timeframe confirmation (MTF) , presenting everything as clear arrows and an easy-to-read strength percentage. To learn how to purchase the indicator, follow this link:  https://www.mql5.com/en/
이 제품의 구매자들이 또한 구매함
El indicador "MR BEAST ALERTAS DE LIQUIDEZ" es una herramienta avanzada diseñada para proporcionar señales y alertas sobre la liquidez del mercado basándose en una serie de indicadores técnicos y análisis de tendencias. Ideal para traders que buscan oportunidades de trading en función de la dinámica de precios y los niveles de volatilidad, este indicador ofrece una visualización clara y detallada en la ventana del gráfico de MetaTrader. Características Principales: Canal ATR Adaptativo: Calcula
Miraculous Indicator – Gann Square of Nine 기반 100% 비리페인트 Forex 및 바이너리 도구 이 영상은 Miraculous Indicator 를 소개합니다. 이 지표는 Forex 및 바이너리 옵션 트레이더를 위해 특별히 개발된 매우 정확하고 강력한 트레이딩 도구입니다. 이 지표가 독특한 이유는 전설적인 **Gann Square of Nine(Gann 9의 사각형)**과 **Gann's Law of Vibration(Gann 진동의 법칙)**에 기반을 두고 있기 때문입니다. 이는 현대 트레이딩에서 가장 정밀한 예측 도구 중 하나로 손꼽힙니다. Miraculous Indicator는 완전히 비리페인트(non-repaint) 됩니다. 즉, 캔들이 마감된 후에도 신호가 변경되거나 사라지지 않습니다. 보이는 것이 곧 결과입니다. 이는 트레이더가 자신감을 가지고 거래에 진입하고 청산할 수 있는 신뢰할 수 있고 일관된 기반을 제공합니다. 주요 특징: Gann
Precautions for subscribing to indicator This indicator only supports the computer version of MT4 Does not support MT5, mobile phones, tablets The indicator only shows the day's entry arrow The previous history arrow will not be displayed (Live broadcast is for demonstration) The indicator is a trading aid Is not a EA automatic trading No copy trading function The indicator only indicates the entry position No exit (target profit)  The entry stop loss point is set at 30-50 PIPS Or the front hi
PairMaster Buy Sell Arrow Indicator for MT4 Trade Reversals Like a Pro — Catch Every Swing Point with Precision The PairMaster Buy Sell Arrow Indicator is a powerful MetaTrader 4 tool built to identify high-probability swing trading opportunities . Designed for traders who value accuracy, clarity, and simplicity, PairMaster detects key market turning points and plots intuitive buy and sell arrows directly on your chart. Key Features Accurate Swing Point Detection – Automatically identifies ma
Pulse Scalping Line - an indicator for identifying potential pivot points. Based on this indicator, you can build an effective Martingale system. According to our statistics, the indicator gives a maximum of 4 erroneous pivot points in a series. On average, these are 2 pivot points. That is, the indicator shows a reversal, it is erroneous. This means that the second signal of the indicator will be highly accurate. Based on this information, you can build a trading system based on the Martingale
Bomb Bank Signal
Igor Pereira Calil
5 (1)
폭탄 은행 신호: MetaTrader 4의 신뢰도 지표 Bomb Bank Signal은 금융 시장에서 가장 관련성이 높은 추세를 식별하도록 설계된 MetaTrader 4의 강력한 지표입니다. 움직임을 정확하게 예측하는 도구를 찾고 있다면 Bomb Bank가 바로 여러분에게 필요한 동맹입니다. 작동 방식: 이 지표는 거래량 분석, 양초 종가, 대칭 추세 등 세 가지 방법을 결합하여 매수 및 매도 기회를 감지하고 신호를 보냅니다. Bomb Bank는 매수 기회를 포착할 때는 '폭탄'과 같고, 매도 신호를 감지할 때에는 '해골'과 같습니다. 폭탄 은행은 왜 다른가요? 완전한 신뢰성: 폭탄 은행 신호는 신호를 제거하지 않습니다. 일단 신호가 발행되면 그 신호는 계속 유지되므로 기회를 절대 놓치지 않습니다. 극도의 정확성: Bomb Bank는 잘못된 신호를 보내지 않습니다. 시장이 발전함에 따라 조정하면서 실시간으로 업데이트하지만 이전 신호의 투명성은 유지합니다. 실시간 업데이트:
BinaryIndicator
Andrey Spiridonov
BinaryIndicator is a highly accurate indicator for trading binary options. It shows excellent results in scalping. This indicator is based in multifactor analysis of trend indicators, as well as confirmation oscillators, which in the end gives an increased accuracy of signals. Advantages of the indicator Increased accuracy of signals. Excellent results when trading binary options with a short expiration time from M30 to M1 . It works on any timeframes. Works with any trade symbols. Parameters
Rtc ML Ai Predictor MT4
Muhammad Faisal Sagala
Rtc ML Ai | Predictor CORE MACHINE LEARNING ENGINE Adaptive ML Market Predictor – Multi-Bar Trend & Candle Forecast What This Indicator Does This indicator is a  real-time market prediction engine  designed to analyze price behavior and estimate  future market tendencies . Unlike conventional indicators, this system  does not rely on static parameters or historical curve-fitting , but adapts its internal state dynamically during live market operation. Instead of using static rules, the indic
The Hurricane Indicator
Paul Nicholas Clevett
5 (1)
Currently switched to the 4 hour chart - but use other time frames for confirmation. :-)  I change my main time frame based on the market movement at the time. The Hurricane Forex Indicator is a multi time frame indicator that includes such things as Trade Notifications, Trade Calculator, Momentum Indicator, risk reward and much more. We have a free Trade room for our users as well. Please check out the video for full details of how this indicator works as it has over 15 years worth of developme
FFx Engulfing Setup Alerter gives trade suggestions with Entry, Target 1, Target 2 and StopLoss. Below are the different options available: Entry suggestion - pips to be added over the break for the entry 3 different options to calculate the SL - by pips, by ATR multiplier or at the pattern High/Low 3 different options to calculate the 2 TPs - by pips, by ATR multiplier or at Risk/Reward Offset the dashboard - any place on the chart Remove the suggestion once the price reached the SL line Lines
FFx InsideBar Setup Alerter gives trade suggestions with Entry, Target 1, Target 2 and StopLoss. Below are the different options available: Entry suggestion - pips to be added over the break for the entry Minimum candle size - to avoid too close buy/sell entry suggestions 3 different options to calculate the SL - by pips, by ATR multiplier or at the pattern High/Low 3 different options to calculate the 2 TPs - by pips, by ATR multiplier or at Risk/Reward Offset the dashboard - any place on the c
FFx OutsideBar Setup Alerter gives trade suggestions with Entry, Target 1, Target 2 and StopLoss. Below are the different options available: Entry suggestion - pips to be added over the break for the entry. 3 different options to calculate the SL - by pips, by ATR multiplier or at the pattern High/Low. 3 different options to calculate the 2 TPs - by pips, by ATR multiplier or at Risk/Reward. Offset the dashboard - any place on the chart. Remove the suggestion once the price reached the SL line.
FFx PinBar Setup Alerter gives trade suggestions with Entry, Target 1, Target 2 and StopLoss. Below are the different options available: Entry suggestion - pips to be added over the break for the entry Minimum candle size - to avoid too small candles 3 different options to calculate the SL - by pips, by ATR multiplier or at the pattern High/Low 3 different options to calculate the 2 TPs - by pips, by ATR multiplier or at Risk/Reward Offset the dashboard - any place on the chart Remove the sugges
FFx MACD Divergences
Eric Venturi-Bloxs
The purpose of this new version of the MT4 standard indicator provided in your platform is to display in a sub-window multiple timeframes of the same indicator with its divergences. See the example shown in the picture below. But the display isn't like a simple MTF indicator. This is the real display of the indicator on its timeframe. Here's the options available in the FFx divergences indicator: Select the timeframes to be displayed (M1 to Monthly) Define the width (number of bars) for each tim
FFx RSI Divergences
Eric Venturi-Bloxs
The purpose of this new version of the MT4 standard indicator provided in your platform is to display in a sub-window multiple timeframes of the same indicator with its divergences. See the example shown in the picture below. But the display isn't like a simple MTF indicator. This is the real display of the indicator on its timeframe. Here's the options available in the FFx divergences indicator: Select the timeframes to be displayed (M1 to Monthly) Define the width (number of bars) for each tim
FFx CCI Divergences
Eric Venturi-Bloxs
The purpose of this new version of the MT4 standard indicator provided in your platform is to display in a sub-window multiple timeframes of the same indicator with its divergences. See the example shown in the picture below. But the display isn't like a simple MTF indicator. This is the real display of the indicator on its timeframe. Here's the options available in the FFx divergences indicator: Select the timeframes to be displayed (M1 to Monthly). Define the width (number of bars) for each ti
The FFx Dashboard MTF alerter will show you on a single chart all the timeframes (M1 to Monthly) with their own status for the indicator. 2 Alert Options: Single timeframe: each selected timeframe alert separately when a signal occurs Multi timeframes: all selected timeframes must agree for an alert to be triggered Both options have an input to select the timeframes to be used for the alert(s). How to Understand the Status: Green/Red square: histogram above/below 0 line Green square + Red bord
The FFx Dashboard MTF alerter will show you on a single chart all the timeframes (M1 to Monthly) with their own status for the indicator. 2 Alert Options: Single timeframe: each selected timeframe alert separately when a signal occurs Multi timeframes: all selected timeframes must agree for an alert to be triggered Both options have an input to select the timeframes to be used for the alert(s). How to understand the status: Green/Red square: RSI above/below 50 line Green square + Red border: R
The FFx Dashboard MTF alerter will show you on a single chart all the timeframes (M1 to Monthly) with their own status for the indicator. 2 Alert Options: Single timeframe: each selected timeframe alert separately when a signal occurs Multi timeframes: all selected timeframes must agree for an alert to be triggered Both options have an input to select the timeframes to be used for the alert(s). How to understand the status: Green/Red square: Stoch above/below 50 line Green square + Red border:
The FFx Dashboard MTF alerter will show you on a single chart all the timeframes (M1 to Monthly) with their own status for the indicator. 2 Alert Options: Single timeframe: each selected timeframe alert separately when a signal occurs Multi timeframes: all selected timeframes must agree for an alert to be triggered Both options have an input to select the timeframes to be used for the alert(s). How to understand the status: Green/Red square: Price above/below Cloud (Kumo) Green square + Red bo
The FFx Dashboard MTF alerter will show you on a single chart all the timeframes (M1 to Monthly) with their own status for the indicator. 2 Alert Options: Single timeframe: each selected timeframe alert separately when a signal occurs Multi timeframes: all selected timeframes must agree for an alert to be triggered Both options have an input to select the timeframes to be used for the alert(s). How to understand the status: Green/Red square: MA pointing Up/Down Green square + Red border: MA po
The FFx Dashboard MTF alerter will show you on a single chart all the timeframes (M1 to Monthly) with their own status for the indicator. 2 Alert Options: Single timeframe: each selected timeframe alert separately when a signal occurs. Multi timeframes: all selected timeframes must agree for an alert to be triggered. Both options have an input to select the timeframes to be used for the alert(s). How to understand the status: Green square: Price above PSAR Red square: Price below PSAR Options
The FFx Dashboard MTF alerter will show you on a single chart all the timeframes (M1 to Monthly) with their own status for the indicator. 2 Alert Options: Single timeframe: each selected timeframe alert separately when a signal occurs Multi timeframes: all selected timeframes must agree for an alert to be triggered Both options have an input to select the timeframes to be used for the alert(s). How to understand the status: Green/Red square: CCI above/below levels (ie. 100/-100) Grey square: C
The FFx Dashboard MTF alerter will show you on a single chart all the timeframes (M1 to Monthly) with their own status for the indicator. 2 Alert Options: Single timeframe: each selected timeframe alert separately when a signal occurs Multi timeframes: all selected timeframes must agree for an alert to be triggered Both options have an input to select the timeframes to be used for the alert(s). How to understand the status: Green/Red square: ADX above level Grey square: ADX below level Red bor
The FFx Dashboard MTF alerter will show you on a single chart all the timeframes (M1 to Monthly) with their own status. 2 Alert Options: Single timeframe: each selected timeframe alert separately when a signal occurs Multi timeframes: all selected timeframes must agree for an alert to be triggered Both options have an input to select the timeframes to be used for the alert(s). How to understand the status: Green/Red square: bullish/bearish candle Options available in the FFx Dashboard Alerter
THE GRAFF III
Antonin Skaryd
The [GRAFF] III manual trading system is based on multiple MetaTrader (MT4) indicators. Together, the entire PACK of GRAFF III indicators makes an advanced trading tool. The system consists of over 20 different custom-built indicators which have been carefully selected and tested in the long term to produce strong and efficient trading signals. The particular indicators are based on different mathematical formulas, so the entire system is calibrated to remove false signals from its own indicator
FFx Universal Strength Meter PRO is more than a basic strength meter. Instead of limiting the calculation to price, it can be based on any of the 19 integrated strength modes + 9 timeframes. With the FFx USM, you are able to define any period for any combination of timeframes. For example, you can set the dashboard for the last 10 candles for M15-H1-H4… Full flexibility! Very easy to interpret... It gives a great idea about which currency is weak and which is strong, so you can find the best pai
A simplistic indicator informing a user on RSI divergence by sending messages to mobile device and email. The indicator draws 2 vertical lines, marking two RSI extrema that formed the divergence. You get the alert, open the charts and make a decision. The indicator does not show past divergences, thus when you attach it to a chart for the first time you see nothing. Graphics and alerts will appear as soon as divergences do. Drop it in Tester to see how it works. Parameters: RSIPeriod - number of
제작자의 제품 더 보기
Base XP 1
Umar Ismail
This indikator is used as a supporting indicator. its function is to find out the position of the price reflection position, but he cannot work alone, requires another set of indicators which will immediately be sold separately The principle of Supply And Demand can be used as a forex trading analysis tool. One way to use it is to rely on the balance zone as zone stops Supply And Demand and the trading system applied, as well as the legal basis for general supply and demand.
Hi. The main obstacle for multi timeframe traders or traders who use multiple indicators on multiple charts is when they want to do analysis on multiple pairs quickly. You can imagine if there are 3 or 10 charts that must be opened when you want to do analysis. and each chart has its own template. of course it will take a long time to replace one by one before analysis. how many opportunities are lost due to the time spent changing charts. or maybe when a mentor wants to explain to his students
필터:
리뷰 없음
리뷰 답변