Tri Index Pullback
- Experts
-
Ciprian Ghebanoaei
 Algorithmic trader and MQL5 developer from Romania, building Expert Advisors since 2018.
- 버전: 1.0
- 활성화: 5
Swing pullback EA for Dow Jones, S&P 500 and Nasdaq 100 on H4, all three from one chart: stop loss and take profit on every trade, about 115 trades per year, no grid, no martingale.
Tri Index Pullback trades short pullbacks on the three main US stock indices — Dow Jones, S&P 500 and Nasdaq 100 — on the H4 timeframe. One chart runs all three symbols. Below are the rules, every test result, and the weak points, so you know exactly what to expect before you buy.
How it works
- A swing low (or high) is confirmed when a fractal forms, i.e. two closed H4 bars on its right side.
- The swing bar must show a short-term pullback: RSI(3) below 42 for a buy (above 58 for a sell).
- The last closed bar must close above the high of the swing bar (buy) or below its low (sell). This confirms that the pullback has turned.
- New trades are opened only during US-session hours (03:00–15:00 New York time, in practice the H4 bars that cover the US morning and midday). Without this filter the strategy did not work in testing.
- Stop loss = 1.5 x ATR(14), take profit = 1.5 x the stop distance (about 1:1.5 reward to risk). A trade still open after 48 H4 bars (about 8 trading days) is closed at market.
- At most one position per index at a time, so at most three positions open together. Both buy and sell trades are taken.
Risk management
- Position size is a fixed percentage of equity per trade (default 0.5%) lost if the stop is hit.
- Every order has a stop loss and a take profit from the moment it is opened.
- No grid, no martingale, no averaging, no hedging, no lot increase after losses.
- If the broker minimum lot is larger than the risk allows, the EA trades the minimum lot only while its real risk stays below a limit you set (default 2% of equity), otherwise it skips the trade.
- The trade is skipped if the spread is wider than 0.2 x ATR(14), or if the market of that index is closed.
- Free margin is checked before every order.
Backtest results (simulation, not live trading)
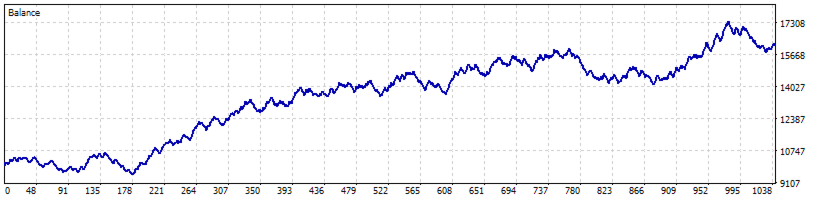
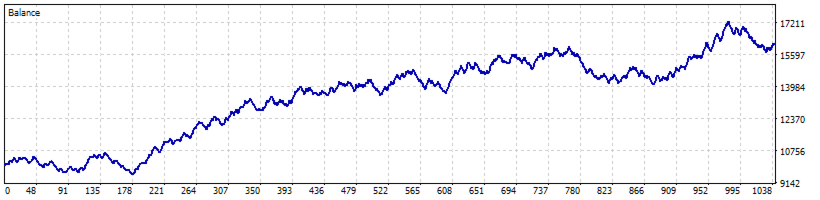
Admirals MT5 data, H4 chart, symbols [DJI30], [SP500], US100 traded together, 10,000 USD starting balance, 0.5% risk per trade, default inputs.
| Period | Model | Net profit | Profit factor | Trades | Max equity drawdown |
|---|---|---|---|---|---|
| 2018–2026 | 1-minute OHLC | +6,172 USD | 1.16 | 1,037 | 13.4% |
| 2018–2026 | Real ticks | +6,225 USD | 1.16 | 1,037 | 13.0% |
| 2018–2024 | 1-minute OHLC | +4,570 USD | 1.16 | 795 | 11.3% |
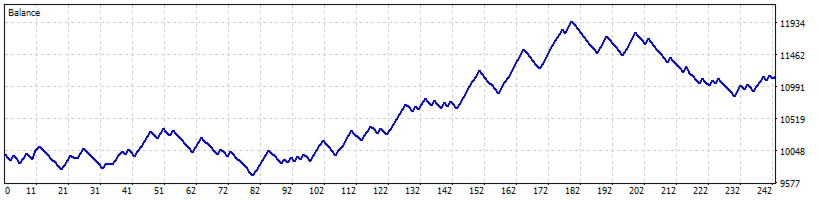
| 2025–2026 (to November) | 1-minute OHLC | +1,103 USD | 1.16 | 242 | 9.7% |
| 2025–2026 (to November) | Real ticks | +1,146 USD | 1.16 | 242 | 9.8% |
Results by calendar year (2018–2026, real ticks, 0.5% risk; each year continues from the previous balance)
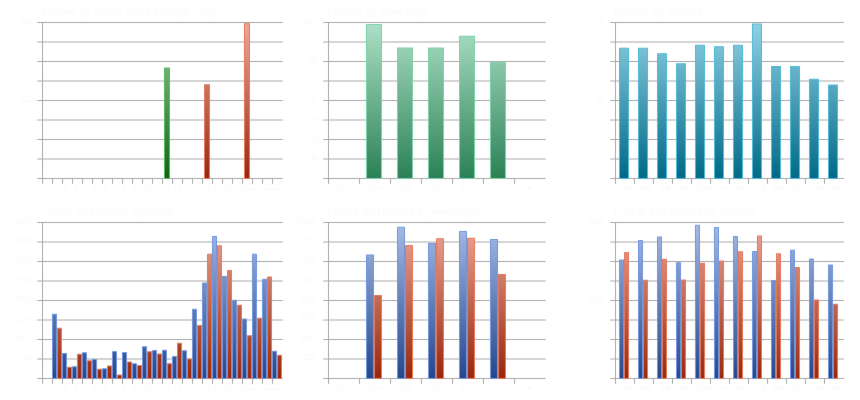
| Year | 2018 | 2019 | 2020 | 2021 | 2022 | 2023 | 2024 | 2025 | 2026* |
|---|---|---|---|---|---|---|---|---|---|
| Net profit (USD) | +576 | +1,026 | +1,540 | +1,072 | +488 | +518 | −671 | +1,166 | +511 |
*2026 until mid-November. Eight of nine years were positive; 2024 was a losing year.
Trade statistics (2018–2026, 1-minute OHLC, 0.5% risk)
- About 115 trades per year in total (roughly 2 per week), around 40 per index.
- Winning trades: 44.7%. Average win +96 USD, average loss −67 USD. Some trades end at the 48-bar time exit, so not every win or loss equals the full target or stop.
- Longest losing streak: 13 trades in a row, −991 USD (about −10% of the balance at that time).
- Average holding time: about 30 hours.
- Profit factor 1.16, recovery factor 2.85, Sharpe ratio 1.07.
- Profit by index: Dow Jones +2,842, Nasdaq 100 +2,026, S&P 500 +1,304 USD. All three were positive.
- Profit by direction: buys +3,885, sells +2,287 USD. Both directions were positive, so the result does not come only from the long-term rise of the indices.
Effect of the risk setting (2018–2026, 1-minute OHLC, same trades)
| Risk per trade | Net profit | Max equity drawdown | Losing years |
|---|---|---|---|
| 0.25% (conservative) | +2,711 USD | 6.7% | 2024 (−247) |
| 0.5% (default) | +6,172 USD | 13.4% | 2024 (−679) |
| 1.0% | +15,167 USD | 25.5% | 2024 (−2,202) |
Higher risk increases profit and drawdown roughly in proportion. Above 0.5% the drawdowns become large; please decide this according to your own tolerance.
How the default inputs were checked
- The approach was first screened on 192 input combinations on four Forex pairs and on three US indices, on H1 and H4. It failed on Forex and worked only on the US indices on H4.
- The inputs were chosen on 2018–2024 data and then run without changes on 2025–2026.
- Changing stop, target, RSI level and time exit by about ±20% (81 combinations): 39 combinations were profitable on all three indices in both periods. A stop of 1.2 x ATR was too tight and failed everywhere; 1.5–1.8 x ATR worked.
- Adding extra trading costs of 0.02 x ATR per trade reduced the 2018–2026 profit to about +5,280 USD, and 0.05 x ATR (several times a normal spread) to about +3,900 USD. The strategy stayed profitable.
- Real-tick tests gave practically the same results as 1-minute OHLC tests, because the EA works on H4 bars.
What did NOT work in testing (so the EA is not offered for it)
- Forex pairs (EURUSD, GBPUSD, USDCAD, USDJPY): profit factor about 0.85–0.89.
- European and Japanese indices (DAX, FTSE 100, CAC 40, Nikkei 225) added to the portfolio: the result became negative.
- H1 and H2 timeframes on the US indices: profit factor 0.93–1.02.
- Trading without the US-session filter: negative on all tests.
- Settings with more trades exist (170–240 trades per year, for example RSI filter off), but their profit factor was only 1.06–1.10 and the drawdown higher, so they are not the default.
Honest limitations
- The edge is modest: profit factor 1.16 means that for every 1.16 USD won, about 1 USD is lost. Expect long flat or losing periods; in the test the longest losing streak was 13 trades and one full year (2024) was negative.
- At 0.5% risk the average return in the test was about 6% per year. The EA is not designed for fast account growth.
- Results depend on your broker’s index CFDs: spread, commission, swap (positions are held about 30 hours on average, so overnight swap applies), and the hour at which your broker’s H4 bars start. The tests used a broker on GMT+2/+3 with US daylight saving; on brokers with a different time zone the H4 bars are cut at different hours and results will differ.
- Past results, including real-tick backtests, do not guarantee future results.
Please test the EA in the Strategy Tester and on a demo account with your own broker before trading real money.
Recommended use
- Attach the EA to ONE H4 chart of one of the indices (for example the Dow Jones chart). Do not attach it to all three charts with Symbols_List=AUTO, or the trades would be doubled.
- Symbols: set Symbols_List = AUTO to let the EA find the Dow Jones, S&P 500 and Nasdaq 100 symbols (it knows the common names such as US30 / US500 / US100, NAS100, USTEC, SPX500, [DJI30], [SP500]). If your broker uses other names or suffixes (for example US30.r), type them yourself, separated by commas: US30.r,US500.r,US100.r. Leave it empty to trade only the chart symbol.
- The journal shows at start which symbols are traded ("TriIndexPullback: trading ...").
- Account: hedging or netting. With 0.5% risk, about 2,000 USD or more is recommended so the lot size can follow the risk on all three indices; smaller accounts trade the minimum lot when its risk is below Max_Min_Lot_Risk.
- Run on a VPS or a computer that stays on; the EA checks the indices on every new H4 bar.
- Recommended settings: Symbols_List = AUTO, Risk_Percent = 0.5 (or 0.25 for the conservative profile); all other inputs at their defaults.
Inputs
| Input | Default | Meaning |
|---|---|---|
| Symbols_List | (empty) | Comma-separated symbols, AUTO = find Dow/S&P/Nasdaq, empty = chart symbol only. |
| Allow_Long / Allow_Short | true / true | Allow buy / sell trades. |
| RSI_Extreme | 42 | RSI(3) at the swing bar below this for buys, above 100 − this for sells; 0 = off. |
| Confirm_Break | true | Closed bar must break the swing bar’s high (buy) or low (sell). |
| Session_Filter | true | Enter only inside the session; ignored on D1 and higher timeframes. |
| Session_Start / Session_End | 3 / 15 | Session hours, New York time. |
| SL_ATR | 1.5 | Stop loss as a multiple of ATR(14). |
| RR | 1.5 | Take profit as a multiple of the stop distance; 0 = none. |
| Max_Bars | 48 | Close a trade after this many bars; 0 = off. |
| Risk_Percent | 0.5 | Risk per trade, % of equity (applies to each index). |
| Max_Min_Lot_Risk | 2.0 | Maximum risk in % allowed when the broker minimum lot is used. |
| Max_Lots | 10 | Upper limit per trade. |
| Max_Spread_ATR | 0.2 | Skip the trade if the spread is above this fraction of ATR(14). |
| Tester_GMT_Offset / Tester_DST | 2 / US | Broker time zone, used only in the Strategy Tester (live trading detects it automatically). |
| Magic_Number, Trade_Comment | Order identification. |
Risk warning
Trading leveraged products such as index CFDs carries a high risk of loss. Backtest results are simulations based on historical data and do not guarantee future results. Only trade with money you can afford to lose.