Supreme Dynamic Profile MT4
- 지표
-
Kestutis Balciunas
 금융 시장에서 16년 이상의 실전 경험을 바탕으로, 저는 MT4/MT5용 고성능 외환 거래 전략, 기술적 지표 및 자동화된 전문가 자문 시스템(Expert Advisors) 개발을 전문으로 합니다. 제 작업은 정확성, 일관성 및 실제 적용 가능성을 위해 정밀하게 설계된 거래 시스템을 아우릅니다.
- 버전: 1.0
- 활성화: 10
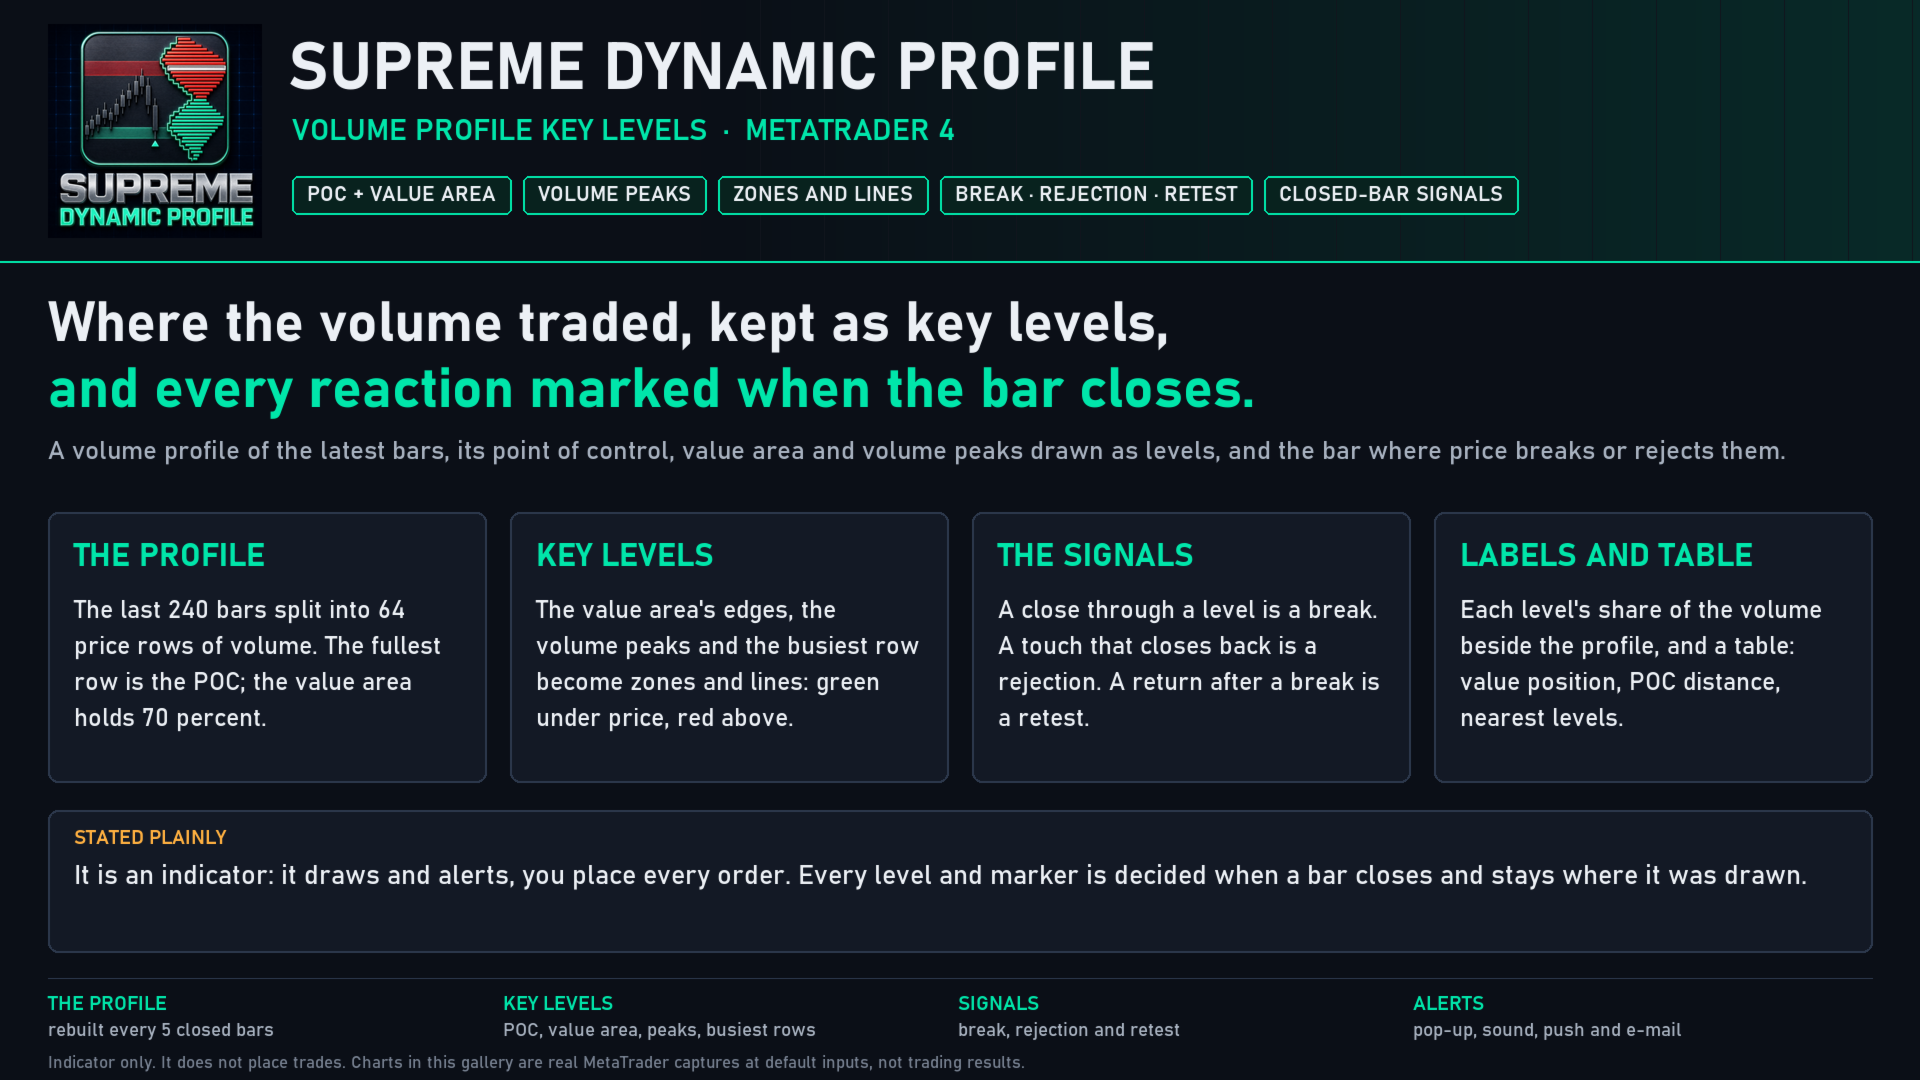
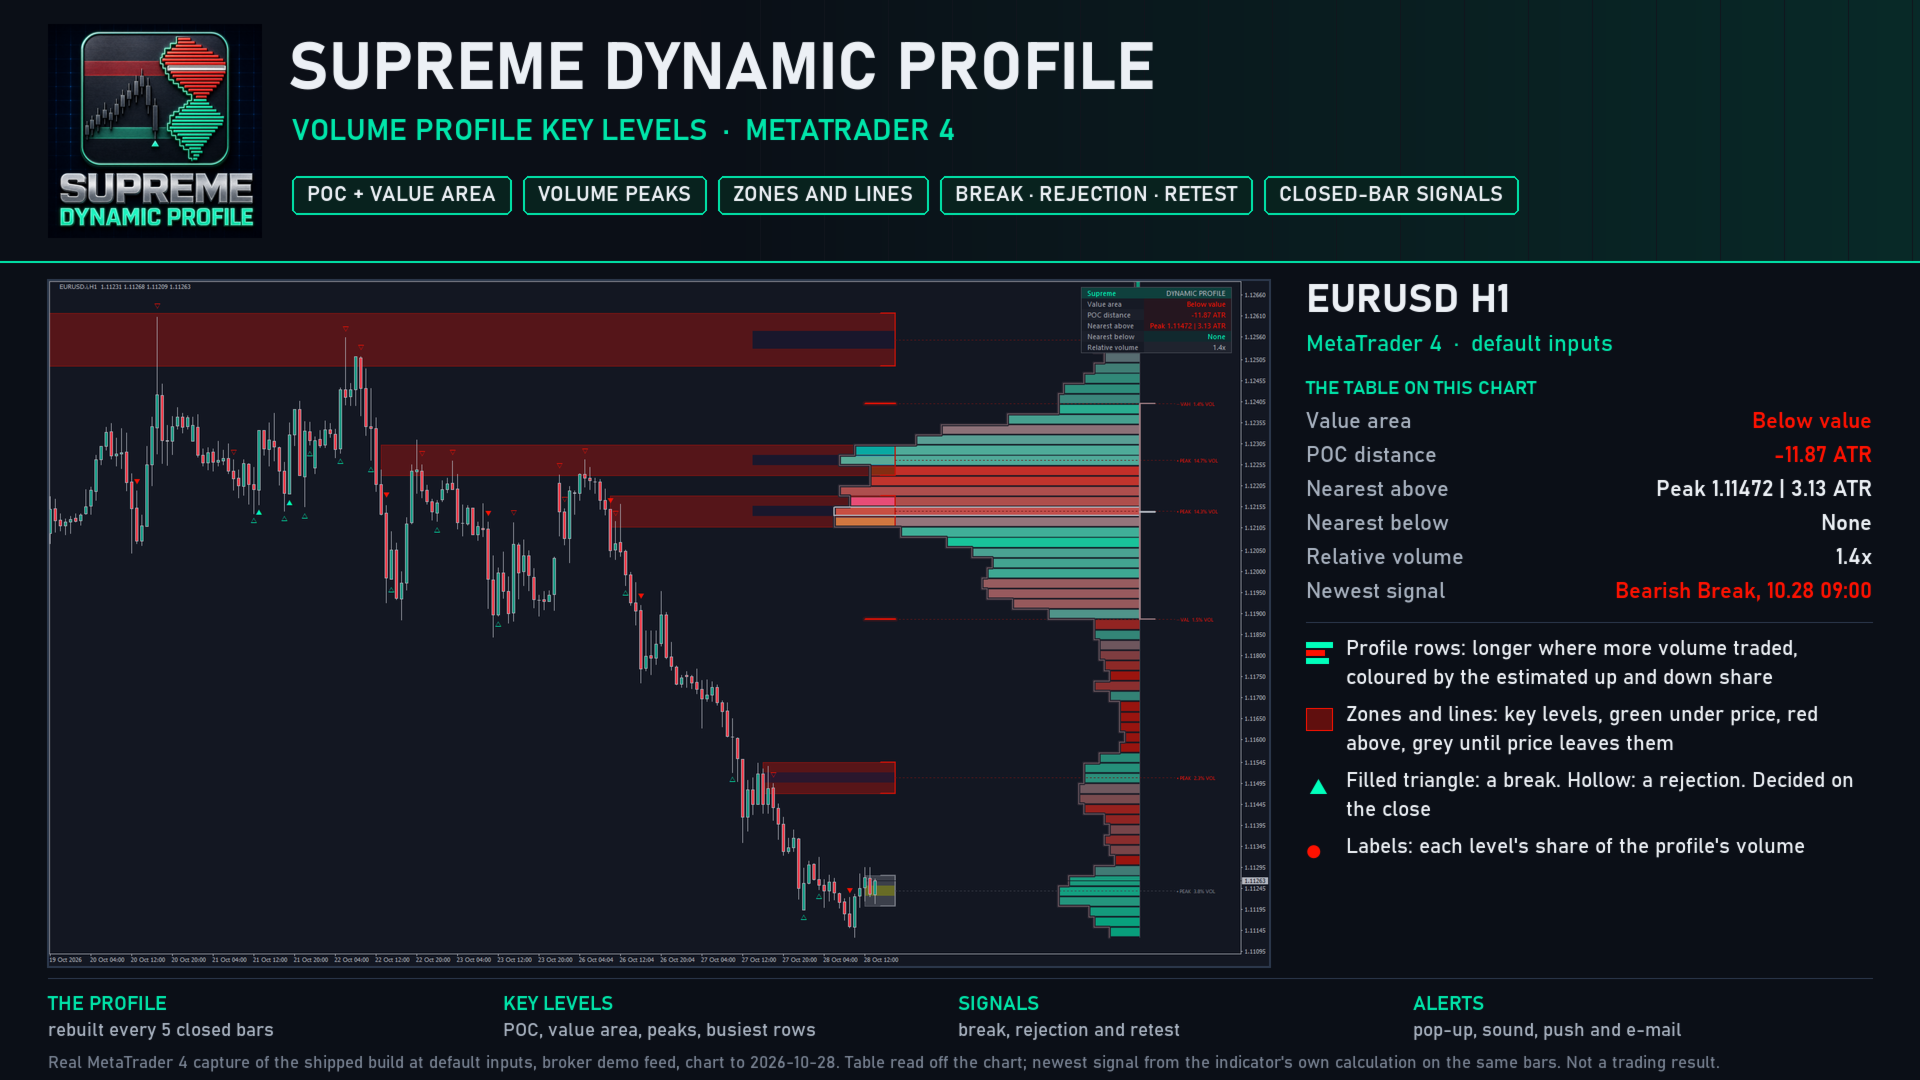
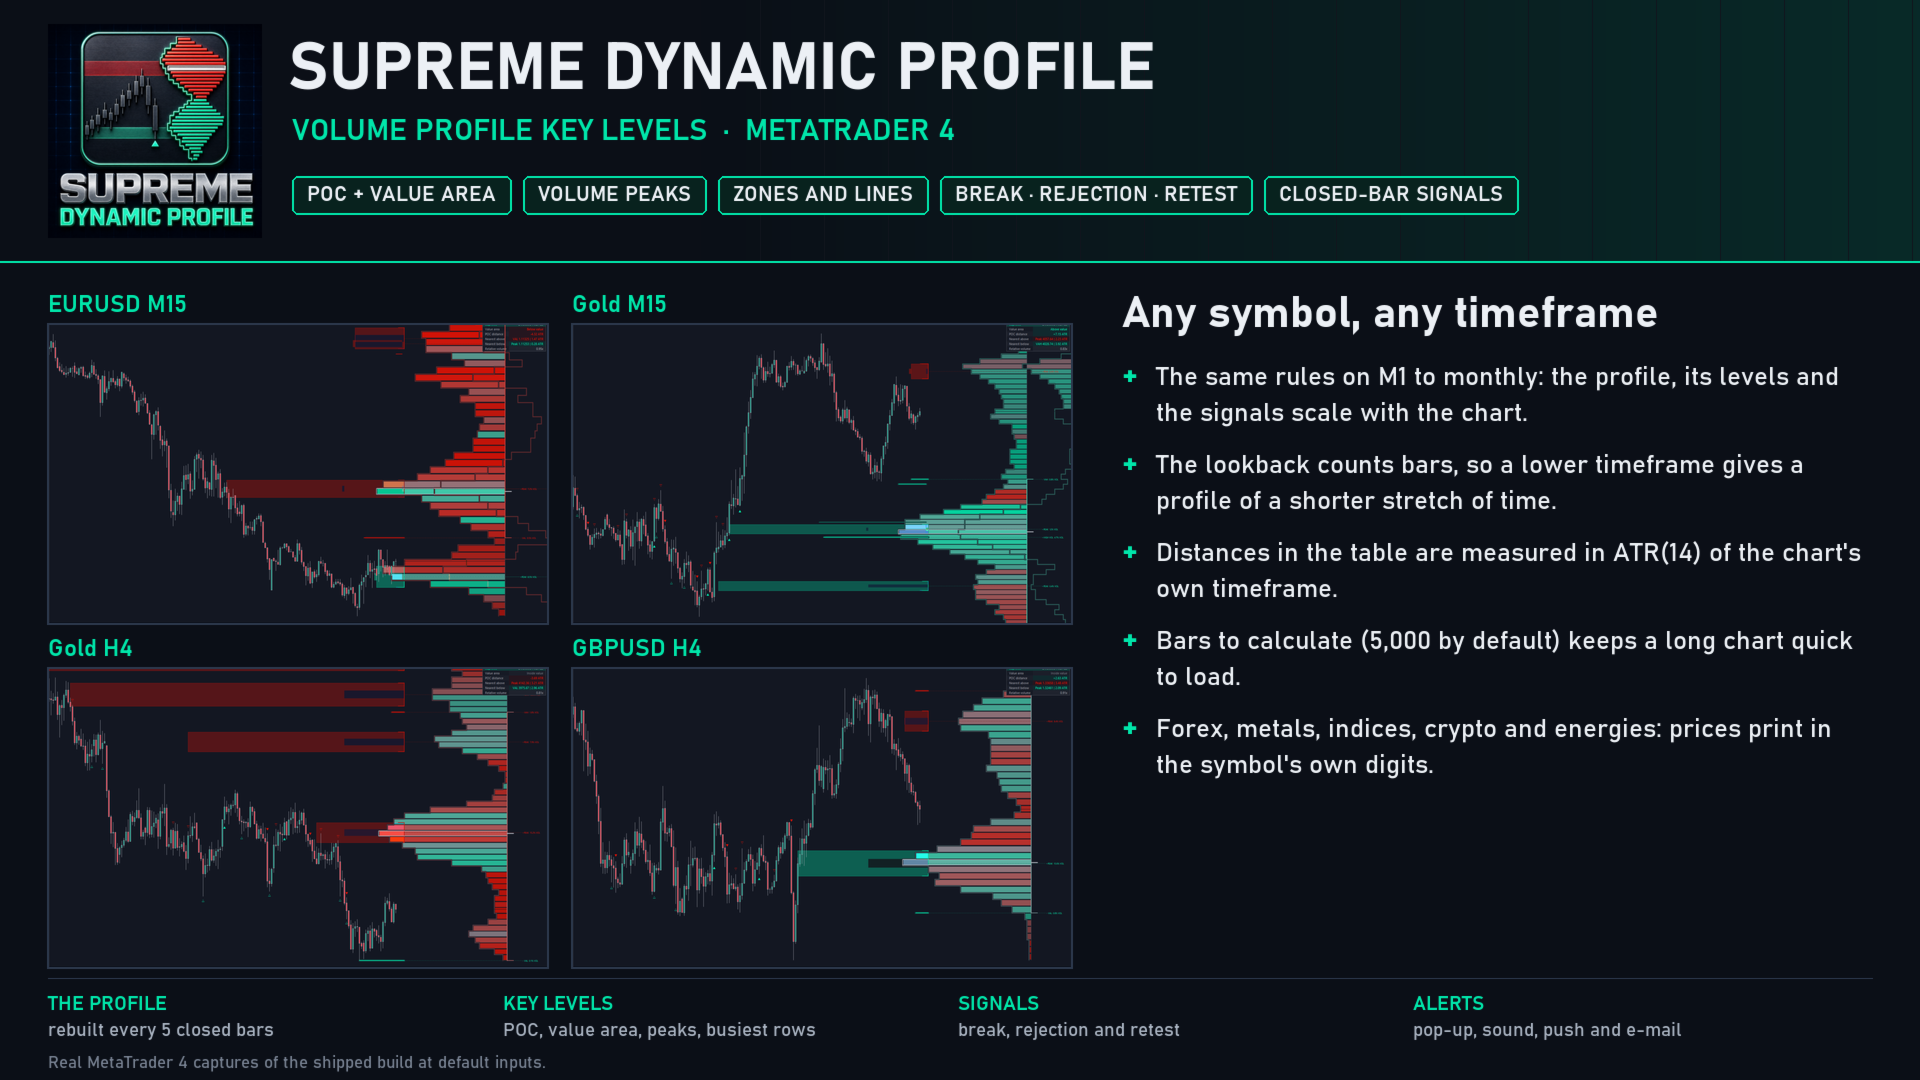
Supreme Dynamic Profile builds a volume profile of the most recent bars and turns it into a set of key levels. It finds the point of control, the value area and the volume peaks of the profile, keeps them on the chart as zones and lines, and marks every bar where price breaks a level, rejects it or comes back to retest it. A table in the corner sums up where price stands against the profile. Every level and every marker is decided when a bar closes and stays where it was drawn.
- MT4 version: {{OTHER_URL}}
- Trading guide, how to trade with it step by step: {{BLOG_URL}}
- User manual, every setting explained: {{MANUAL_URL}}
HOW THE PROFILE IS BUILT
- The window: the last 240 bars by default (Fixed), or, in Dynamic mode, the bars since the latest confirmed pivot high or low (35 bars on each side), never more than the lookback limit.
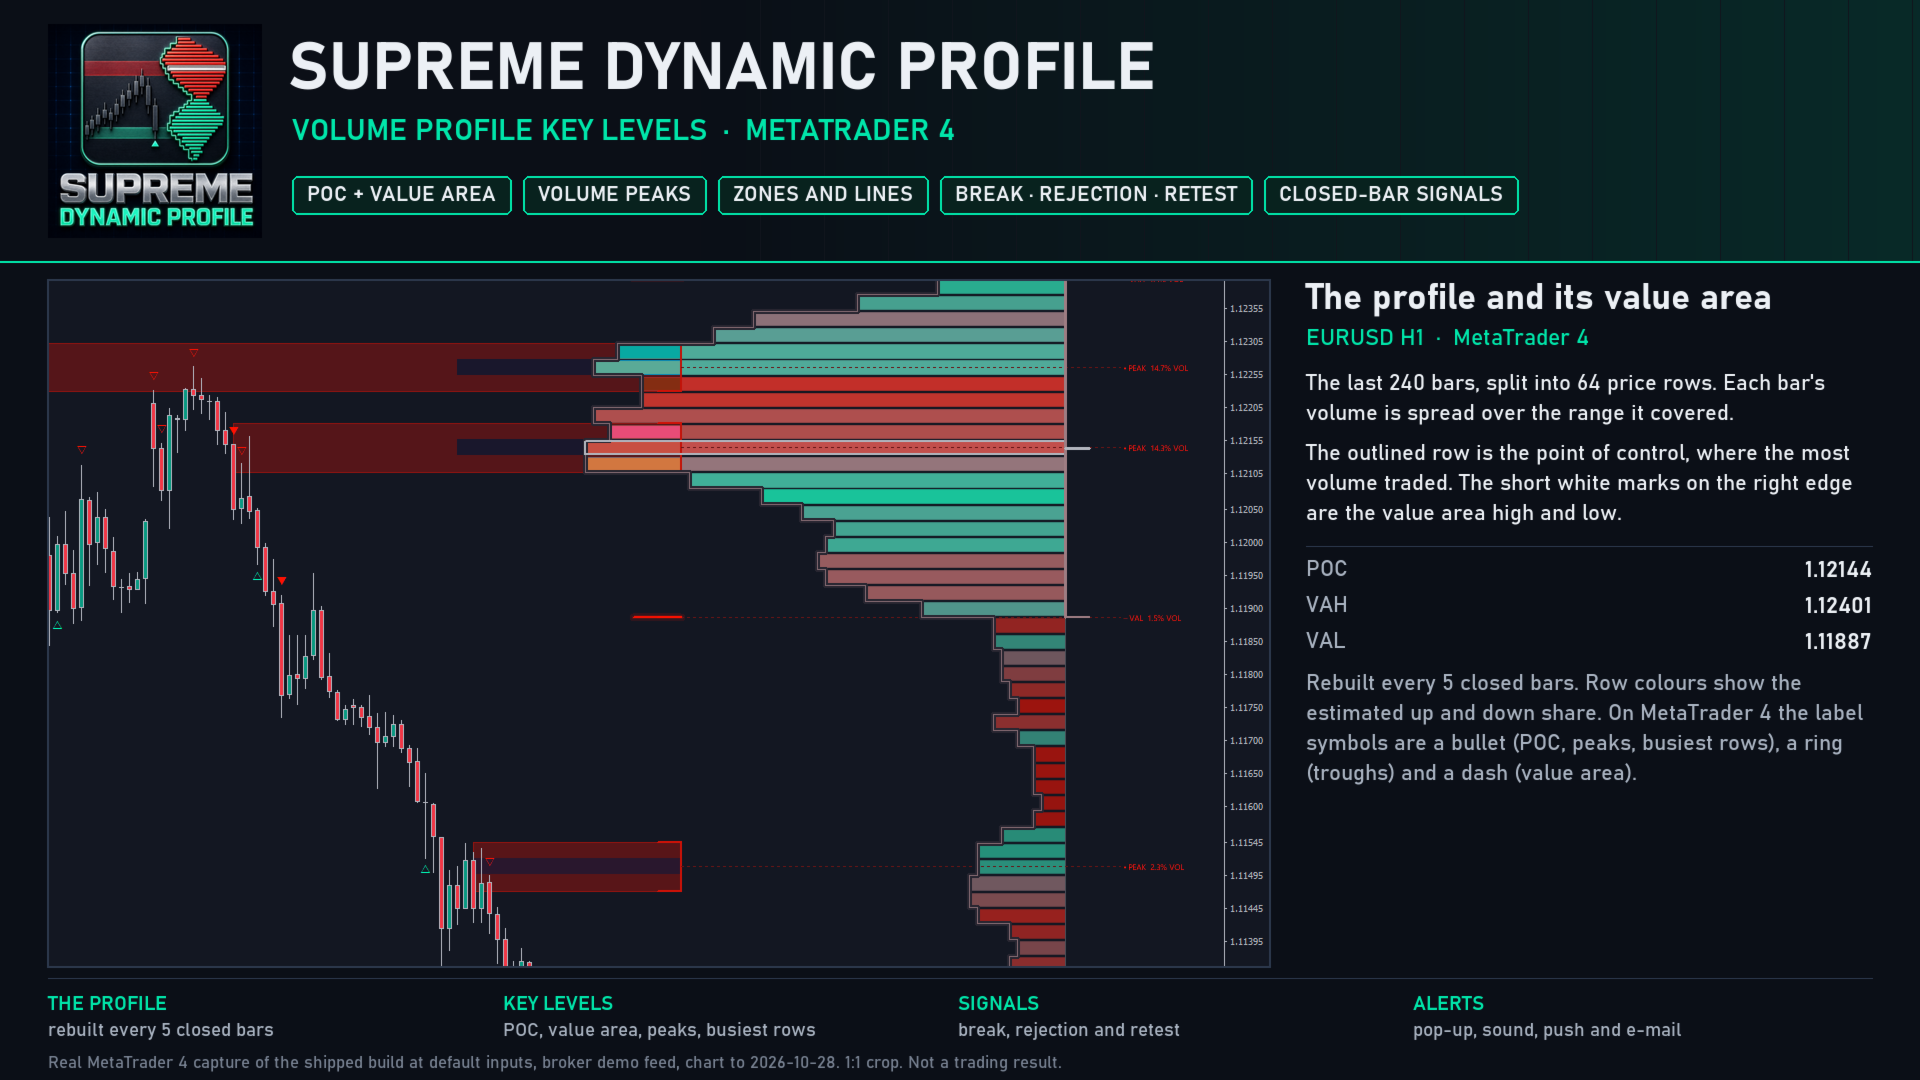
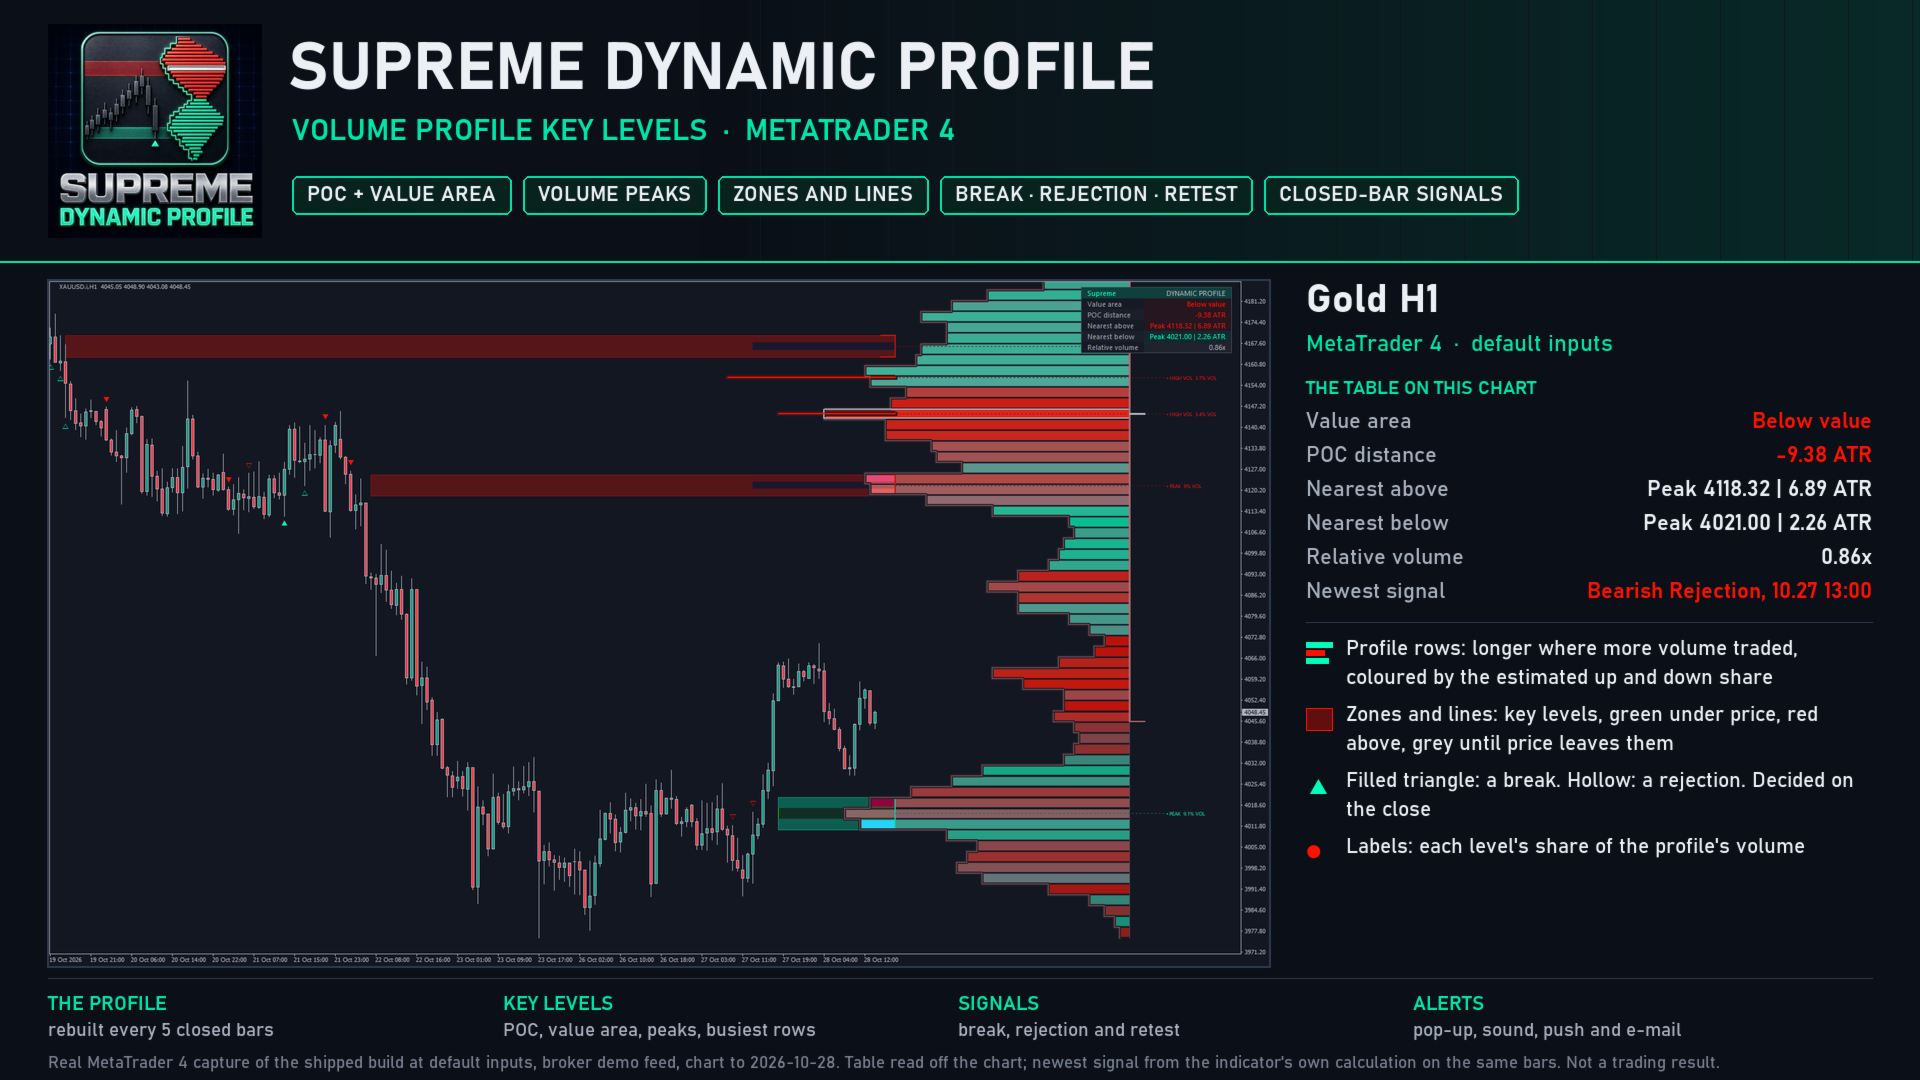
- The rows: the window's range is split into 64 price rows, and each bar's tick volume is spread evenly over the range it covered. A bar that closed up counts as up volume, one that closed down as down volume; each row is coloured by that estimated split.
- The point of control (POC) is the row with the most volume. The value area grows out from it, one row at a time towards the heavier side, until it holds 70 percent of the volume. Its top is the value area high (VAH), its bottom the value area low (VAL).
- The profile is rebuilt on every 5th closed bar inside the last 2,000 bars and drawn to the right of the newest candle, with an outline and marks at the POC, VAH and VAL.
KEY LEVELS
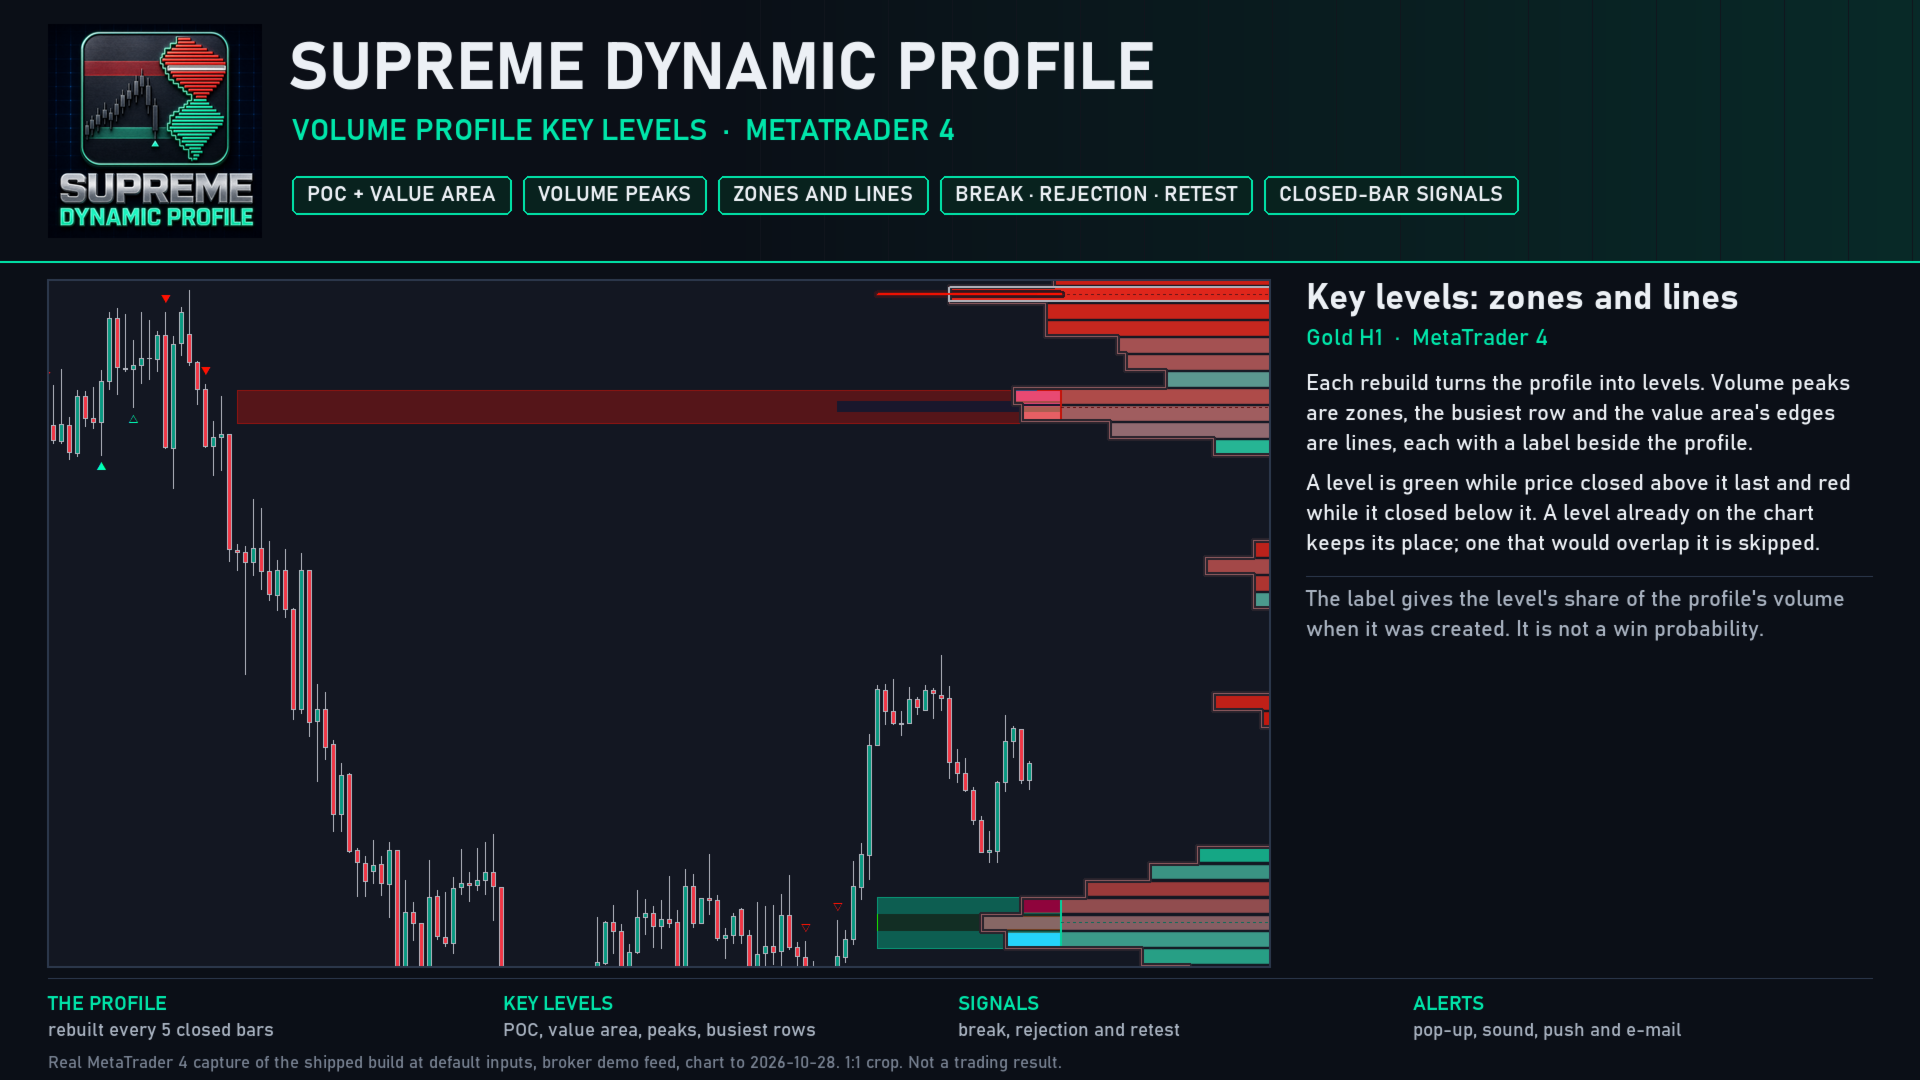
- Each rebuild proposes levels: the VAH and the VAL as lines, up to 2 volume peaks as zones, and the highest-volume row as a line. The POC, volume troughs and the lowest-volume rows can be switched on, and every family can be drawn as zones or lines.
- A level is green while price closed above it last and red while it closed below it, so support and resistance read at a glance; a level created with price inside it stays grey until a bar closes outside it.
- A node already on the chart is kept as it was first drawn, and a new one that would overlap an existing node is skipped. A level stops when a bar closes through it, or after 500 bars; up to 150 levels are stored.
- The nearest peak, trough and ranked row are always drawn, then the others by distance to price, up to 8 at a time. Levels near price are highlighted.
THE SIGNALS
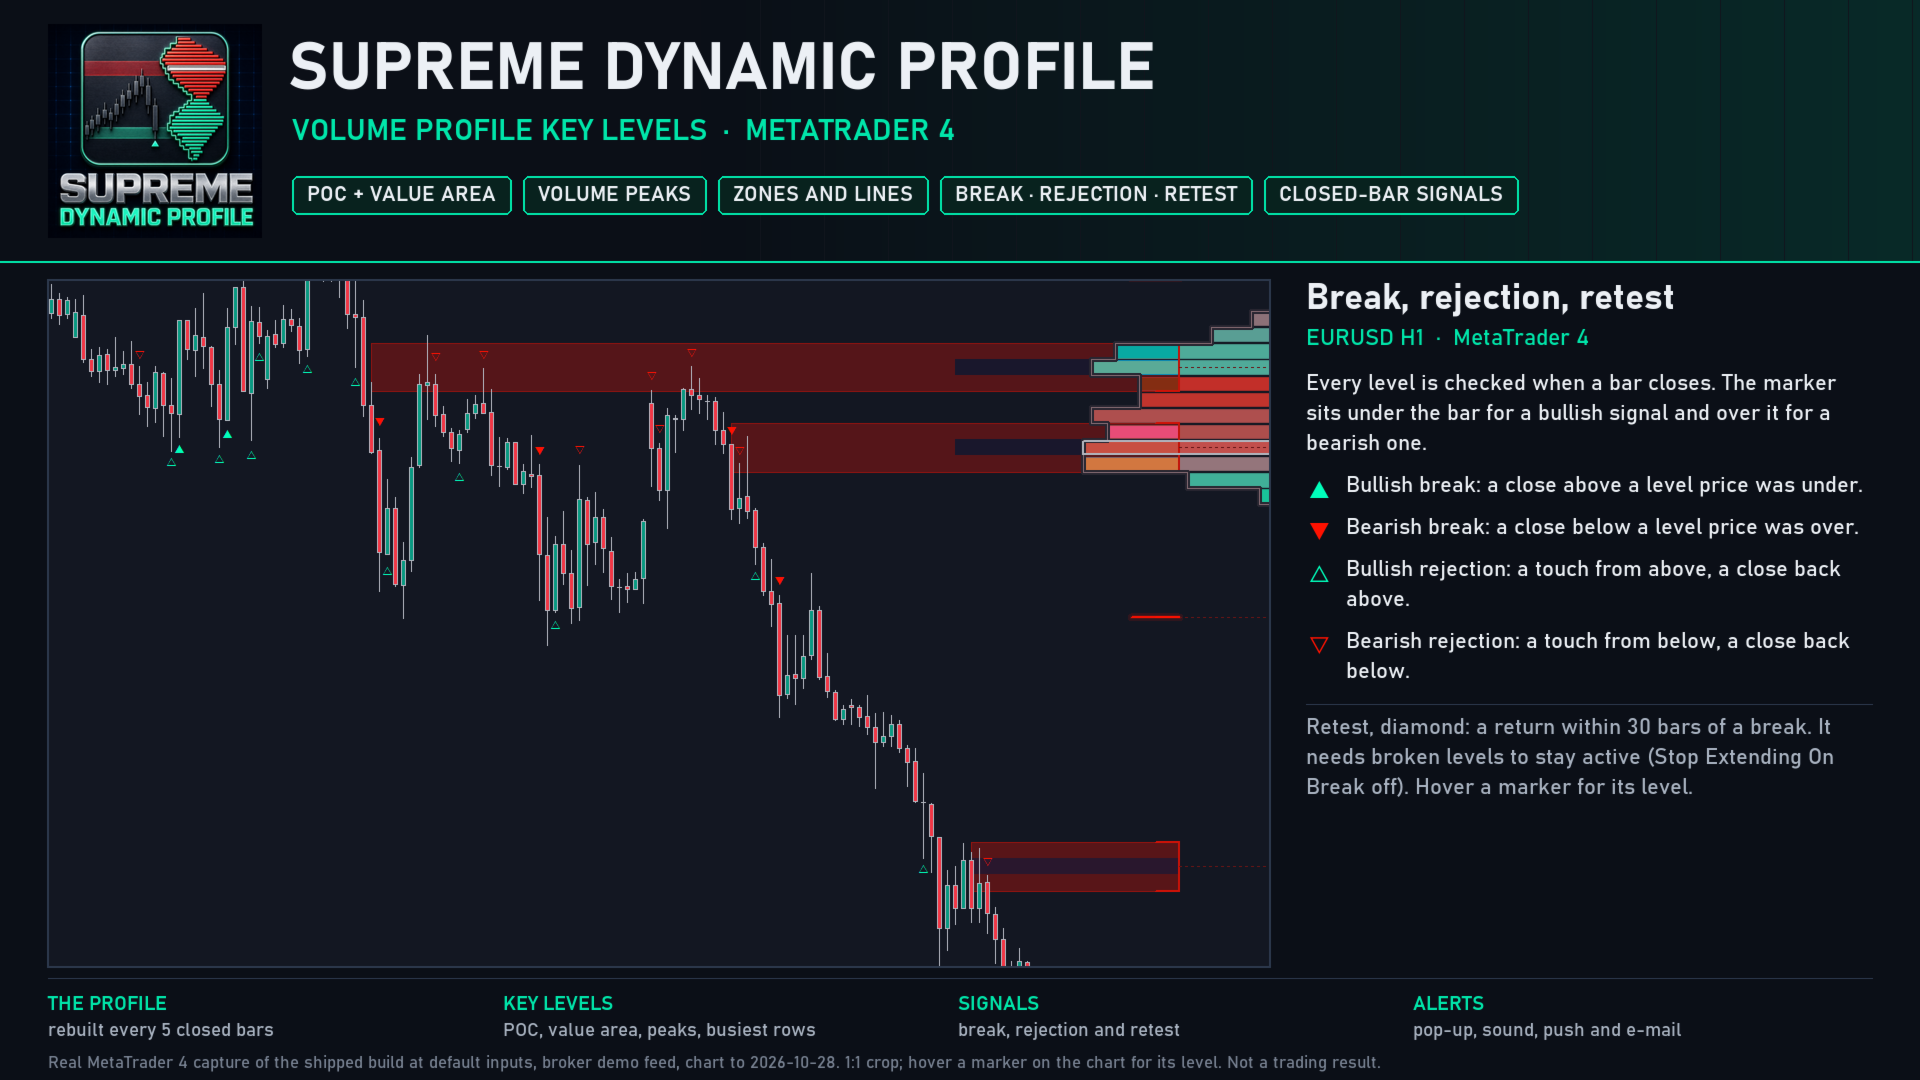
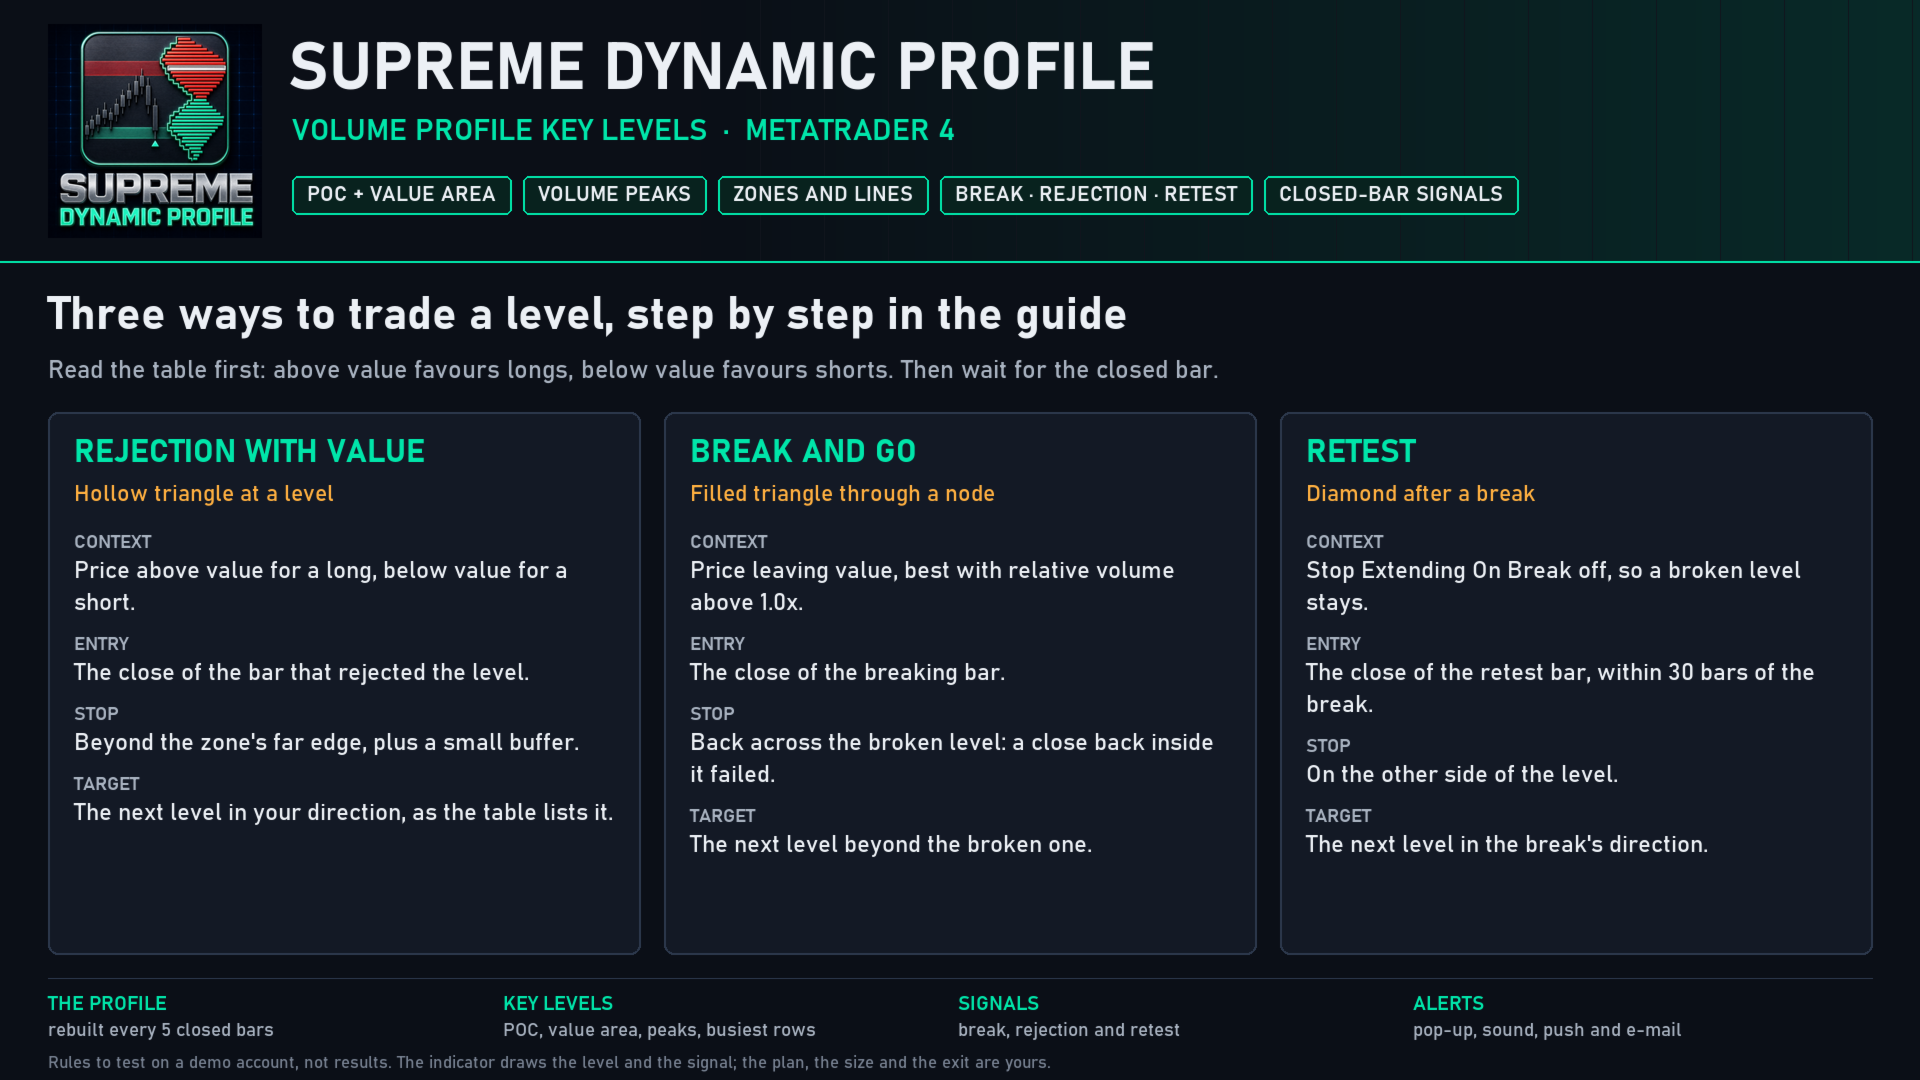
- Break (filled triangle): a bar closes on the other side of a level from where it last closed. Under the bar when it closed above, over the bar when it closed below.
- Rejection (hollow triangle): price reaches into a level from one side and a bar closes back on that same side without breaking it.
- Retest (diamond): within 30 bars of a break, price touches the level again and closes on the break's side. A retest needs broken levels to stay active, so it appears when "Stop Extending On Break" is switched off.
- By default only volume nodes give signals (switch "Signal Levels" to All Levels for the POC and value area too), the same level waits 3 bars between signals, and an optional relative volume filter keeps only signals on busy bars.
- At most one bullish and one bearish marker per bar, a break first. Hover a marker to see every level that signalled on that bar, with its price, volume share, row strength, up volume, touches and age.
LABELS AND THE TABLE
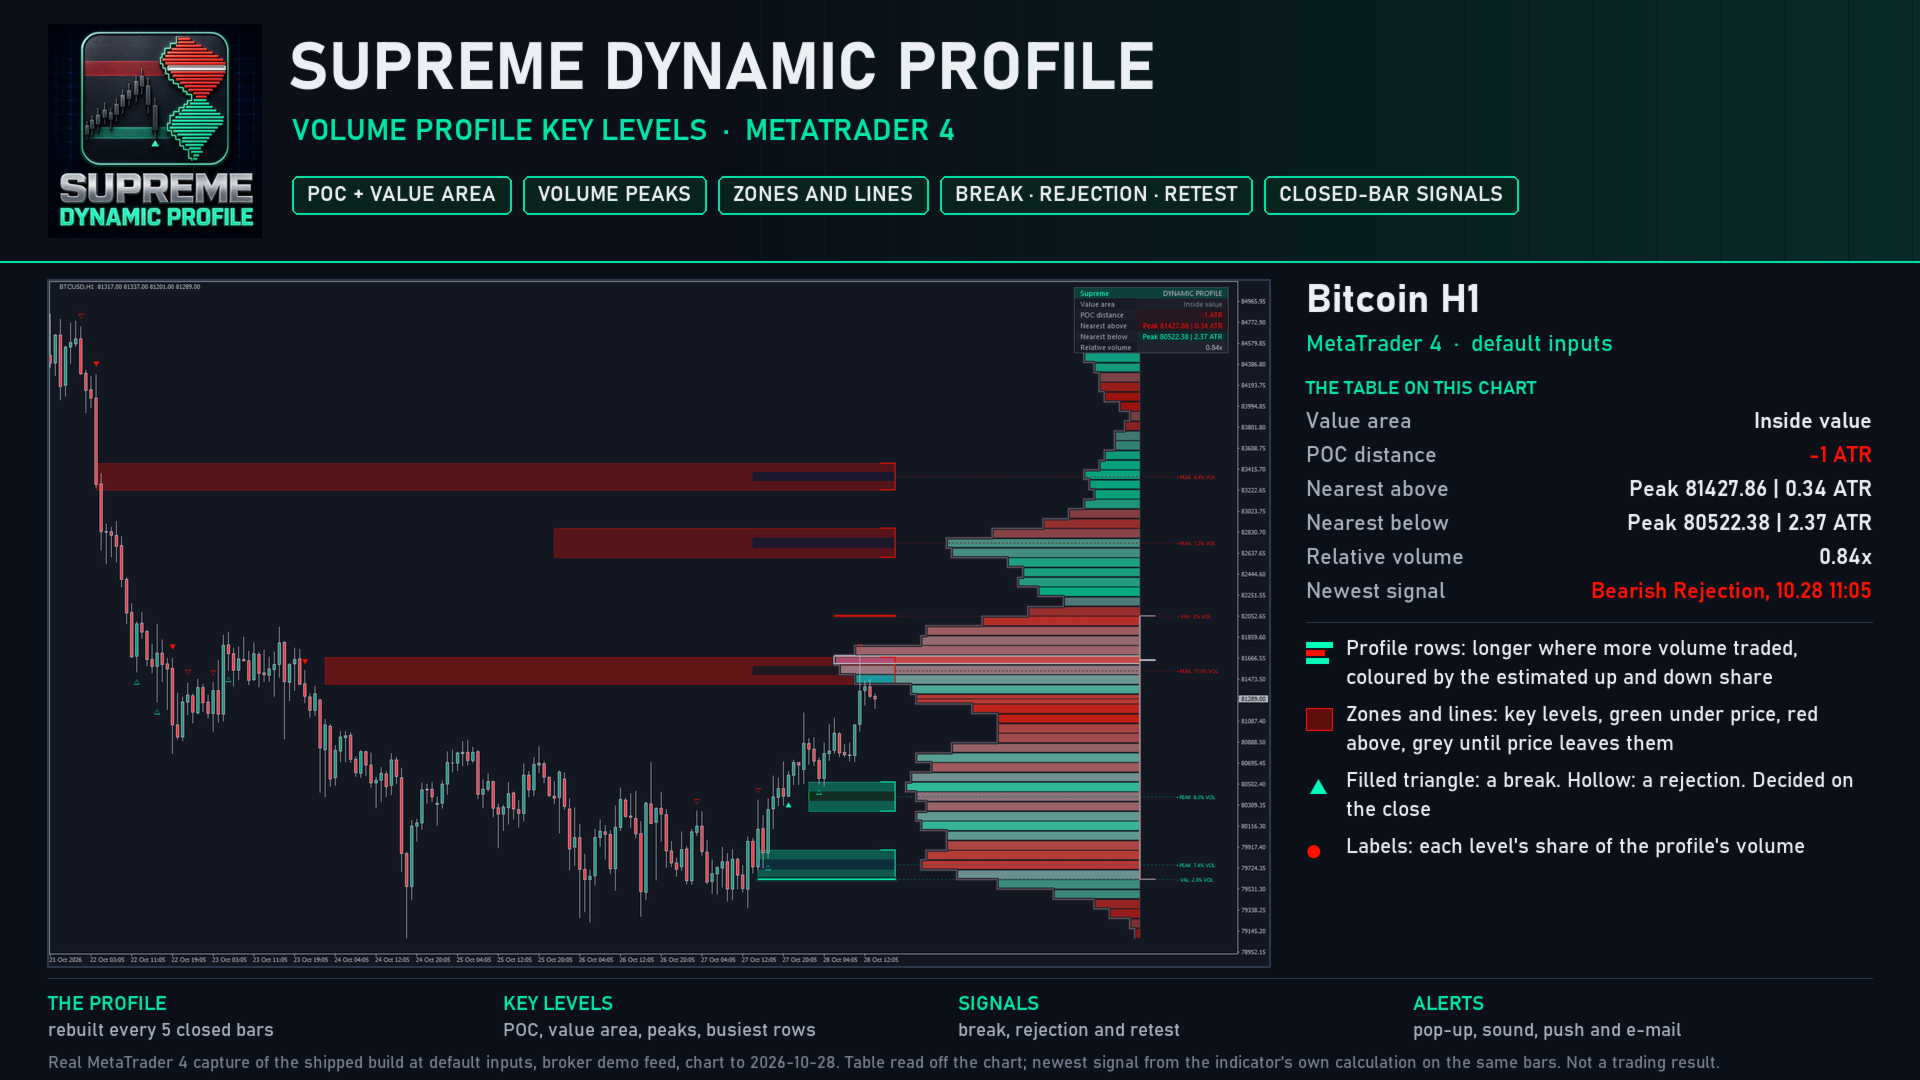
- One label per drawn level in a column beside the profile, nearest first: the level's name and its share of the profile's volume (up to 8 labels). The share describes the profile when the level was created; it is not a win probability.
- The table shows whether price is above, inside or below value, the distance to the POC in ATR, the nearest level above and below, and relative volume. The Detailed variant adds the profile's window and age, its volume and up and down split, the level counts and the last signal.
ALERTS
Nine conditions, each with its own switch: a new key level; a bullish and a bearish break, rejection and retest; any bullish signal and any bearish signal. Channels: pop-up window, sound, push notification and e-mail. Every alert is evaluated on a closed bar, fires once for that bar, and never fires for history or in the Strategy Tester. Example:
Bearish Key Level Break (Peak 1.11211) on EURUSD H1 @ 1.11150
WHAT IT DOES NOT DO
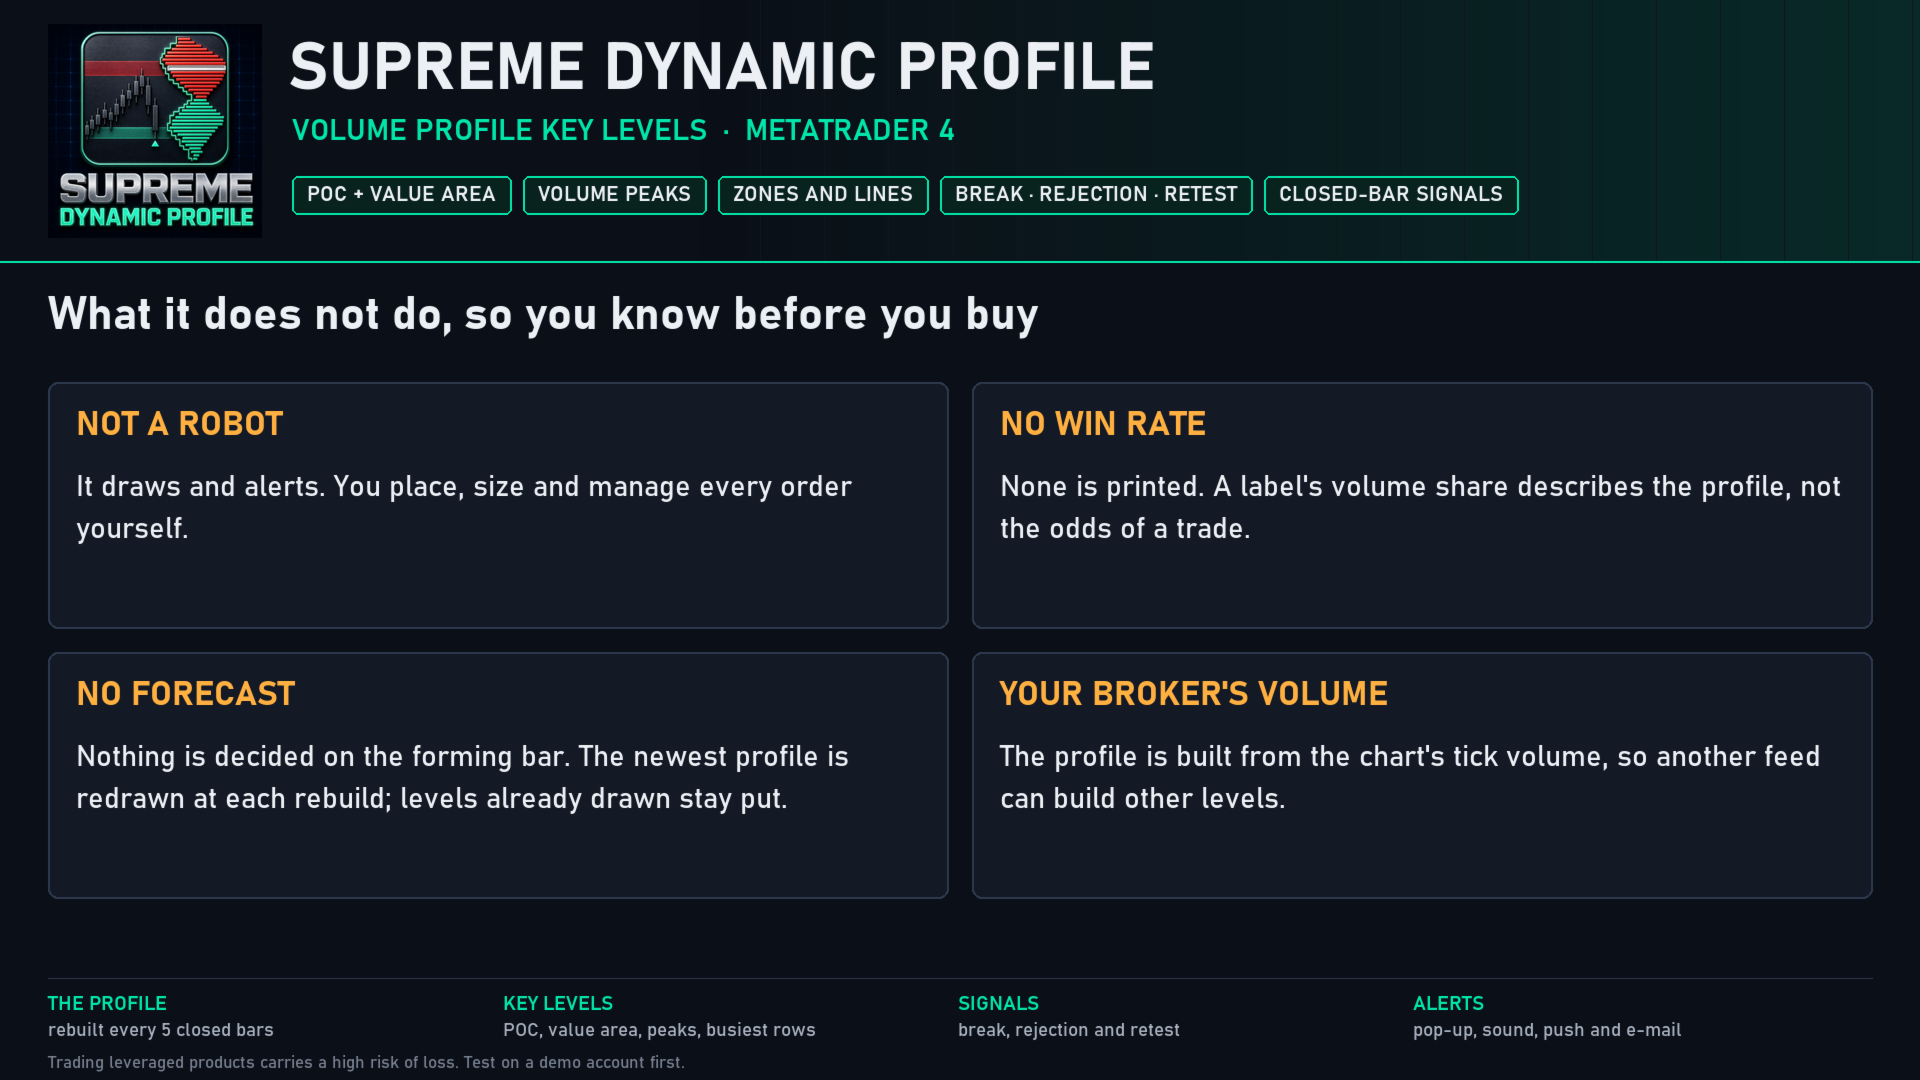
- It does not place trades. It draws and alerts; you place and manage every order.
- It does not print a win rate. Results depend on the market, the timeframe and how you manage the trade.
- It does not see the future. Nothing is decided on the forming bar, and in Dynamic mode a pivot is confirmed 35 bars after it forms. The newest profile is redrawn at each rebuild, by design; the levels already drawn stay where they were created.
SETTINGS AND NOTES
- 92 inputs in 13 groups, each explained in the manual. It runs on any symbol and timeframe from M1 to monthly.
- The profile is built from your broker's candles and tick volume, so another feed can build other levels.
- Bars to calculate (5,000 by default) keeps loading fast on long charts.
- The profile and its labels are pinned inside the chart while the newest bar is in view; one switch places them at their spot past the last bar instead.
- The chart keeps at most 500 boxes, 500 lines and 500 labels and removes the oldest first; switch "Keep chart object limits" off to keep everything.
Trading leveraged products carries a high level of risk and may not be suitable for all investors. Supreme Dynamic Profile is an analysis tool, not financial advice. Test it on a demo account first.