Standard Diviation

Indicator for manual trading.

How to use:

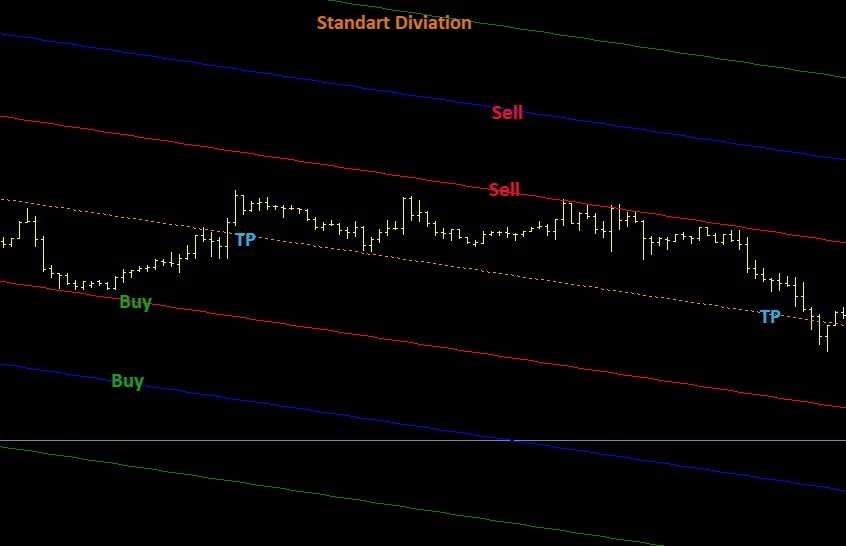
Open positions on STDV 1 or 2.

Take Profit is the centerline.

How it works:

The trading strategy is based on the statistic, which shows that almost 70% of the price movement is within the STDV 1

and 95% between STDV 2 and 99% between STDV 3.


The price swings around the midline, and when it reaches STDV 1, it has a 70% chance of going back to the midline.


추천 제품
Order Block Draw MTF
Jorge Delgado Segura
4 (1)
Just $30 for six months!!!. This will draw Order Blocks just by clicking on a candle with different colors for different timeframes. It will use the body or the wicks. It can also draw the mean threshold of the candle open/close or high/low. As a drawing tool, it is not active all the time after adding it to the chart. Activate by pressing 'b' twice on the keyboard within a second. If activated but then decided not to draw, deactivate by pressing 'b' once.  Box color depends if candle is abov
Email Drawdown Alert
Roman Starostin
5 (12)
Free informative Indicator-helper. It'll be usefull for traders who trade many symbols or using grid systems (Averaging or Martingale). Indicator counts drawdown as percent and currency separate. It has a number of settings: Count deposite drawdown according equity value and send e-mail or notifications to user if DD more than set; Sending e-mail when max open orders reached; Shows price and remaining pips amount before MarginCall on current chart and Account generally; Display summary trade lot
FREE
Cool iExposure
Zbynek Liska
5 (1)
If you need more information than a few numbers in the iExposure index, this indicator is for you. Better iExposure indicator is an improvement over the original information, such as: Separate profit column for BUY and SELL Separate SL column for BUY and SELL Separate TP column for BUY and SEL Average Price as Horizontal Line in Chart Pip Value www.foxwave.eu
SMC Venom Model BPR 지표는 Smart Money(SMC) 개념 내에서 일하는 트레이더를 위한 전문 도구입니다. 가격 차트에서 두 가지 주요 패턴을 자동으로 식별합니다. FVG (공정 가치 갭)는 3개의 캔들의 조합으로, 첫 번째와 세 번째 캔들 사이에 갭이 있습니다. 이는 볼륨 지원이 없는 레벨 사이에 구역을 형성하여 종종 가격 수정으로 이어집니다. BPR (균형 가격 범위)은 두 개의 FVG 패턴의 조합으로, "브리지"를 형성합니다. 이는 가격이 낮은 볼륨 활동으로 움직일 때 브레이크아웃과 레벨로의 복귀 구역으로, 캔들 사이에 갭을 생성합니다. 이러한 패턴은 거래자가 차트에서 거래량과 가격 역학을 분석하여 주요 지지/저항 수준, 돌파 구역 및 진입 지점을 식별하는 데 도움이 되며, 여기서 대형 시장 참여자와 일반 참여자 간의 상호 작용이 발생합니다. 이 지표는 사각형과 화살표 형태로 패턴을 시각화하며 유연한 경고 설정도 지원합니다. 주요 특징: 패턴 표시 모드:
FORCES VARIATION
Nacer Kessir
5 (2)
The most important thing in my system of forces, is the variation and changing of these forces. It is the key to the whole system, and from this point, my second indicator called FORCES-VARIATION appeares important. The indicator is represented in a separate window in the form of the green histogram and the red curve . The parameter NPIuPeriod represents the number of bars on which we calculate the variation of buyers forces. The parameter NPIdPeriod represents the number of bars on which we cal
RSI Converter
Dmitriy Moshnin
Relative Strength Index with advanced functionality recalculates (converts) the averaging period in accordance with the value of parameter Time Frame for lower chart time intervals (Multi-TimeFrame (MTF)). Unlike the standard indicator, RSI converter includes an alert system that notifies about changes in market situation, it consists of the following signals: Main line crosses levels of extreme zones (30%, 70%) and the level of 50%; The main line crosses one or two trendlines in the indicator w
Binary Option Signal
Yaroslav Varankin
Indicator for binary options arrow is easy to use and does not require configuration works on all currency pairs, cryptocurrencies buy signal blue up arrow sell signal red down arrow tips do not trade during news and 15-30 minutes before their release, as the market is too volatile and there is a lot of noise it is worth entering trades one or two candles from the current period (recommended for 1 candle) timeframe up to m 15 recommended money management fixed lot or fixed percentage of the depo
Euro Gift (EURUSD M15) I am celebrating my birthday, so i will publish some EAs for FREE. This EA has been developed for EURUSD M15.  Strategy is based on ICHIMOKU indicator and has very little parameters - so its VERY ROBUST. It uses Stop pending orders with   ATR   Stop Loss . At 9:00 pm we are closing trading every Friday to prevent from weekly gaps. !!!Adjust these times to your broker time. Preset values are for UTC+2 only!!! For every candle the pending orders are modified to adapt the mar
FREE
Rainbow MT4
Jamal El Alama
Rainbow MT4 is a technical indicator based on Moving average with period 34 and very easy to use. When price crosses above MA and MA changes color to green, it’s a signal to buy. When price crosses below MA and MA changes color to red, it’s a signal to sell. The Expert advisor ( Rainbow EA MT4) based on Rainbow MT4 indicator, as you can see in the short video below is now available here .
FREE
VR Cub
Vladimir Pastushak
VR Cub 은 고품질 진입점을 얻는 지표입니다. 이 지표는 수학적 계산을 용이하게 하고 포지션 진입점 검색을 단순화하기 위해 개발되었습니다. 지표가 작성된 거래 전략은 수년 동안 그 효율성을 입증해 왔습니다. 거래 전략의 단순성은 초보 거래자라도 성공적으로 거래할 수 있다는 큰 장점입니다. VR Cub은 포지션 개시 지점과 이익 실현 및 손절매 목표 수준을 계산하여 효율성과 사용 편의성을 크게 높입니다. 간단한 거래 규칙을 이해하려면 아래 전략을 사용한 거래 스크린샷을 살펴보세요. 설정, 세트 파일, 데모 버전, 지침, 문제 해결 등은 다음에서 얻을 수 있습니다. [블로그] 다음에서 리뷰를 읽거나 작성할 수 있습니다. [링크] 버전 [MetaTrader 5] 진입점 계산 규칙 포지션 개설 진입점을 계산하려면 VR Cub 도구를 마지막 최고점에서 마지막 최저점까지 늘려야 합니다. 첫 번째 지점이 두 번째 지점보다 빠른 경우, 거래자는 막대가 중간선 위에서 마감될 때까지 기다립니다
Smart FVG indicator MT4
Ahmad Kazbar
4.67 (3)
Smart FVG 인디케이터 MT4 – MetaTrader 4를 위한 고급 Fair Value Gap 탐지 Smart FVG 인디케이터 MT4는 MetaTrader 4 차트에서 Fair Value Gap(FVG)을 전문적으로 탐지하고, 모니터링하며, 알림까지 제공하는 도구입니다. ATR 기반 필터링과 시장 구조를 인식하는 로직을 결합하여 노이즈를 줄이고, 유동성 환경에 맞게 자동으로 적응하며, 매매 의사결정에 중요한 불균형 구간만 남겨 줍니다. 주요 장점 정확한 FVG 탐지: 단순한 캔들 갭이 아닌 실제 시장 비효율 구간을 식별합니다. ATR 기반 정밀도: 다양한 상품과 시간 프레임에서 저품질 신호를 걸러내는 적응형 민감도. 실시간 유효성 추적: 가격이 해당 구간을 메우거나 돌파하면 존이 자동으로 연장·조정·삭제됩니다. 사용자 정의 가능한 시각화: 색상, 선 스타일, 채우기 옵션을 템플릿에 맞게 자유롭게 설정 가능. 실질적인 알림: 새로 생성된 FVG, 메워진 FVG, 무효화된
FREE
The Arrow Scalper
Fawwaz Abdulmantaser Salim Albaker
1 (2)
Dear Friend..  I share with you this simple Expert Adviser .. it is full automatic  this Expert Adviser following the trend of the pair you install on or any stocks or indices , it is works like that: - when the trend on H4 chart show a start of up trend the expert will wait till the 15M & 1H charts show an up trend the EA will open a buy order directly , and do the same for down trend and open a sell order the buy or sell  order lot size and take profit and stop loss will measured manually  by
FREE
Ksm: Smart Solution for Automated Forex Trading Ksm is a tool designed for automating Forex trading, using modern methods of time-series data analysis to work with multiple currency pairs across different timeframes. Key Features and Benefits Multi-currency support : Ksm enables trading across multiple currency pairs, helping traders adapt their strategies to various market conditions. New currency pairs can be easily added. Time-series data analysis : Utilizing advanced algorithms, Ksm analyzes
The trading advisor trades with money management elements, both using the martingale system and using the anti-martingale system, at the user's choice. You can choose the type of money management system in external variables. (Usage options with money management according to Martin or AntiMartin) Opens starting positions on the RSI indicator, after exiting the position on the take profit, increases the lot by the AntiMartin coefficient, again we enter the market on the RSI indicator. With Marti
This EA is an extension for the free trade indicator Trend Mate . https://www.mql5.com/en/market/product/50082 The main idea is to support your decision to  trade  according to the current trend. It is possible to configure alert and push notification to receive when entering to first candle for bull / bear trend. For this extension of the free indicator now it is possible to filter the current trend info with other timeframes. For example show trend for timeframe M5 considering also timeframe
THE GRAFF III
Antonin Skaryd
The [GRAFF] III manual trading system is based on multiple MetaTrader (MT4) indicators. Together, the entire PACK of GRAFF III indicators makes an advanced trading tool. The system consists of over 20 different custom-built indicators which have been carefully selected and tested in the long term to produce strong and efficient trading signals. The particular indicators are based on different mathematical formulas, so the entire system is calibrated to remove false signals from its own indicator
GTAS STrend
Riviera Systems
4.5 (2)
GTAS S-Trend is a momentum indicator that helps to determine trends using combination of MACD, RSI and moving averages. This indicator was created by Bernard Prats Desclaux, proprietary trader and ex-hedge fund manager, founder of E-Winvest. Description The indicator oscillates between -65 and +65 with a neutral zone between -25 and +25 around a 0 equilibrium line. S-Trend between -25 and +25 indicates congestion zones with a bullish bias between 0 and +25, and a bearish bias between 0 and -25.
FREE
Double HMA lines MTF
Pavel Zamoshnikov
5 (1)
This is a multi-timeframe version of the popular Hull Moving Average (HMA). The Double HMA MTF Light indicator combines two timeframes on a single chart. The HMA of the higher timeframe defines the trend, and the HMA of the current timeframe defines short-term price movements. The indicator is freely distributed and hasn't audio signals or messages. Its main function is the visualization of price movements. If you need advanced functionality of the HMA multi-timeframe indicator (information ab
FREE
TWO PAIRS SQUARE HEDGE METER INDICATOR Try this brilliant 2 pairs square indicator It draws a square wave of the relation between your two inputs symbols when square wave indicates -1 then it is very great opportunity to SELL pair1 and BUY Pair2 when square wave indicates +1 then it is very great opportunity to BUY pair1 and SELL Pair2 the inputs are : 2 pairs of symbols         then index value : i use 20 for M30 charts ( you can try other values : 40/50 for M15 , : 30 for M30 , : 10 for H1 ,
EARLY REMINDER: The Starting price is 65 price will rise soon up to 365$ and then 750$ after first 10 copies of sales. Grab this offer now! Introduction Hello, traders! Welcome to the demonstration of the Forex Beast Indicator , a comprehensive tool designed to assist aspiring traders in navigating the complexities of the forex market. This indicator incorporates seven essential components to provide a well-rounded trading experience: Moving Averages Colored Zones Support and Resistance Levels
FX-Support Presents the Trading Panel for MT4 The Trading Panel for MT4 is a powerful and versatile tool designed to assist traders in their daily trading activities. It helps traders open positions and identify market signals, such as ENG and STAR patterns. The panel simplifies decision-making and supports efficient trading. Key Features: Automatic Lot Size Calculation Calculates lot sizes accurately, considering market conditions and currency conversions for effective risk management. Accura
Pin Bars
Yury Emeliyanov
5 (4)
주요 목적:"핀 바"는 금융 시장 차트에서 핀 바를 자동으로 감지하도록 설계되었습니다. 핀 바는 특징적인 몸체와 긴 꼬리를 가진 촛불로,추세 반전 또는 교정을 신호 할 수 있습니다. 작동 원리:표시기는 차트의 각 촛불을 분석하여 촛불의 몸,꼬리 및 코의 크기를 결정합니다. 미리 정의 된 매개 변수에 해당하는 핀 막대가 감지되면 표시기는 핀 막대의 방향(강세 또는 약세)에 따라 위 또는 아래 화살표로 차트에 표시합니다. 매개 변수: 꼬리의 길이와 핀 바의 몸체 크기 사이의 최소 비율을 정의합니다. "코"와 핀 바의 꼬리 사이의 최대 허용 비율을 설정합니다. 화살표 크기-표시된 핀 막대와 차트에서 핀 막대를 가리키는 화살표 사이의 거리를 정의합니다. 신청:"핀 바"표시기는 잠재적 인 추세 반전 지점을 식별하고 시장 또는 가까운 위치에 진입하기 위해 신호를 생성하는 데 사용할 수 있습니다. 올바르게 사용하고 다른 기술 지표 및 분석 방법과 결합하면이 지표는 거래 결과를 향상시킬 수
FREE
The new update makes this indicator a complete tool for studying, analyzing and operating probabilistic patterns. It includes: On-chart Multi-asset percentage monitor. Configurable martingales. Twenty-one pre-configured patterns , including Mhi patterns and C3. An advanced pattern editor to store up to 5 custom patterns. Backtest mode to test results with loss reports. Trend filter. Hit operational filter. Martingale Cycles option. Various types of strategies and alerts. Confluence between patte
MACD Color for GOLD
Chitipat Changsamrit
MACD Color for GOLD  Use for looking moving-way of graph and checking will be buy or sell  Easy for looking by see the color of trand. Red is down / Blue is up.  Can to use it with every time-frame by 1. Long Trade : Use it with time-frame H1 /  H4 /  Daily  2.Short Trade : Use it with  time-frame  M5 / M15  / M 30 /  H1 and you can see when you will open or close the orders by see this indicator by well by see signal line cut with color line again in opposite. and you can use this indicator for
숫자 시퀀스 중 하나를 "산불 시퀀스"라고 합니다. 가장 아름다운 새로운 시퀀스 중 하나로 인식되었습니다. 주요 특징은 이 시퀀스가 ​​가장 짧은 경우에도 선형 추세를 피한다는 것입니다. 이 지표의 기초를 형성한 것은 이 속성입니다. 금융 시계열을 분석할 때 이 지표는 가능한 모든 추세 옵션을 거부하려고 합니다. 그리고 그가 실패하는 경우에만 그는 추세의 존재를 인식하고 적절한 신호를 제공합니다. 이 접근 방식을 통해 새로운 트렌드가 시작되는 순간을 정확하게 결정할 수 있습니다. 그러나 거짓 긍정도 가능합니다. 숫자를 줄이기 위해 이 표시기에 추가 필터가 추가되었습니다. 새 막대가 열리면 신호가 생성됩니다. 어떤 경우에도 다시 그리기가 발생하지 않습니다. 표시 매개변수: Applied Price - 적용된 가격 상수. Period Main - 표시기의 기본 기간, 유효한 값은 5 - 60 이내입니다. Period Additional - 추가 기간, 이 매개변수의 유효한 값은 5 -
Awesome Oscillator by Bill Williams with the ability to fine-tune and replace the averaging algorithms of the indicator, which significantly expands the possibilities of using this oscillator in algorithmic trading and brings it closer in its properties to such an indicator as the MACD. To reduce price noise, the final indicator is processed with an additional Smooth averaging. The indicator has the ability to give alerts, send mail messages and push signals when the direction of movement of th
Candle Pattern Finder Candle Pattern Finder is a powerful MT4 indicator designed to help traders easily detect key candlestick patterns in real-time. Whether you're trading trends, reversals, or consolidations, this tool highlights important price action signals directly on the chart — helping you make faster and more confident trading decisions. Detects popular candlestick patterns: Bullish/Bearish Engulfing Hammer & Inverted Hammer Shooting Star & Hanging Man Three White Soldiers Three Black
FREE
Nirvana prop controler MT4
Aiireza Arjmandi Nezhad
전문 트레이더와 평가형 계정(Prop)을 위한 위험 관리 및 한도 모니터링 지표 이 도구는 위험 관리와 한도에 관한 정보를 차트에 표시만 하여, 더 집중해서 의사결정을 내리도록 돕습니다. 인디케이터는 포지션을 열거나/닫거나/변경하지 않으며, 익스퍼트 어드바이저(EA)와도 충돌하지 않습니다. 기능 일일 및 총 드로우다운 모니터링 잔고(Balance) 또는 에쿼티(Equity)를 기준으로 일일/총 드로우다운을 계산·표시합니다(설정 가능). 설정된 한도까지 남은 비율을 표시합니다. 차트 내 깔끔하고 전문적인 패널 요약 표: Balance, Equity, 현재 P/L, 일일/총 DD, 경고 임계값. 의사결정에 집중할 수 있도록 간결하고 가독성 높은 UI. 위험 기반 포지션 사이징 퍼센트/고정 금액 리스크와 선택한 손절폭(SL)에 따라 대략적인 거래량을 산출. 위험대비보상비(R:R)와 진입, SL, TP 레벨을 차트에 표시. 경고와 알림 일일/총 DD 임계값에 근접 시 경고(임계값 퍼센트
MA Alignment Scanner
Benedict Jamora
5 (1)
This indicator scans and displays currency pairs that have recently aligned moving averages on a given timeframe. You can configure which pairs the indicator will scan. It also includes all types of alert options. Bullish MA Alignment =  MA1>MA2>MA3>MA4>MA5 Bearish MA Alignment =  MA1<MA2<MA3<MA4<MA5 Features Attach to one chart and scans all the currency pairs configured and visible in the Market Watch Window It can monitor all the available timeframes from M1 to MN1 and sends alerts on every
PZ Harmonacci Patterns
PZ TRADING SLU
3.17 (6)
Trade smarter, not harder: Empower your trading with Harmonacci Patterns This is arguably the most complete harmonic price formation auto-recognition indicator you can find for the MetaTrader Platform. It detects 19 different patterns, takes fibonacci projections as seriously as you do, displays the Potential Reversal Zone (PRZ) and finds suitable stop-loss and take-profit levels. [ Installation Guide | Update Guide | Troubleshooting | FAQ | All Products  ] It detects 19 different harmonic pric
이 제품의 구매자들이 또한 구매함
Gann Made Easy
Oleg Rodin
4.83 (162)
Gann Made Easy 는 mr.의 이론을 사용하여 최고의 거래 원칙을 기반으로 하는 전문적이고 사용하기 쉬운 Forex 거래 시스템입니다. W.D. 간. 이 표시기는 Stop Loss 및 Take Profit Levels를 포함하여 정확한 BUY 및 SELL 신호를 제공합니다. PUSH 알림을 사용하여 이동 중에도 거래할 수 있습니다. 구매 후 거래 방법 안내 및 유용한 추가 지표를 무료로 받으시려면 저에게 연락주세요! 아마도 Gann 거래 방법에 대해 이미 여러 번 들었을 것입니다. 일반적으로 Gann의 이론은 초보자 거래자뿐만 아니라 이미 거래 경험이 있는 사람들에게도 매우 복잡한 것입니다. Gann의 거래 방식은 이론적으로 적용하기 쉽지 않기 때문입니다. 나는 그 지식을 연마하고 Forex 지표에 최고의 원칙을 적용하기 위해 몇 년을 보냈습니다. 표시기는 적용하기가 매우 쉽습니다. 차트에 첨부하고 간단한 거래 권장 사항을 따르기만 하면 됩니다. 지표는 지속적으로 시장 분석
Scalper Inside PRO
Alexey Minkov
4.74 (69)
Scalper Inside PRO – Since 2020. An exclusive indicator that utilizes an innovative algorithm to swiftly and accurately determine the market trend. The indicator automatically calculates opening, closing, and profit levels, providing detailed trading statistics. With these features, you can choose the most appropriate trading instrument for the current market conditions. Additionally, you can easily integrate your own arrow indicators into Scalper Inside Pro to quickly evaluate their statistics
M1 Sniper
Oleg Rodin
5 (22)
M1 SNIPER 는 사용하기 쉬운 거래 지표 시스템입니다. M1 시간대에 맞춰 설계된 화살표 지표입니다. 이 지표는 M1 시간대 스캘핑을 위한 단독 시스템으로 사용할 수 있으며, 기존 거래 시스템의 일부로도 사용할 수 있습니다. 이 거래 시스템은 M1 시간대 거래용으로 특별히 설계되었지만, 다른 시간대에도 사용할 수 있습니다. 원래는 XAUUSD와 BTCUSD 거래를 위해 이 방법을 설계했지만, 다른 시장 거래에도 유용하다는 것을 알게 되었습니다. 이 지표의 신호는 추세 방향과 반대로 거래될 수 있습니다. 저는 지표의 신호를 활용하여 양방향으로 거래할 수 있도록 돕는 특별한 거래 기법을 알려드립니다. 이 방법은 특별한 동적 지지선과 저항선 가격 영역을 활용하는 것을 기반으로 합니다. 구매하시면 M1 SNIPER 화살표 지표를 바로 다운로드하실 수 있습니다. 또한, 아래 스크린샷에 표시된 Apollo Dynamic SR 지표는 M1 SNIPER 도구를 사용하는 모든 사용자에게 무료로
KuKl
IGOR KIRIANEN
The indicator is built on a non-standard Zig Zag, it draws accumulations after which if the price leaves this zone and a test of this zone occurs, then a sound signal is given and an arrow appears - after the test candle closes.The indicator does not redraw its signals, it is very easy to use, there are only three settings 1- this is the zig zag parameter 2- this is the minimum price exit from the zone 3- this is the maximum price exit from the zone. The lower the parameter for Zig Zag, the more
PRO Renko System
Oleg Rodin
5 (30)
PRO Renko System 은 RENKO 차트 거래를 위해 특별히 고안된 매우 정확한 거래 시스템입니다. 이것은 다양한 거래 상품에 적용될 수있는 보편적 인 시스템입니다. 체계는 효과적으로 당신에게 정확한 반전 신호에 접근을 주는 소위 시장 소음을 중화합니다. 이 표시기는 사용하기가 매우 쉽고 신호 생성을 담당하는 매개 변수가 하나만 있습니다. 당신은 쉽게 당신의 선택의 어떤 무역 계기에 공구를 적응시킬 수 있고 renko 막대기의 크기. 나는 항상 당신이 내 소프트웨어로 수익성있게 거래 할 수 있도록 추가 지원을 제공 할 준비가되어 있습니다! 나는 당신에게 행복하고 수익성있는 거래를 기원합니다! 구매 후 저에게 연락하십시오! 내 렌코 차트 생성기를 보내드립니다. 또한 내 개인 권장 사항 및 시스템의 다른 모듈을 무료로 공유 할 것입니다!
Auto Optimized Parabolic RSI: 고급 3D 모멘텀 엔진 대부분의 개인 투자자용 보조지표는 시장의 변동성이 변하는 순간 무용지물이 되는 정적인 입력값에 의존하기 때문에 실패합니다. Auto Optimized Parabolic RSI는 자체적인 수학적 우위를 지속적으로 재계산하여 "보조지표 노후화" 문제를 해결하며, 기관급 퀀트 트레이딩의 적응력을 귀하의 MT5 터미널에 직접 제공합니다. 핵심 이점: 맞춤형 인메모리 3D 최적화   표준 자동 최적화 도구들은 일반적인 보조지표 호출로 터미널에 과부하를 일으켜 MT5 플랫폼을 멈추게 하는 경우가 많습니다. 이 도구는 이러한 병목 현상을 완전히 우회합니다. 맞춤형 네이티브 RAM 기반 계산기로 구축된 내부 엔진은 차트를 로드하거나 타임프레임을 변경할 때마다 빛처럼 빠른 3D 그리드 검색을 실행합니다. RSI 기간(주기), SAR 스텝(가속도) 및 SAR 최대치(속도 제한)를 동시에 스캔하여 플랫폼 지연 없이 수만 개의
Market Makers
Mohamed Hassan
5 (4)
After purchase, contact me privately to receive 1 month of free testing with EA Forex Proton! This advanced MT4 trading robot automatically executes signals from any MT4 indicator, including Market Makers. The latest version also includes AI integration, allowing each trade signal to be analyzed using Artificial Intelligence. Live Signal with EA Forex Proton: Click here Market Makers is a powerful price action trading system designed to identify high-probability Buy and Sell opportunities based
Quantum Breakout Indicator PRO
Bogdan Ion Puscasu
4.96 (26)
소개       Quantum Breakout PRO   , 브레이크아웃 존 거래 방식을 변화시키는 획기적인 MQL5 지표! 13년 이상의 거래 경험을 가진 숙련된 트레이더 팀이 개발한   Quantum Breakout PRO는   혁신적이고 역동적인 브레이크아웃 영역 전략으로 거래 여정을 새로운 차원으로 끌어올리도록 설계되었습니다. Quantum Breakout Indicator는 5개의 이익 목표 영역이 있는 브레이크아웃 영역의 신호 화살표와 브레이크아웃 상자를 기반으로 한 손절 제안을 제공합니다. 초보자 거래자와 전문 거래자 모두에게 적합합니다. Quantum EA 채널:       여기를 클릭하세요 MT5 버전 :   여기를 클릭하세요 중요한! 구매 후 설치 매뉴얼을 받으려면 개인 메시지를 보내주십시오. 추천: 기간: M15 통화쌍: GBPJPY, EURJPY, USDJPY,NZDUSD, XAUUSD 계정 유형: 스프레드가 매우 낮은 ECN, Raw 또는 Razo
Atomic Analyst
Issam Kassas
5 (5)
우선적으로 언급할 점은이 거래 지표가 다시 그리지 않고 지연되지 않으며 이를 통해 수동 및 로봇 거래 모두에 이상적이라는 점입니다. 사용자 매뉴얼: 설정, 입력 및 전략. Atomic Analyst는 가격의 강도와 모멘텀을 활용하여 시장에서 더 나은 이점을 찾는 PA Price Action Indicator입니다. 고급 필터를 장착하여 잡음과 거짓 신호를 제거하고 거래 잠재력을 높이는 데 도움이 됩니다. 복잡한 지표의 다중 레이어를 사용하여 Atomic Analyst는 차트를 스캔하고 복잡한 수학적 계산을 간단한 신호와 색상으로 변환하여 초보 트레이더가 이해하고 일관된 거래 결정을 내릴 수 있도록합니다. "Atomic Analyst"는 새로운 및 경험이 풍부한 트레이더를위한 종합적인 거래 솔루션입니다. 프리미엄 지표와 최고 수준의 기능을 하나의 거래 전략에 결합하여 모든 종류의 트레이더에 대한 다재다능한 선택지가되었습니다. 인트라데이 거래 및 스캘핑 전략 : 빠르고 정확한 일일
Advanced Supply Demand
Bernhard Schweigert
4.91 (300)
현재 40% 할인! 초보자나 전문 트레이더를 위한 최고의 솔루션! 이 보조지표는 우리가 다수의 독창적 기능과 새로운 공식을 통합한 독특하고 고품질이며 저렴한 거래 도구입니다. 이 업데이트를 통해 이중 시간대를 표시할 수 있습니다. 더 높은 TF를 표시할 수 있을 뿐만 아니라 차트 TF와 더 높은 TF 모두를 표시할 수 있습니다: 중첩 영역 표시. 모든 Supply Demand 트레이더들이 좋아할 것입니다. :) 중요한 정보 공개 Advanced Supply Demand의 잠재력을 극대화하려면 다음을 방문하십시오. https://www.mql5.com/ko/blogs/post/720245   진입 또는 목표의 명확한 트리거 포인트를 정확히 찾아냄으로 해서 거래가 어떻게 개선될지 상상해 보십시오. 새로운 알고리즘을 기반으로 매수자와 매도자 간의 잠재적인 불균형을 훨씬 더 쉽게 분간할 수 있습니다. 왜냐하면 가장 강한 공급영역과 가장 강한 수요 영역과 과거에 어떻게 진행 되었는지를(이전
GoldRush Trend Arrow Signal
Kirk Lee Holloway
5 (2)
GoldRush 트렌드 화살표 신호 GoldRush 트렌드 화살표 신호 지표는 XAU/USD 시장에서 고속 단기 스캘핑 트레이더를 위해 설계된 정밀한 실시간 트렌드 분석을 제공합니다. 1분 시간대에 특화되어 설계된 이 도구는 명확한 진입점을 표시하는 방향성 화살표를 제공하여 스캘퍼들이 변동성이 높은 시장 환경에서도 자신 있게 거래할 수 있도록 합니다. 이 지표는 PRIMARY 및 SECONDARY 경고 화살표로 구성됩니다. PRIMARY 신호는 추세 방향의 변화를 나타내는 흰색과 검은색 방향성 화살표이며, SECONDARY 신호는 PRIMARY 화살표가 지시하는 방향을 확인하고 잠재적인 거래 진입점을 표시하는 파란색과 빨간색 화살표입니다. 참고: 추세 방향이 변경된 후 PRIMARY 경고 화살표가 단 하나만 표시될 경우, 다수의 SECONDARY 파란색/빨간색 화살표가 표시될 수 있음을 유의해야 합니다. SECONDARY 신호는 신호 기준을 충족하는 어떤 캔들 이후에도 표시
Apex Edge No Repaint MT4용 전문가용 리페인팅 없는 트레이딩 지표 Apex Edge No Repaint는 화살표 리페인팅 현상 없이 명확한 신호를 원하는 진지한 외환 및 암호화폐 트레이더를 위해 설계된 프리미엄급의 깔끔하고 신뢰할 수 있는 트레이딩 도구입니다. 주요 기능: 100% 리페인트 없음 – 신호는 차트에 나타난 후 고정됩니다. 듀얼 신호 시스템: 초기 기회를 위한 RAW 신호와 높은 확률의 확정 진입을 위한 CONF 신호 간편한 원클릭 토글 버튼: RAW 켜기/끄기 및 CONF 켜기/끄기 추세, 강도 백분율 및 신호 상태를 표시하는 전문적인 실시간 대시보드 즉시 알림: 팝업, 소리 및 이메일 알림 모든 CONF 신호에 TP1, TP2 및 손절매 레벨 자동 표시 즉시 시각적 명확성을 위한 깔끔한 색상 코드 화살표: 연두색 → CONF 매수 빨간색 → CONF 매도 청록색 → RAW 매수 자홍색 → RAW 매도 모든 시간대 및 모든 종목에서 작동 장점:
RFI levels PRO
Roman Podpora
5 (1)
이 지표는 추세 반전 지점과 가격 반등 영역을 정확하게 보여줍니다.       주요 투자자들   . 새로운 트렌드가 형성되는 곳을 파악하고 최대한 정확하게 의사결정을 내리며 모든 거래를 완벽하게 통제합니다. TREND LINES PRO   지표와 함께 사용할 때 최대의 잠재력을 발휘합니다.  VERSION MT5 지표가 보여주는 내용: 새로운 추세의 시작 시 활성화되는 반전 구조 및 반전 수준. 최소한의 위험 대비 수익률을 갖는 이익 실현   (TAKE PROFIT)   및   손절매(STOP LOSS)   레벨 표시       RR 1:2   . 지능형 손실 감소 로직이 적용된 손절매 기능. 지정된 지표에서 두 가지 추세 유형에 대한 반전 패턴을 표시합니다. 지표: 트렌드를 따라   트렌드 라인 프로   (글로벌 트렌드 변화) 트렌드 프로   (빠른 트렌드 변화) 간단하고 효과적입니다       스캐너       실시간 추세 (신규). 다중 시간 프레임 도구 필터링. 표시하다  
이 인디케이터는 엘리어트 파동 이론과 두 가지 방식으로 작동합니다: 자동 작동: 이 모드에서는 인디케이터가 엘리어트 파동 이론에 따라 차트 상의 모든 5개의 모티브 웨이브를 자동으로 감지하고 예측 및 잠재적인 반전 지역을 제공합니다. 또한 중요한 개발 사항을 트레이더에게 알릴 수 있는 경보 및 푸시 메시지를 생성할 수 있는 능력을 갖추고 있습니다. 이 자동 기능은 엘리어트 파동 패턴의 식별과 분석 프로세스를 간소화합니다. 수동 작동: 이 옵션은 엘리어트 파동 이론을 수동으로 다루고 싶은 트레이더를 위해 설계되었습니다. 이를 통해 사용자는 아홉 가지 다른 등급을 사용하여 웨이브를 그릴 수 있습니다. 각 등급은 나타난 후에 차트에 그려진 라인을 조정하여 개별적으로 정의할 수 있습니다. 이 기능은 웨이브를 수동으로 그리는 프로세스를 간소화하며 더 효율적으로 만들어 줍니다. 중요한 점으로 모든 그림 데이터가 미래 참조를 위해 플랫폼 데이터 폴더에 저장된다는 것을 기억해야 합니다. 파라미터:
Please send me Direct message on MQL5 CHAT after purchasing the Indicator for Training and Installation Support There are some additional files that is important to use with the Indicator . So be sure to contact me after purchasing the Indicator So that I can add you for training and support . If you find any difficulty with installation then send me Direct message here So that I can connect with you via Anydesk or Teamview for the product installation. " Smart Order Block Indicator " to find m
이 지표를 구매하면 제 프로페셔널 트레이드 매니저를 무료로 드립니다. 우선 이 거래 시스템이 리페인팅, 리드로잉 및 레이그 인디케이터가 아니라는 점을 강조하는 것이 중요합니다. 이는 수동 및 로봇 거래 모두에 이상적인 것으로 만듭니다. 온라인 강좌, 설명서 및 프리셋 다운로드. "스마트 트렌드 트레이딩 시스템 MT5"은 새로운 및 경험이 풍부한 트레이더를 위해 맞춤형으로 제작된 종합적인 거래 솔루션입니다. 10개 이상의 프리미엄 인디케이터를 결합하고 7개 이상의 견고한 거래 전략을 특징으로 하여 다양한 시장 조건에 대한 다목적 선택이 가능합니다. 트렌드 추종 전략: 효과적인 트렌드 추이를 타기 위한 정확한 진입 및 손절 관리를 제공합니다. 반전 전략: 잠재적인 트렌드 반전을 식별하여 트레이더가 범위 시장을 활용할 수 있게 합니다. 스캘핑 전략: 빠르고 정확한 데이 트레이딩 및 단기 거래를 위해 설계되었습니다. 안정성: 모든 인디케이터가 리페인팅, 리드로잉 및 레이그가 아니므로 신뢰
Advanced Currency IMPULSE with ALERT
Bernhard Schweigert
4.9 (490)
현재 40% 할인!! 초보자 또는 전문가 트레이더를 위한 최고의 솔루션! 이 지표는 우리가 독점 기능과 비밀 공식을 통합했기 때문에 독특하고 고품질이며 저렴한 거래 도구입니다. 단 하나의 차트로 28개 통화 쌍 모두에 대한 경고를 제공합니다. 새로운 추세 또는 스캘핑 기회의 정확한 트리거 포인트를 정확히 찾아낼 수 있기 때문에 거래가 어떻게 개선될지 상상해 보십시오! 새로운 기본 알고리즘을 기반으로 구축되어 잠재적인 거래를 훨씬 더 쉽게 식별하고 확인할 수 있습니다. 이는 통화의 강세 또는 약세가 가속되는지 여부를 그래픽으로 표시하고 가속 속도를 측정하기 때문입니다. 자동차의 속도계처럼 생각하면 됩니다. 가속화할 때 Forex 시장에서 동일한 일이 분명히 더 빠르게 발생합니다. 즉, 반대 방향으로 가속화되는 통화를 페어링하면 잠재적으로 수익성 있는 거래를 식별한 것입니다. 통화 모멘텀의 수직선과 화살표가 거래를 안내합니다! 역동적인 Market Fibonacci 23 레벨은
Dynamic Scalper System
Vitalyi Belyh
5 (1)
" Dynamic Scalper System " 지표는 추세 파동 내에서 스캘핑 방식으로 거래하도록 설계되었습니다. 주요 통화쌍 및 금에서 테스트되었으며, 다른 거래 상품과의 호환성이 가능합니다. 추가적인 가격 변동 지원을 통해 추세에 따라 단기 포지션 진입 신호를 제공합니다. 지표의 원리 큰 화살표는 추세 방향을 결정합니다. 작은 화살표 형태의 스캘핑 신호를 생성하는 알고리즘은 추세 파동 내에서 작동합니다. 빨간색 화살표는 상승 방향을, 파란색 화살표는 하락 방향을 나타냅니다. 민감한 가격 변동선은 추세 방향으로 그려지며, 작은 화살표의 신호와 함께 작용합니다. 신호는 다음과 같이 작동합니다. 적절한 시점에 선이 나타나면 진입 신호가 형성되고, 선이 있는 동안 미결제 포지션을 유지하며, 완료되면 거래를 종료합니다. 권장되는 작업 시간대는 M1~H4입니다. 화살표는 현재 캔들에 형성되며, 다음 캔들이 이미 시작되었더라도 이전 캔들의 화살표는 다시 그려지지 않습니다. 입력 매개
PZ Trend Trading
PZ TRADING SLU
4.8 (5)
Capture every opportunity: your go-to indicator for profitable trend trading Trend Trading is an indicator designed to profit as much as possible from trends taking place in the market, by timing pullbacks and breakouts. It finds trading opportunities by analyzing what the price is doing during established trends. [ Installation Guide | Update Guide | Troubleshooting | FAQ | All Products ] Trade financial markets with confidence and efficiency Profit from established trends without getting whips
GOLD Impulse with Alert
Bernhard Schweigert
4.67 (12)
이 지표는 Advanced Currency IMPULSE with ALERT  +   Currency Strength Exotics  의 2가지 제품의 슈퍼 조합입니다. 그것은 모든 시간 프레임에 대해 작동하며 8개의 주요 통화와 하나의 기호에 대한 강약의 충동을 그래픽으로 보여줍니다! 이 표시기는 금, 이국적인 쌍, 상품, 지수 또는 선물과 같은 기호에 대한 통화 강도 가속을 표시하는 데 특화되어 있습니다. 금, 은, 오일, DAX, US30, MXN, TRY, CNH 등의 진정한 통화 강도 가속(충동 또는 속도)을 표시하기 위해 9번째 줄에 모든 기호를 추가할 수 있습니다. 새로운 기본 알고리즘을 기반으로 구축되어 잠재적인 거래를 훨씬 더 쉽게 식별하고 확인할 수 있습니다. 이는 통화의 강세 또는 약세가 가속되는지 여부를 그래픽으로 표시하고 가속 속도를 측정하기 때문입니다. 자동차의 속도계처럼 생각하면 됩니다. 가속화할 때 Forex 시장에서 동일한 일이 분명히 더 빠르
PZ Support Resistance
PZ TRADING SLU
3.33 (3)
Unlock key market insights with automated support and resistance lines Tired of plotting support and resistance lines? This is a multi-timeframe indicator that detects and plots supports and resistance lines in the chart with the same precision as a human eye would. As price levels are tested over time and its importance increases, the lines become thicker and darker, making price leves easy to glance and evaluate. [ Installation Guide | Update Guide | Troubleshooting | FAQ | All Products ] Boos
Trend Screener
STE S.S.COMPANY
4.79 (95)
트렌드 표시기, 트렌드 트레이딩 및 필터링을 위한 획기적인 고유 솔루션, 하나의 도구 안에 내장된 모든 중요한 트렌드 기능! Forex, 상품, 암호 화폐, 지수 및 주식과 같은 모든 기호/도구에 사용할 수 있는 100% 다시 칠하지 않는 다중 시간 프레임 및 다중 통화 표시기입니다. 기간 한정 특가: 지원 및 저항 스크리너 지표는 단 250 달러에 평생 제공됩니다. (원래 가격 65 달러) (제안 연장) Trend Screener는 차트에 점이 있는 화살표 추세 신호를 제공하는 효율적인 지표 추세 추종 지표입니다. 추세 분석기 표시기에서 사용할 수 있는 기능: 1. 트렌드 스캐너. 2. 최대 이익 분석이 있는 추세선. 3. 추세 통화 강도 측정기. 4. 경고가 있는 추세 반전 점. 5. 경고가 있는 강력한 추세 점. 6. 추세 화살표 Trend Screener Indicator가 있는 일일 분석 예, 일일 신호 성능...등은 여기에서 찾을 수 있습니다.   여기를 클릭하십시오.
Super Signal – Skyblade Edition 전문가용 노리페인트 / 노래그 트렌드 신호 시스템, 뛰어난 승률 제공 | MT4 / MT5용 1분, 5분, 15분과 같은 낮은 타임프레임에서 가장 좋은 성능을 보입니다. 핵심 기능: Super Signal – Skyblade Edition은 추세 매매를 위해 설계된 스마트 신호 시스템입니다. 이 시스템은 다중 필터 로직을 활용하여, 명확한 방향성과 실질적인 모멘텀이 수반된 고품질 추세만을 감지합니다. 이 시스템은 고점 또는 저점을 예측하지 않으며 , 다음 세 가지 조건이 모두 충족될 때만 신호를 발생시킵니다: 명확한 추세 방향 강화되는 모멘텀 건전한 변동성 구조 또한, 시장 세션 기반의 유동성 분석을 통해 신호의 신뢰성과 타이밍을 더욱 향상시킵니다. 신호 특성: 모든 화살표 신호는 100% 리페인트 없음 / 지연 없음 신호가 한 번 발생하면 고정되며, 깜빡이거나 사라지지 않음 차트 상의 시각적 화살표, 정보 패널, 팝업 알
Advanced Currency Strength28 Indicator
Bernhard Schweigert
4.91 (657)
현재 40% 할인 초보자 또는 전문가 트레이더를 위한 최고의 솔루션! 이 지표는 우리가 독점 기능과 새로운 공식을 통합했기 때문에 독특하고 고품질이며 저렴한 거래 도구입니다. 단 하나의 차트로 28 Forex 쌍의 통화 강도를 읽을 수 있습니다! 새로운 추세 또는 스캘핑 기회의 정확한 트리거 포인트를 정확히 찾아낼 수 있기 때문에 거래가 어떻게 개선될지 상상해 보십시오. 사용 설명서: 여기를 클릭  https://www.mql5.com/en/blogs/post/697384 그것이 첫 번째, 원본입니다! 쓸모없는 지망생 클론을 사지 마십시오. 더 스페셜  강력한 통화 모멘텀을 보여주는 하위 창의 화살표 GAP가 거래를 안내합니다! 기본 또는 호가 통화가 과매도/과매도 영역(외부 시장 피보나치 수준)에 있을 때 개별 차트의 기본 창에 경고 표시가 나타납니다. 통화 강도가 외부 범위에서 떨어질 때 풀백/반전 경고. 교차 패턴의 특별 경고 추세를 빠르게 볼 수 있는 다중 시간
They say history repeats itself. What if you could prove it in real-time? The Propfolio Ghost Pattern is an advanced algorithmic pattern-matching engine. It empowers you to select any current price action structure on your chart and instantly scan thousands of historical candles to find the exact moment in the past where the market did the exact same thing. Once it finds the highest probability match, it projects the historical outcome into the future as "Ghost Candles"—giving you a highly calcu
NextCandlePredictor No Repaint
Martin Alejandro Bamonte
NextCandlePredictor 지표 NextCandlePredictor는 다시 그리지 않으며, 색상이 변경되지 않고, 이동하지 않으며, 사라지지 않으며, 지연이 없는 알림이 있는 신호 지표입니다. 모든 타임프레임에서 다음 또는 다가오는 캔들의 방향을 식별하는 데 도움이 됩니다. 뉴욕, 런던 또는 둘 다 겹치는 고변동성 시장에 매우 권장됩니다. 주요 기능: 타임프레임의 유연성: M1에서 H1 이상까지 모든 타임프레임에서 빠르고 정확한 신호를 제공합니다. 명확한 매수/매도 신호: ADX의 DI+ 및 DI- 라인을 사용하여 명확한 매수 및 매도 신호를 생성하여 최고의 거래 결정을 내릴 수 있도록 합니다. 직관적인 시각화: 신호는 차트에 직접 녹색(매수) 및 빨간색(매도) 화살표로 표시되어 빠르고 쉽게 읽을 수 있습니다. 사용자 정의 가능한 설정: 분석할 막대 수와 경고 옵션을 선호도 및 거래 전략에 따라 조정합니다. 사용하려는 TF에 따른 제안표를 아래에서 확인하세요. 캔들 종료 시
구매 후 저에게 연락하여 이 지표를 기반으로 한 보너스 EA를 받으십시오. Self Optimizing Double MA Strategy는 파라미터 추측을 없애기 위해 설계된 전문가 수준의 트레이딩 도구입니다. 내장된 자동 최적화 엔진으로 구동되며, 통계적 우위를 유지하기 위해 백그라운드에서 수천 개의 파라미터 조합을 시뮬레이션하여 변화하는 시장 조건에 지속적으로 적응합니다. 정적이고 구식인 설정에 의존하는 대신, 이 인디케이터는 자체 로직을 동적으로 업데이트하여 현재 시간대와 종목에 가장 수익성 있는 구성을 찾습니다. 주요 기능 내장된 자동 최적화: 시스템은 단기 MA, 장기 MA 및 RSI 기간을 주기적으로 다시 계산하여, 선택한 업데이트 빈도에 따라 설정이 항상 현재 시장 리듬과 일치하도록 보장합니다. MA 다이버전스 필터: 이동평균선이 활발하게 발산(확장)할 때만 시그널을 검증하는 핵심 추세 강도 지표입니다. 이는 평균선이 수렴하거나 평탄한 횡보장에서는 잘못된 진입을 방지합
Bull versus Bear
Mohamed Hassan
4.5 (18)
Send us a message after your purchase to receive more information on how to get your  BONUS  for FREE  that works in great combination with Bull vs Bear ! Bull versus Bear is an easy-to-use Forex indicator that gives traders clear and accurate signals based on clear trend retests . Forget about lagging indicators or staring at charts for hours because  Bull vs Bear provides real-time entries with no lag and no repaint, so you can trade with confidence. Bull vs Bear  helps you enter trades during
Cyclic Impulse
Vitalyi Belyh
차트를 구조화하고 주기적인 가격 변동을 식별하는 기술 지표입니다. 모든 차트에서 작업할 수 있습니다. 다양한 유형의 알림. 그래프 자체에도 추가 화살표가 있습니다. 역사를 재구성하지 않고, 촛불을 닫는 작업에 임한다. M5 이상에서 권장되는 TF입니다. 사용 및 구성이 쉬운 매개변수입니다. 매개변수가 다른 2개의 지표를 사용하는 경우, 다른 지표 없이 해당 지표만 사용할 수 있습니다. 2개의 입력 매개변수가 있습니다 주기성과 신호 지속 시간 이 2개의 매개변수는 차트 구조의 처리와 관련이 있습니다. Cyclicity - 역전 주기가 얼마나 자주 바뀌는지 조절하고 주기를 매끄럽게 합니다. Signal duration - 최소 숫자에서는 가격 움직임의 충격을 감지하고, 최대 숫자에서는 장기적 추세 움직임을 감지합니다.. --------------------------------
Special offer : ALL TOOLS , just $35 each! New tools   will be   $30   for the   first week   or the   first 3 purchases !  Trading Tools Channel on MQL5 : Join my MQL5 channel to update the latest news from me Fibonacci Confluence Toolkit Multi-Timeframe 은(는) 전문 트레이더를 위해 설계된 고급 기술적 분석 도구로, 주요 시장 신호와 패턴을 결합하여 잠재적인 가격 반전 영역을 식별하는 데 도움을 줍니다. 타임프레임 선택기 대시보드를 통한 다중 타임프레임 표시 기능을 갖춘 이 툴킷은 시장 역학에 대한 포괄적이고 통찰력 있는 시각을 제공하여 정확하고 시기적절한 거래 결정을 내릴 수 있게 합니다. MT5 버전 더 보기:  Fibonacci Confluence Toolkit MT5 Mul
제작자의 제품 더 보기
CTA King
Frank Paetsch
CTA King — Medium and Long-Term Trend Catching Module CTA King is part of the CTA System Series and is designed as the medium- to long-term trend-following engine within the CTA portfolio. Its main purpose is to identify and participate in larger directional market movements. While many systems focus on short-term price reactions, CTA King is built to work in a broader trend context. It aims to capture established market direction and remain aligned with stronger movements when conditions suppo
CTA Queen
Frank Paetsch
CTA Queen — Range Market Reversion Module CTA Queen is part of the CTA System Series and is designed to cover the range-market side of the CTA portfolio. While many trading systems are built mainly for trending markets, real market behavior often changes. There are phases where price does not continue in a clear direction, but instead moves back and forth inside a range. CTA Queen is designed for this type of environment. CTA Queen uses a Bollinger-based reversion concept. Its purpose is to ide
CTA Relative Value – Dislocation Scanner & Portfolio Module Markets do not move in isolation. They move in relation to each other. CTA Relative Value is designed to identify and display these relationships. Default behavior By default, this product operates as a scanner and analysis tool . It does not require automated trading to function. Instead, it continuously evaluates multiple instruments and highlights: relative mispricing temporary divergence structural imbalance between markets All r
필터:
리뷰 없음
리뷰 답변