 MetaTrader 5
 Experts
 지표
 라이브러리
 유틸리티
 위젯
 규칙
MetaTrader 5용 유료 기술 지표 - 71
 기술 지표의 시그널은 주식 및 외환 시장에서 거래를 개시 및 종료하는 데 중요한 역할을 합니다. 지표의 본질은 미래의 가격 변화를 예측하기 위한 금융 시그널 값의 수학적 변형입니다.
기술 지표를 테스트하여 시장 행동과 그로 인한 이익을 더 잘 예측할 수 있습니다.

FiboPivotsIndicator is the indicator for intraday traders looking for key breakout levels and target levels on the chart. It uses automatic Fibonacci extensions and pivot points to highlight price event areas. FiboPivotsIndicator is a unique combination of Fibonacci extensions and pivot points for price action traders.
This breakout trading tool is suitable for both trend following and swing trading strategies. Indicators such as moving averages, stochastics and RSI are well suited for this
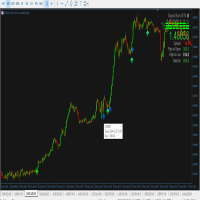
Dynamic Center of Gravity Indicator Revolutionary Price Action Trading System Harness the power of price momentum with the Dynamic Center of Gravity indicator - an advanced price action trading tool designed for serious traders. This innovative indicator identifies powerful gravity zones that attract rapid price movements, creating high-probability trading opportunities when momentum breaks free from these zones. Key Features Pure price action analysis - no lagging indicators Works effectively a

The Opportunity System: Forex Gold Indicator The Opportunity System is a powerful and intuitive Forex Gold Indicator designed to help traders identify prime entry and exit points for trading gold (XAU/USD). This advanced indicator combines the strengths of two of the most popular technical analysis tools – the Stochastic Oscillator and the MACD (Moving Average Convergence Divergence) – to provide precise, real-time insights into market trends and potential reversals. Key Features: Stochastic Osc

Golden Trend Pulse — trend indicator developed specifically for Gold, also applicable to the Cryptocurrency and Stock markets. The indicator is designed for precise determination of market trends using advanced analytical methods. The tool combines multifactor analysis of price dynamics and adaptive filtering of market noise, ensuring high accuracy in identifying key entry and exit points. Thanks to its intelligent system, the indicator effectively handles market variability, minimizing false

Arrow indicator for forex trading using scalping strategy on popular currency pairs, bitcoin, gold, on m1 timeframe and others. The indicator has entry point settings, trend settings for higher timeframes, and various indicator filters, it is also possible to set up time trading intervals for yourself, in which you will receive signal arrows above the candles, as well as pop-up windows with alerts, or notifications on your phone via ID. The settings are simple, the strategy is ready, new sets an
Basic information. To perform its work, the indicator takes data on volumes from a lower timeframe, builds Market Profiles for a higher timeframe and a histogram for the current timeframe. The indicator starts in several stages. In this case, messages like: "Build Source & Target TF. Step: …" are output to the log. The process can be accelerated by changing the input parameter Milliseconds between steps - the initialization speed. The final value of this parameter is always individual and is set

MACD Classic: 이동 평균 수렴/발산 지표 (MT5용) 정확성과 적응성을 중시하는 고급 트레이더를 위해 설계되었습니다. MACD Classic 은 MQL5 를 사용하여 MetaTrader 5 용으로 개발된 맞춤형 기술 지표로, 이동 평균의 수렴과 발산에 대한 명확한 신호를 제공하여 트렌드와 진입/출구 포인트를 보다 효율적으로 식별하는 데 도움을 줍니다. 주요 특징 : 빠른 EMA(12) : 시장의 빠른 움직임을 포착하는 데 이상적입니다.
느린 EMA(26) : 주된 트렌드를 식별하는 데 도움을 줍니다.
신호(9) : 변동성을 평활화하고 더 명확한 신호를 제공합니다. 이 지표는 여러 파라미터로 조정할 수 있어 특정 요구에 맞게 설정할 수 있습니다. 그 디자인 덕분에 짧은 시간대에서 거래하는 트레이더와 긴 시간대에서 거래하는 트레이더 모두에게 적합하며, 시장 상황에 맞게 지표의 민감도를 조정할 수 있습니다. 테스트 및 성능 : 이 제품과 함께 제공되는 비디오에서
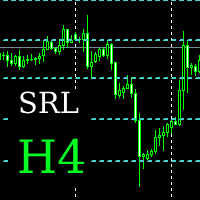
An indicator for determining and displaying support and resistance levels on the H4 chart over the past 180 days. The algorithm searches for local minima and maxima, filters levels to eliminate closely spaced values, and then visualizes them on a graph. Defining key levels Support levels: lows at which the price slowed down or reversed upward. Resistance levels: highs where the price had difficulty rising further.
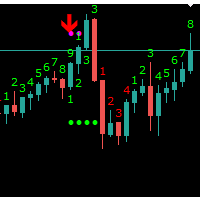
Indicator Sequential Through a multi-phase price comparative process consisting of the Setup and Countdown indicators, the Sequential indicator analyzes otherwise incongruent price data to provide insight into the strength or weakness of the market’s trend and its likelihood of reversing The Mechanics of Sequential We have the market's number The majority of the DeMARK Indicators are designed to anticipate price exhaustion as opposed to following the trend. Identifying likely inflection points

The GoldenBufferPattern indicator uses several indicator buffers (Candles+Fractals+ZigzagColor+ColorMaLine).
The indicator is recommended to be used together with other indicators or using the Martinheim Method. We use this method with this indicator, as well as some of our other proprietary filters and trading strategies in particular, in our Experts Advisors on ProfRoboTrading.
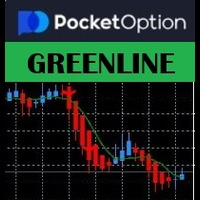
ocket Options GreenLine Strategy – SMA(7) Crossover & Trend Alert Indicator Latest Updates: Added Sell Alerts within an Uptrend – If MA1 crosses below MA2 without going below MA3, a Sell Alert is triggered. Enhanced Alert Logic – Prevents duplicate buy and sell icons on every candle. Improved Print Statement – Alerts now log directly to alerts.txt for future reference. Now Compatible with Heiken Ashi and Regular Candles. Overview
The Pocket Options GreenLine Strategy is a trend-following indic
r-Trend Sync indicator is manual trading system for extra volatility markets. Main System features : The indicators's algorithm is based on the analysis of an extensive array of historical data (from 1995 for EURUSD & EURJPY and from 2004 for XAUUSD), which ensured the identification of general patterns in the behavior of these pairs across a wide range of timeframes. The analysis of historical data helped the system learn to recognize market triggers for medium-term trends and cycles, as well a
Predator Expansion Contraction Candles 지표로 시장 역학의 비밀을 해방하고 거래를 혁신하세요: 시장의 비밀 언어를 해독하고 가격 움직임의 흐름과 역류를 놀라운 정확도로 예측할 수 있는 능력을 상상해 보세요. Predator Expansion Contraction Candles 지표에 오신 것을 환영합니다. 이 혁신적인 도구는 시장 확장 및 수축 단계에 대한 беспрецедент한 통찰력을 제공하여 거래를 새로운 높이로 끌어올립니다. 거래 전략의 전체 잠재력을 해방하세요
이 최첨단 지표는 단순한 도구가 아닙니다. 다양한 전략과 호환되며, 다음과 같은 것들을 포함합니다: 브레이크아웃 전략 : 레이저 같은 정확도로 중요한 브레이크아웃 지점을 식별하여 항상 곡선 앞서 나아가게 합니다. 트렌드 추종 전략 : 시장 트렌드와 일치하도록 확장 및 수축의 명확한 신호를 사용하여 이익을 최대화합니다. 스마트 머니 개념 : 스마트 머니의 흐름과 거래를 일치시켜 기관

Session Liquidity is the most anticipated trading strategy among the ICT trader. With this indicator you could frame the trade by simply deploying it on the chart. By simply inputting the Asian Opening Time, New York Opening Time, and choose the color option and display option you like then you will get the session laid down for you on the chart. You can choose between showing session as box or horizontal line. I personally trade this strategies for quite sometimes.

Are you ready to elevate your trading game and experience unparalleled accuracy in market predictions? The Scalping Range Grid Indicator is not just a tool—it’s your main weapon for pinpointing the next move in the financial markets. Designed for traders who demand the best, this cutting-edge indicator harnesses the power of grid-based analysis to scan future price transit zones with unmatched precision. Imagine having the foresight to know where the price is most likely to pause, consolidate,
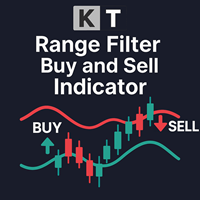
KT Range Filter Buy and Sell 지표는 사소한 가격 움직임과 변동을 단순화하여 보다 부드럽고 명확한 추세로 전환합니다. 일반적으로 QQE 스무딩은 RSI에 적용되지만, 이 지표는 해당 개념을 가격에 직접 적용하여 독특하고 효과적인 시장 분석 방법을 제공합니다.
이 지표는 중앙 평균선과 위/아래 밴드로 구성된 3밴드 구조를 특징으로 합니다. 이 밴드는 범위 배수를 사용하여 계산되며, 가격 움직임을 명확하게 시각화할 수 있는 방법을 제공합니다.
특징
시장 잡음을 제거하여 추세를 식별하고 정확한 매수 및 매도 신호를 생성하는 데 도움을 줍니다. 다양한 거래 스타일을 가진 트레이더에게 적합한 유연성을 갖추고 있습니다. 사용하기 쉬운 인터페이스와 풍부한 사용자 지정 옵션이 제공되어 초보자와 숙련된 트레이더 모두에게 적합합니다. 전략 개발과 의사 결정에 유용한 통찰력을 제공합니다. 모든 MetaTrader 알림을 완벽하게 지원하므로 중요한 시장 움직임을 놓치지 않고 항
SynRhythmic Points Oscillator is an innovative manual trading system based on the combination of two analytical approaches, one focusing on short-term price changes and the other on identifying stable trends and dependencies. This synergy allows for obtaining excellent signals for entering the market while minimizing the influence of random fluctuations and reducing false signals. Additionally, the indicator can easily adapt to various market conditions and be automated, making it convenient for
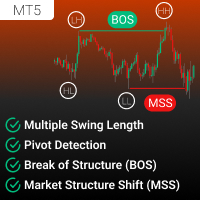
1TF BOS/MSS 인디케이터 는 차트의 단일 타임프레임에서 시장 구조를 분석하고 시각화하도록 설계된 강력한 도구입니다. 이 인디케이터는 시장 구조 브레이크(BOS)와 시장 구조 이동(MSS)을 정확히 감지하여 트레이더가 주요 반전 지점과 트렌드 지속성을 쉽게 식별할 수 있도록 도와줍니다. 맞춤 설정 가능한 옵션과 상세한 주석을 통해 명확성과 자신감을 원하는 트레이더에게 필수적인 도구로 자리 잡고 있습니다. 기능 및 입력 핵심 기능: 시장 구조 브레이크(BOS) 감지: 상승 및 하락 구조의 브레이크를 자동으로 식별하여 중요한 트렌드 변화를 강조. 시장 구조 이동(MSS) 감지: 시장 역학이 변화하는 주요 반전을 정확히 파악하여 잠재적인 기회를 신호. 멀티 스윙 길이 분석: 여러 사용자 정의 가능한 스윙 길이를 사용하여 피벗을 감지하며, 단기 및 장기 시장 구조에 대한 포괄적인 뷰 제공.
(예: 스윙 길이를 4, 6, 8로 설정하면, 인디케이터는 세 가지 길이에 대해 피벗 포인트,
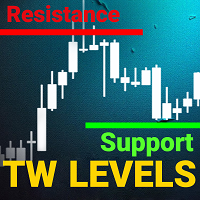
support resistance levels indicator mt5:
이 도구는 차트에서 지원 및 저항선과 피보나치 수준을 식별하고 플롯하는 다중 시간대 지표로, 인간의 눈과 동일한 정확도로 작동합니다. TW 외환 지원 및 저항 수준은 복잡한 알고리즘을 갖추고 있어 차트를 스캔하여 이전 가격 안정화 및 반등 수준을 식별하고 터치 횟수를 기록합니다.
수동으로 지원 및 저항 수준과 피보나치 되돌림을 그리는 데 지치셨습니까?
이 제품의 기능을 확인해 보세요. 놀라울 것입니다.
제품 특징:
1. 소규모 및 대규모 수준: 고급 알고리즘을 사용하여 소규모 및 대규모 수준을 사용자 취향에 맞게 사용자 정의하고 추가 수준을 제거할 수 있습니다.
2. 수준 터치 횟수: TW 지원 저항 수준과 브레이크 mt5, 각 수준이 과거에 몇 번 터치되었는지 계산하여 제공하여 각 수준의 강도를 평가할 수 있습니다.
3. 피보나치 수준: 마지막 파도의 피보나치 수준이 동적으로 그려져, 이러한
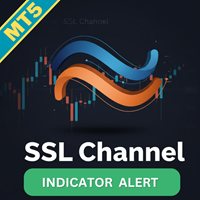
SSL Channel Indicator MT5을 소개합니다. 가격 추세 동향을 시각화하여 거래 정확성을 향상시키기 위해 설계된 강력한 도구입니다. 이 지표는 간단하지만 효과적인 이중 SMA 접근 방식을 통해 추세 반전 및 지속을 식별하려는 트레이더에게 이상적입니다. 혁신적인 플립 기술을 활용하여 SSL Channel Indicator MT5은 명확한 시각적 신호를 제공하여 다양한 시장 상황에서 적시에 거래 결정을 내리는 데 도움을 줍니다. 데이 트레이더이든 장기 투자자이든, 이 지표는 귀하의 거래 전략을 크게 향상시킬 수 있습니다. MQL 제품 설치 가이드 | MT4/MT5에서 구매한 MQL 제품 업데이트 | 일반 문제 해결 가이드 | 지표 설정 / 가이드 주요 기능 버퍼 통합: 지표 값을 Expert Advisors가 자동 거래를 위해 직접 읽을 수 있는 접근 가능한 버퍼로 노출합니다. 팝업 알림: 신호 이벤트에서 MetaTrader 알림 팝업을 발생시켜 거래 설정을 놓치지 않도록

Volume Bar POC 인디케이터 는 틱 거래량을 기반으로 주요 가격 수준(Point of Control, POC)을 정확하게 시각화할 수 있는 혁신적인 도구입니다. 이 인디케이터는 각 캔들 내의 모든 가격 포인트를 분석하여 가장 중요한 가격 수준을 표시하며, 강력한 지지 및 저항 영역으로 활용할 수 있습니다. 데이 트레이딩 및 장기 거래 전략에 이상적입니다. Volume Bar POC 인디케이터는 어떻게 작동합니까? 이 인디케이터는 각 캔들이 형성되는 동안 POC를 계산하기 위해 고급 프로세스를 사용합니다: 캔들이 열릴 때 테이블 생성 : 새 캔들이 열리면 인디케이터는 다음 데이터를 포함하는 내부 테이블을 생성합니다: 가격 : 캔들의 Low와 High 사이의 모든 가격 수준. 거래량 : 각 가격 수준에서 발생한 틱 수(틱 거래량). 테이블은 캔들 범위 내의 모든 가격 포인트를 동적으로 포함합니다. 캔들이 형성되는 동안 테이블 업데이트 : High와 Low 값이 변할 때마다 새로
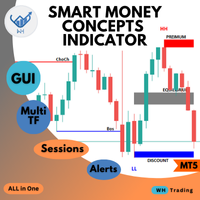
Welcome to the ultimate Smart Money Concepts indicator ,, this indicator is All-in-One package the only thing you need to empower
all the Smart Money Concepts in one place with interactive advanced gui panel with all the features and customization you need. MT4 Version : WH SMC Indicator MT4 *This Price For Limited Number of Copies.
Features: Main Section: User-Friendly Panel (GUI): Designed for traders of all experience levels, the indicator integrates seamlessly into your MT5 platform

Introducing our advanced Indicator, a groundbreaking tool for identifying support and resistance zones with unmatched precision. Elevate your trading strategy with a host of features, including a dual-color upper and lower box system that allows for easy visual recognition of market trends.
Key Features: Dual-Color Box for the Support and Resistance Zones Customize your analysis with dual-color box. The upper and lower boxes offer distinct colors, providing a clear visual representation of supp

The KT Dynamic Price Oscillator (DPO) offers a specialized approach to analyzing the trend, momentum, and volatility of financial instruments. It excels at identifying trend continuations, overbought or oversold conditions, and potential reversal points with precision. It is specifically designed to assist traders in identifying short-term price cycles and potential reversals by effectively filtering out long-term trends.
How to use the DPO
Trend Confirmation: The DPO acts as a reliable confir

Overview The Waterfall Trading Indicator is a powerful momentum detection tool designed to identify high-probability trading opportunities across multiple timeframes. Built on pure price action analysis, this indicator provides clear, non-repainting signals that are especially effective for binary options and forex trading. Key Features Non-Repainting Signals : Based on real-time price action, ensuring reliable trade signals Multi-Timeframe Compatibility : Effective across all timeframes, with o

The Matrix Series indicator analyzes price action, moving averages, and volatility to detect trending conditions. Bullish Trend: Green zones or upward signals indicate a strong uptrend, ideal for long positions. Bearish Trend: Red zones or downward signals suggest a downtrend, perfect for short positions. Sideways/Neutral Market: Non-highlighted or gray zones show periods of market consolidation or low momentum, helping you avoid false signals. Use Cases: Trend Confirmation: Use the indicator to

As an ICT or SMC trader you must do top-down analysis, and you struggle to make template of drawing object on Metatrader just like you normally do on Tradingview. Well, Drawing Assistance indicator will make your top-down analysis much easier on Metatrader. Allow to design template for 3 timeframes. (HTF, MTF and LTF). Each objects drawn on chart will have the color, style and visibility individually by the timeframe it was drawn on. Save time as all analyzing is done on Metatrader chart. Shortc

Fibo Extrema Bands is a unique indicator that visually demonstrates when the market shifts into a trend and highlights key levels acting as support or resistance. It combines easy-to-read “stepped” extrema lines with Fibonacci levels (whose values can be adjusted in the indicator’s inputs), simplifying the search for entry and exit points. Install Fibo Extrema Bands to gain a powerful tool for trend analysis and for identifying critical price levels! This product is also available for MetaTrade

The Extreme Spike PRT Indicator is an effective tool for identifying sharp market fluctuations . It performs its calculations using the ATR (Average True Range) indicator and displays candles with extreme volatility in two categories: primary spikes and secondary spikes , within the Metatrader platform oscillator window. This tool assists traders in detecting intense price movements and conducting more precise analyses based on these fluctuations. Time Frame 15-minute - 1-ho

Summary
This indicator plots multiple pivot points (support and resistance levels) using various calculation methods, allows customization of their appearance, and can alert when price touches these levels. It works on different timeframes and can display historical levels or just the current ones.
Overview Purpose : Plots dynamic pivot levels (Pivot, S1-S4, R1-R4) on the chart to help identify potential price reversal zones. Key Features : Supports 7 calculation methods (Classic, Camarilla

Spike Phantom
Spike Phantom is a specialized indicator for PainX and GainX synthetic indices that generates trading signals with automatic alert notifications.
Features The indicator analyzes market conditions using proprietary algorithms and displays buy/sell arrows directly on the chart. It works specifically with PainX and GainX indices on M5 timeframe. Signal generation combines multiple technical analysis methods to identify potential trading opportunities. The system provides two TP leve
Volonacci Indicator It is an indicator that combines Fibonacci and volume to determine the price direction This indicator helps you identify Fibonacci angles according to the strategy The Volonacci indicator is indeed an interesting combination of Fibonacci levels and volume. This indicator uses Fibonacci tools to identify potential support and resistance levels, and enhances this by using volume to confirm the strength behind the price action.
MT4 Version https://www.mql5.com/en/market/produ
VWAP Trend Pro (Volume Weighted Average Price) is a versatile trading tool that can be used effectively in several ways: This is an advanced Volume Weighted Average Price indicator that revolutionizes your trading experience by dynamically changing colors across scanned timeframes, providing real-time trend insights. The intuitive right corner scanner with three simple squares represents Monthly, Weekly, and Daily trends, each bordered by the current trend color and with background color indicat
이 지표는 바이너리 옵션 또는 외환 스캘핑에 대한 진입 신호를 생성합니다. 일반적으로 차트에서는 마지막 캔들에 화살표가 나타나거나 사라질 수 있습니다. 이는 정상적인 현상입니다. 지표가 데이터를 처리하고 조건을 읽어 진입 신호를 보냅니다. 상황은 매초 바뀌므로 신호는 나타나기도 하고 사라지기도 합니다. 이는 기본적으로 거래자에게 진입 조건이 형성되고 있으므로 준비하라는 알림입니다. 캔들 마감 시, 조건이 확인되면 지표는 차트에 화살표를 확실하게 인쇄하고 특별한 "팝업" 창에 나타나는 경고음을 냅니다. 이때가 거래(또는 옵션)를 시작할 때입니다.
영업 시간 및 통화 쌍: 참조 통화의 시장이 열리는 시간 동안 거래하는 것이 좋습니다. EUR 및 GBP가 포함된 통화쌍의 경우 유럽 시장 개장 시간(8-17 gmt)에 거래하는 것이 좋습니다. USD가 포함된 통화쌍의 경우 미국 시장 개장 시간(14.30-21 gmt)에 거래하는 것이 좋습니다. AUD, NZD 및 JPY가 포함된 통화쌍

very simple indicator to help with fast risk management during volatility.
~Displays: - stop loss in points of your choice. - take profit in points of your choice. - what lot size to risk on the trade relative percentage.
~Values that can be changed: - take profit points. - stop loss points. - risk in percentage. - color of lines. - width of lines. - linestyle. - buy / sell trade.
A simple Zig Zag indicator with added visualization of Higher High, Lower High, Higher Low, Lower Low. This indicator will be very helpful when working with support/resistance levels. The ZigZag indicator is a fundamental tool that will significantly help you navigate complex situations in the financial markets. By providing a clear visual representation of price movements and trends, it simplifies the analysis process and improves decision-making capabilities. Its role in identifying trends and

Simple Japanese candlestick indicator
Contains 3 patterns: - bearish engulfing - bullish engulfing - doji
Only contains these 3 because after rigorous testing and trading (data) these seem to be the most efficient. Also contains: - alerts if enabled
When japanese candlestick is detected it is colored with relevant color depending on bias, and also shows label next to it. Labels: - BEG = Bearish engulfing - BE = Bullish engulfing - DO = Doji
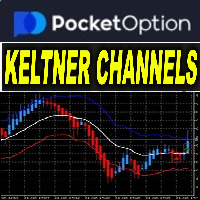
ocket Options Keltner Channel with MA v3.12 Indicator Name: Keltner Channel v3.12 – Advanced Trend and Signal Indicator
Version: 3.12
Release Date: 2024
Platform: MetaTrader 5 (MT5)
Category: Trend Indicators Overview
Keltner Channel v3.12 is a trend-following indicator that combines Keltner Channels with Moving Averages (MA1 and MA2) to identify breakouts, trend shifts, and momentum changes. This tool provides real-time buy and sell signals, visual markers, and alerts to assist traders in dec
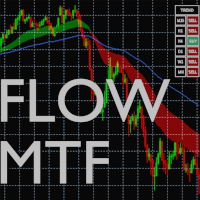
This indicator takes as parameters the periods for three moving averages (Short, Long, Very_Long) and displays them for the current timeframe: - in the form of a cloud (green if Short is greater than Long, red if Short is less than Long) - as a line for the Very_Long moving average. It also allows you to display the status (BUY or SELL) of these same moving averages but for the M15, H1, H4, W1 and MN1 timeframes. This information is summarized in the window titled "TREND", where, for each timefr

Trend Strength Visualizer A Simple Tool for Trend Analysis This indicator helps you quickly assess the strength of market trends using fast and slow moving averages. It’s designed to give you a clear visual representation of the trend, so you can make better trading decisions. ~Displays: Green Line : Strong uptrend (potential buying opportunities). Red Line : Strong downtrend (potential selling opportunities). ~Values That Can Be Changed: Fast MA period. Slow MA period. Line color for uptrend an
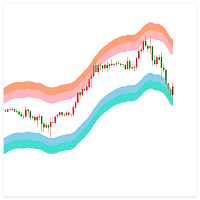
Indicator Introduction: The Volatility Range Indicator aims to help traders identify the current market's volatility range by analyzing historical price data. By calculating the upper and lower bounds of price fluctuations, traders can determine potential support and resistance levels, providing a foundation for subsequent trading decisions. This indicator is particularly suitable for ranging markets and high-volatility environments, as it can effectively assist traders in capturing price breako

One of the most accurate ways to predict price movements is to identify imbalances. When we identify significant price imbalances (aka fair value gaps or fvgs/ifvgs), it becomes relatively easy to place trades based on continuations and retracements. A moving average simply cannot give you anywhere near the precision we find when we observe the reaction of price to an imbalance. There are a few products on the market that claim to provide trading opportunities based on imbalances, but we believe

Checklist Indicator for MT5 Streamline your trading process with the Checklist Indicator —a powerful tool designed to keep you disciplined and organized. This indicator allows you to create and manage a personalized checklist directly on your chart, ensuring you follow your trading rules before entering a position. ️ Customize your own trading checklist
️ Stay consistent and avoid impulsive trades
️ Improve decision-making with structured analysis
️ Seamlessly integrates into your MT5 workfl
SAR Vision MTF – MT5용 다중 타임프레임 Parabolic SAR 지표 SAR Vision MTF 는 상위 타임프레임의 Parabolic SAR 값을 현재 차트에 직접 표시하는 다중 타임프레임 기술 분석 도구입니다. 여러 차트를 전환하지 않고도 더 넓은 시장 추세를 분석하는 데 도움을 줍니다. 주요 기능 다중 타임프레임 기능 – 상위 타임프레임(예: M5, M15, H1, H4)의 SAR 신호를 하위 타임프레임 차트에서 확인할 수 있습니다. 사용자 지정 가능 – 점 크기, 색상 및 선택한 타임프레임을 사용자 취향에 맞게 조절할 수 있습니다. 명확한 시각적 표현 – 각 타임프레임마다 다른 색상을 사용하여 추세 신호를 구분하기 쉽습니다. 가볍고 효율적 – 다양한 차트 유형에서 원활하게 작동하도록 최적화되었습니다. 사용 사례 추세 관찰 – 상위 타임프레임의 SAR 신호를 모니터링하면 현재 차트 움직임에 대한 추가적인 시장 상황을 파악할 수 있습니다. 잠재적 반전 탐지 – 다
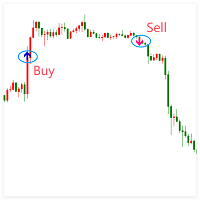
Extreme Breakout Signal is a trading strategy based on price breaking key support and resistance levels. It helps identify potential trend changes and capture new upward or downward movements.
Parameter Extreme Radius : A customizable parameter that can be set differently for each timeframe Key Principles Support & Resistance : Price often reacts at these levels; a breakout may indicate a new trend. Confirmation : Use volume or other indicators to confirm breakout validity. Signal Types Buy Sig

시장에 숨겨진 진정한 패턴을 발견하세요. PREDATOR AURORA 트레이딩 시스템과 함께 하세요 — 하이브리드 트레이딩 지표의 최종 보스. 다른 사람들이 보지 못하는 것을 보세요! PREDATOR AURORA 트레이딩 시스템은 평범함의 그림자에서 움츠러들기를 거부하는 사람들을 위해 설계된 강력한 도구입니다. 이것은 단순한 또 다른 지표가 아닙니다; 이것은 당신의 치트 코드입니다; 당신의 불공정한 이점이며, 시장의 움직임을 치명적인 정확도로 추적하는 정교한 하이브리드 헌팅 시스템입니다. 오직 가장 강한 자만이 생존하는 정글에서, 자연에서 가장 강력한 포식자에게 영감을 받은 PREDATOR AURORA는 변화하는 시장 조건에 원활하게 적응하는 고급 적응 알고리즘을 사용합니다. 그림자 속에 숨어 있는 포식자처럼, 시장의 소음을 뚫고 다른 사람들이 결코 발견하지 못할 높은 확률의 거래 기회를 드러냅니다. 주요 특징: 적응형 헌팅 메커니즘: 시장 변동성에 즉시 조정되어 무자비한 효

Utility of the Indicator Multifaceted Analysis : Allows for a comprehensive view of the market through different metrics (trend, volatility, momentum, risk, support/resistance). Trading Signals : Offers clear buy and sell signals, aiding traders in making entry and exit decisions. Risk Management : The risk buffer helps to assess when it is safe or risky to execute trading operations. Customizable Visualization : With multiple colors and chart styles, it becomes easy for the trader to interpre

AriMax – AI-Powered Trading Robot AriMax is a cutting-edge AI-powered trading robot designed to help traders maximize profits while minimizing risk. Utilizing advanced machine learning algorithms and real-time market analysis, AriMax identifies high-probability trade opportunities with precision and speed.
Key Features: AI-Driven Market Analysis – Analyzes market trends and patterns to make data-driven trading decisions.
Automated Execution – Places trades seamlessly with optimiz

Heiken Ashi Smoothed – The Ultimate Trend Filtering Indicator for MT5 Enhance Your Trading with Smoother Trends! The Heiken Ashi Smoothed indicator is a powerful tool designed for traders who want clearer trend signals while eliminating market noise. Unlike traditional Heiken Ashi candles, this smoothed version provides fluid, lag-free price action , making it perfect for swing trading, trend following, and long-term analysis. Key Features: Crystal-Clear Trends – Filters out market noise for
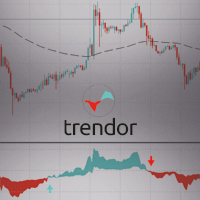
The TRENDOR 1.0 indicator is designed to identify and filter market trends using a combination of RSI and ATR indicators. This powerful trend detection system helps spot significant RSI crossovers while filtering out false signals using an ATR and an EMA (Exponential Moving Average). The purpose of this indicator is to provide clear and precise signals for optimal trading decision-making.
Main features:
Short and Long RSI: Combines the values of two RSIs (short and long) to detect market tr
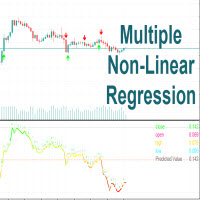
Multiple Non-Linear Regression This indicator is designed to perform multiple non-linear regression analysis using four independent variables: close, open, high, and low prices. Here's a components and functionalities: Inputs: Normalization Data Length: Length of data used for normalization. Learning Rate: Rate at which the algorithm learns from errors. Show data points: Show plotting of normalized input data(close, open, high, low) Smooth?: Option to smooth the output. Smooth Length: Length of

MTF Candles Overlay View higher timeframe candles directly on your current chart without switching between multiple windows. MTF Candles Overlay displays complete higher timeframe candles (OHLC, body and wicks) as an overlay on any chart, allowing you to analyze market structure, trend direction and key price levels from multiple timeframes at the same time. Includes support for all standard MetaTrader timeframes plus a unique Yearly (Y1) timeframe for long-term market analysis. Key Features Mu
Un order book, ou carnet est un outil numérique qui affiche en temps réel les ordres d'achat et de vente pour un actif financier spécifique, comme une action, une crypto-monnaie ou une paire de devises. Il permet aux traders de visualiser la profondeur du marché, c'est-à-dire la quantité d'ordres d'achat et de vente à différents prix. Voici une description des éléments clés d'un order book : Colonne d'achat (Bid): Affiche les ordres d'achat en attente pour un actif. Les prix d'achat sont classés
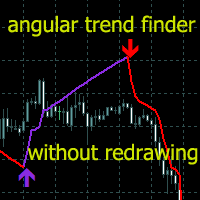
추세 지표는 금융시장 거래에 사용되는 기술 분석 분야 중 하나입니다.
Angular Trend Lines - 추세 방향을 종합적으로 판단하고 진입 신호를 생성합니다. 캔들의 평균 방향을 매끄럽게 하는 것 외에도
또한 추세선의 경사각도 사용합니다. 갠 각도를 구성하는 원리는 경사각의 기초로 사용되었습니다.
기술 분석 지표는 촛대 평활화와 차트 기하학을 결합한 것입니다.
트렌드 라인과 화살표에는 두 가지 유형이 있습니다. 강세 방향의 빨간색 선과 화살표. 약세 방향의 보라색 선과 화살표.
표시기 기능
이 지표는 사용하기 쉽고 매개변수를 구성할 수 있으며, 추세 분석과 주문 개시를 위한 신호 수신에 사용할 수 있습니다.
지표는 다시 그려지지 않고, 화살표는 캔들 마감 시점에 나타납니다.
신호가 발생하면 여러 유형의 알림을 제공합니다.
모든 금융 상품(외환, 암호화폐, 금속, 주식, 지수)에 사용할 수 있습니다.
해당 지표는 모든 시간 범위와 차트에서 작동할 수 있습니다.
이 지표는
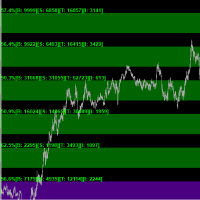
Key Features: • Multi-Zone Analysis: Track volume patterns across multiple customizable price zones • Real-Time Volume Tracking: Monitor buy/sell pressure as it develops • Dynamic Price Levels: Automatically adjusts zones around daily opening prices • Advanced Statistics: View detailed volume metrics and price action percentages
Technical Capabilities: • Volume Distribution Analysis - Buy/Sell volume ratios - Volume imbalance detection - Total trading activity monitoring - Price action directio

This isn't just an indicator; it's a top-tier market analysis tool that combines the power of various technical analysis techniques into one package. Perfect for traders seeking precision and clarity in their trading decisions. Key Features: HiLo Activator: Easily capture the essence of market trends. This component differentiates between bullish or bearish markets, helping you to be on the right side of the move. MACD (Moving Average Convergence Divergence): Quickly identify changes in market

Discover the Power of the QDOTRAXY Indicator: Your Key to Precise Trading Decisions! Have you ever imagined having a powerful ally that combines advanced technical analysis with real-time alerts to maximize your market operations? We introduce ULTRA ADVANCED, the indicator that revolutionizes how you make buy and sell decisions. Why Choose QDOTRAXY? Unmatched Accuracy: QDOTRAXY combines multiple technical indicators (MACD, Bollinger Bands, SAR, and Moving Average) to generate highly reliable si
In the dynamic world of forex trading, technical analysis is an essential tool for traders seeking to navigate the complexities of the currency markets. One key element of this analysis is the interpretation of candlestick patterns, particularly the phenomenon of consecutive one-sided candles. These candles, characterized by a uniform direction — either completely bullish or bearish — offer significant insight into market sentiment and potential future movements. Understanding the implications o
This indicator automatically identifies and plots key support/resistance (S/R) levels on price charts using a hybrid algorithm combining fractal detection , price touch validation , and dynamic level managemen. Key Features
Support and Resistance Levels: Support levels and Resistance levels are drawn in red . Fractal-Based Detection: Levels are identified based on fractal highs and lows. Efficient Memory Handling: The number of levels is limited to 100 to avoid clutter. Cleanup on Deletion: All
The Volume-Weighted RSI (VW-RSI) is a powerful technical analysis tool that combines the traditional Relative Strength Index (RSI) with volume data to provide a more nuanced view of market conditions. By incorporating volume into the RSI calculation, the VW-RSI offers a unique perspective on price momentum, helping traders identify potential reversals, confirm trends, and filter out false signals. Below is a detailed explanation of the VW-RSI, its features, and why it stands out as a unique indi

Solar Prediction – Indicator for Market Price Analysis Solar Prediction is a tool designed to analyze market price movements. The indicator processes market dynamics and helps identify potential entry and exit points. Market data analysis without additional indicators
Flexible application – works on different timeframes
Ease of use – suitable for both beginners and experienced traders
Adaptability to market conditions – tracks price movement changes Solar Prediction is a solution
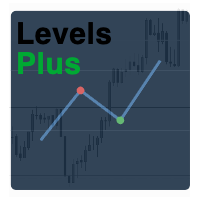
Levels Plus Indicator Overview The Levels Plus Indicator is a sophisticated and highly effective tool designed for traders who seek to identify key price levels in the market. This indicator combines multiple key levels and Volume Profile Point of Control (POC) lines to provide a comprehensive view of the market structure. Whether you're a day trader, swing trader, or long-term investor, the Levels Plus Indicator offers valuable insights that can help you make informed trading decisions. Key Fe

Structure Levels (Highs & Lows) Indicator for MetaTrader 5
Decode Market DNA — Trade with Institutional Precision Description:
The Structure Levels (Highs & Lows) Indicator is your secret weapon to map the market’s hidden roadmap. Designed for traders who think in terms of price action and market structure, this tool automatically identifies critical swing highs and swing lows, transforming chaotic charts into a clear blueprint of support/resistance zones, breakout opportunities, and trend rev
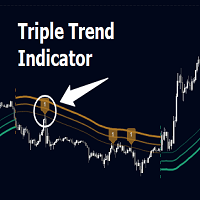
Triple Trend Indicator is a versatile trend-following tool designed to help traders identify trend strength and potential pullback levels using a three-band system. Each band represents a varying degree of price deviation from the mean, providing progressively stronger trend signals.
Key Features:
Three Adaptive Bands:
The indicator dynamically calculates three bands (1, 2, and 3) based on moving averages (SMA, EMA, WMA) and ATR multipliers.
Bands are positioned below the price in a

Reversal Zones Pro – an indicator specifically designed for accurately identifying key trend reversal zones. It calculates the average true range of price movement from lower to upper boundaries and visually displays potential reversal zones directly on the chart, helping traders efficiently pinpoint crucial turning points in the market. Key Features: Reversal Zone Identification: The indicator visually highlights potential reversal zones directly on the chart, enabling traders to effectively id
Panther Scalping Indicator – The Ultimate Trading Weapon for Gold, Forex & BTC! Dominate the Markets with Precision Buy & Sell Signals! We’ve designed the Panther Scalping Indicator to give you an unfair advantage in trading Gold (XAUUSD), Forex pairs, and BTC. This powerful tool is built on the proven Panther Scalping Strategy , ensuring you never miss a high-probability trade. How It Works:
Lime Up Arrow – A clear Buy Signal when market conditions align.
Red Down Arrow – A strong
Panther Scalping Indicator – Your Ultimate Trading Edge! Maximize Your Profits with the Panther Scalping Indicator! We’ve transformed the powerful Panther Scalping Strategy into an advanced indicator that gives you precise Buy and Sell signals on Deriv’s Synthetic Indices , including Volatility Indices, Step, Jump, and Drift Switching Indices. How It Works:
Lime Up Arrow – Clear Buy Signal when market conditions align.
Red Down Arrow – Strong Sell Signal to capitalize on downtrends

Initial Balance Indicator for MQL5 The Initial Balance Indicator is a powerful trading tool for the MetaTrader 5 (MT5) platform that helps traders analyze market structure by marking the Initial Balance (IB) range of a trading session. This range is typically formed during the first X minutes of a trading session (e.g., the first hour in futures markets) and acts as a key reference for potential price movements. Key Features: Customizable Time Period: Define the exact start and end time for the
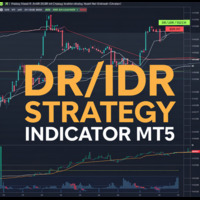
Unlock the full potential of your trading strategy with the DR IDR Indicator and the DR ODR Indicator for MT5. These powerful tools are designed to enhance your trading and increase your market performance, especially during high-volatility periods such as the opening of major stock indices like the DAX, DOW, NASDAQ, and S&P 500. DR / IDR Trading Strategy: Leverage Explosive Price Movements The Opening Range Breakout (ORB) Indicator is a must-have tool to capitalize on the explosive price moveme
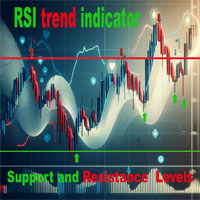
Индикатор RSI Уровни Поддержки/Сопротивления – это мощный инструмент технического анализа, который помогает трейдерам находить точки входа и выхода на основе сигналов RSI и ключевых уровней цены. Индикатор подтверждает зоны перепроданности и перекупленности с учетом исторических максимумов и минимумов. Основные особенности Сигналы на основе RSI: Покупка при перепроданности, продажа при перекупленности.
Динамические уровни: Автоматический расчет ключевых зон поддержки и сопротивления.
Визу
MetaTrader 마켓 - 트레이더를 위한 로봇 및 기술 지표는 거래 터미널에서 바로 사용할 수 있습니다.
The MQL5.community 결제 시스템은 MQL5.com 사이트의 모든 등록된 사용자가 MetaTrader 서비스에서 트랜잭션을 수행할 수 있습니다. 여러분께서는 WebMoney, 페이팔, 또는 은행 카드를 통해 자금을 예치하거나 인출하실 수 있습니다.
