MetaTrader 5용 기술 지표 - 99
O delta volume é uma ferramenta poderosa utilizada em várias estratégias de operação, especialmente no trading de futuros, ações e criptomoedas. Aqui estão algumas das principais estratégias onde o delta volume é frequentemente aplicado: Identificação de Tendências : O delta volume ajuda a identificar a direção da tendência predominante, mostrando se há mais pressão de compra ou venda. Isso pode ser útil para confirmar a força de uma tendência ou identificar possíveis reversões. Confirmação de B
Welcome to the Super Trend System The Super Trend System has been running live for over 18 months with consistent performance and proven reliability. Powered by an advanced trend-detection algorithm, it delivers strong results on over 88% of forex pairs. The system analyzes multiple timeframes to determine the overall market direction and improve the quality of each signal. We've also included trade management screenshots to help you get started quickly and confidently. How to Use the System Sel

A complex of indicators of recognizing reversal moments. Detects the peaks and hollows according to the combinations of candles after they deduct from two MA. Applicable for trading systems when using early inputs. You can use a trend for scalping and intraday trade, and for detecting a trend in the early stages.
Possibilities
The parameters provide flexible settings for any time floms and trading tools. There are several types of warning for signals. Yellow arrow - Sell signal , pink arrow -

O indicador media colors se baseia num canal que pode ser criado a partir de duas médias Media colors é um indicador de tendência utilizado no trading para identificar a direção predominante do mercado. Pode ser baseado na Média Móvel Simples (SMA) e na Média Móvel Exponencial (EMA) que dá mais peso aos preços mais recentes, tornando-a mais sensível às mudanças de preço. Como Funciona: Cálculo: A EMA é calculada aplicando um fator de suavização aos preços de fechamento de um ativo financeir

Enhance Your Trading with Buraq Bars Indicator! Take your trading to the next level with Buraq Bars ! This easy-to-use indicator draws bars on your chart whenever the RSI (Relative Strength Index) crosses above or below the levels you choose, giving you clear signals to help you trade better. Key Features: Set Your Own RSI Levels: Choose the levels for overbought and oversold that work best for you. Clear Visual Signals: Bars appear on your chart when the RSI crosses your levels, making it easy

재무 지표 SolarTrade Suite: Comet Market Indicator - 금융 시장의 세계에서 신뢰할 수 있는 가이드!
이 지표는 특별하고 혁신적이며 진보된 알고리즘을 사용하여 가치를 계산하는 기간 지표이며, 또한 즐거운 디자인과 추가 기능이 있습니다.
이 지표의 판독값을 이해하기 매우 쉽습니다. 녹색 수직선은 새로운 기간의 시작을 나타냅니다. 추가 기능으로는 다음과 같습니다. - 메인 차트 창의 상단 절반을 여러 번 클릭하여 전경색을 파란색으로 변경하거나, - 메인 차트 창의 하단 절반을 여러 번 클릭하여 전경색을 빨간색으로 변경합니다. - 프로그램 설정에서 가격 척도 표시를 켜거나 끄는 옵션이 있습니다. - 프로그램 설정에서 시간 척도 표시를 켜거나 끄는 옵션이 있습니다.
설명 하단에서 SolarTrade Suite 시리즈의 다른 제품을 확인하세요.
투자와 금융 시장의 세계를 자신 있게 탐색하고 싶으신가요? 재무 지표 SolarTrade Suite: Com

TheCubeBars - Colored Volume Indicator for MetaTrader 5 Full Description What is TheCubeBars? TheCubeBars is a revolutionary indicator that transforms volume visualization in MetaTrader 5, coloring candles according to the intensity of tick volume. Developed by Ethernal, it offers:
Instant visualization of volume strength in each candle
Testimonials "After I started using TheCubeBars, my breakout hit rate improved by 40%!" - Ricardo F., Professional Trader
"Finally a volume indicato

TheCubeBars - Colored Volume Indicator for MetaTrader 5 Full Description What is TheCubeBars? TheCubeBars is a revolutionary indicator that transforms volume visualization in MetaTrader 5, coloring candles according to the intensity of the tick volume. Developed by Ethernal, it offers:
Instant visualization of the volume strength in each candle
Testimonials "After I started using TheCubeBars, my breakout success rate increased by 40%!" - Ricardo F., Professional Trader
"Finally a vol
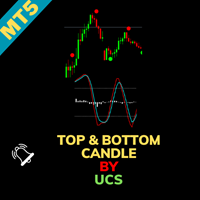
UCS_Top & Bottom Candle Indicator for MetaTrader 5 The UCS_Top & Bottom Candle is an innovative experimental indicator designed for MetaTrader 5. Based on momentum, this indicator identifies the top and bottom candles for most swing movements, assisting traders in making precise market entries and exits. Key Features: Momentum-Based Analysis: Utilizes momentum to detect the top and bottom candles for swing trading opportunities. Customizable Settings: Percent K: Set the Percent K value (default
Indicator Name: CM_Williams_Vix_Fix Finds Market Bottoms Overview: The CM_Williams_Vix_Fix Finds Market Bottoms indicator is an advanced tool designed to identify market reversal points across various asset classes. Inspired by the original work of Larry Williams, this indicator provides similar insights to the VIX for stock indices but with the added flexibility of functioning effectively across all asset types. Key Features: Versatility Across Asset Classes: Unlike traditional indicators that

Indicator Name: G-Channel Trend Detection Overview: The G-Channel Trend Detection indicator offers a unique approach to trend analysis, leveraging AlexGrover's G-Channel methodology. This indicator provides a clear and simplified view of market trends by identifying bullish and bearish conditions based on price interactions with the G-Channel boundaries. Key Features: Trend-Based Market Analysis: The indicator determines trend direction by monitoring price action relative to the G-Channel bounda

CVD SmoothFlow Pro - 모든 자산에 대한 무제한 볼륨 분석! CVD SmoothFlow Pro 는 정밀하고 무제한의 볼륨 분석을 원하는 트레이더를 위한 최적의 솔루션입니다. Cumulative Volume Delta (CVD) 계산과 고급 노이즈 필터링을 활용하여, Pro 버전은 모든 금융 자산 거래에 필요한 유연성과 정확성을 제공합니다. CVD SmoothFlow Pro가 제공하는 기능: 명확한 분석 : 시장 노이즈를 필터링하고 모든 금융 자산에서 중요한 볼륨 변동을 강조합니다. ️ 정확한 계산 : 매수와 매도 차이를 모니터링하여 외환, 지수, 암호화폐 등 자산의 볼륨 행동을 상세히 제공합니다. 직관적인 인터페이스 : 데이터가 명확하게 제시되어 분석이 쉽고 효율적입니다. 트렌드 식별 : 시장 트렌드를 자신 있게 식별하여 정보에 기반한 결정을 지원합니다. 실용적인 적용: 모든 자산의 실시간 매수자와 매도자 균형을 모니터링합니다. 볼륨을 기반

The Super Indicator is a comprehensive trading solution tailored for new and experienced traders . It combines over 5 indicators to give alert Signal Clarity : Offers arrow signals for clear entry and exit points . Real-time Alerts : Keeps traders informed with trade entry and exit alerts. ATTENTION : For a great result , please use Zigzag (50;50;3) Features : Non-repainting
Max activations 7+ strategies 5 Indicators all in one Entry and exit points and arrows Alerts to phon

DYJ SmoothedMA Strategy is a very simple but powerful system to get forex and s ynthetic market trend direction. This indicator is actually a moving average indicator containing 10 smoothing algorithms in a file . The indicator can help you to see the whole trend break out/rebound signal. And these BUY and SELL signals are sent out. You can use DYJ GameDevice follow-up software to receive these signals and realize automatic opening and closing of positions. And can use the game strategy fu
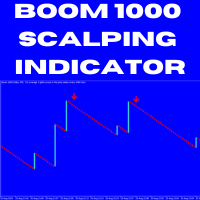
DC Boom 1000 Scalping Strategy Guide **Price**: $30 **Contact**: WhatsApp/Telegram: +27683229304 WhatsApp/Telegram: +27671192993 1. Understanding the Boom 1000 Index Boom 1000 Index: A synthetic index known for generating upward spikes. This strategy focuses on capturing the brief downward movements between spikes by selling when specific signals appear. 2. Timeframe M1 Timeframe: This strategy is exclusively designed for the 1-minute (M1) chart, allowing you to make quick trades and capture sma

This is a early support and resistance indicator. It will allow you to choose how many candles back. You can use it on all timeframes. Change the color as you like. You can use it with other indicators for better entry prediction it will give you trend for bear market and bull market. It will help you predict sideways market trending market and falling market. Save trading

Trade Sniper 소개: 시장에서의 우위.
MT4 버전: https://www.mql5.com/en/market/product/122371
수익성 있는 거래를 놓치거나 시장의 잘못된 측면에서 잡히는 데 지치셨나요? Trade Sniper를 만나보세요. 이 최첨단 지표는 추세의 힘을 활용하여 거래에서 날카로운 이점을 제공합니다.
Trend Sniper는 평범한 지표가 아닙니다. 고급 알고리즘과 시간에 검증된 거래 원칙을 결합하여 믿을 수 없을 정도로 정확하게 높은 확률의 거래 기회를 발견하는 데 도움이 되는 정교한 도구입니다.
Trade Sniper를 시장에서 비밀 무기로 만드는 이유는 다음과 같습니다.
향상된 추세 감지: 당사의 독점 AIgo는 여러 시장 요인을 실시간으로 분석하여 기존 지표를 훨씬 능가하는 정밀도로 추세를 식별합니다. 매우 명확한 신호: 혼란스러운 차트 어수선함과 작별하세요. Trade Sniper는 차트에서 바로 명확하고 실행 가능한 매수 및 매도
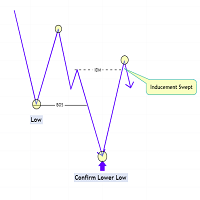
The Market Structure with Inducements & Sweeps indicator is a unique take on Smart Money Concepts related market structure labels that aims to give traders a more precise interpretation considering various factors.
Compared to traditional market structure scripts that include Change of Character (CHoCH) & Break of Structures (BOS) -- this script also includes the detection of Inducements (IDM) & Sweeps which are major components of determining other structures labeled on the chart.
SMC & pri

Smart Fibo Zones are powerful, auto-generated Fibonacci Retracements that are anchored to key market structure shifts . These zones serve as critical Supply and Demand levels, guiding you to identify potential price reactions and confirm market direction. Fibonacci calculations, widely used by professional traders, can be complex when it comes to identifying highs and lows. However, Smart Fibo Zones simplify this process by automatically highlighting order blocks and key zones, compl

The Kijun Sen is a component of Ichimoku Kinko Hyo indicator. The Ichimoku Kinko Hyo is a technical analysis indicator that measures the direction, momentum, and strength of trends in the market , effectively helping traders point out trade signals where possible. Its lines also serve as support and resistance lines that give traders further insight into the market dynamics.
PLEASE CONTACT US for any assistance in the comments section. The Entry criteria used ensures that sniper entries are

Trendline Wizard Overview: The Trendline Wizard is a powerful and versatile MetaTrader 5 indicator designed for traders who rely on trendlines for their technical analysis. This indicator automatically monitors specified trendlines and provides real-time alerts when price action interacts with these critical levels. Whether you’re a swing trader, day trader, or long-term investor, the Trendline Wizard is an essential tool to enhance your trading strategy. Key Features: Customizable Alerts : Set
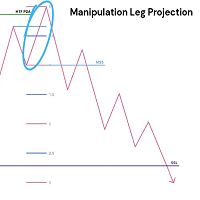
This indicator delves into using standard deviations as a tool in trading, specifically within the Inner Circle Trader (ICT) framework. Standard deviations are a statistical measure that helps traders understand the variability of price movements. These projections is use to forecast potential price targets, identify support and resistance levels, and enhance overall trading strategies. Key Concepts: Understanding Standard Deviations : Standard deviations measure how much a set of values (in thi

Volume Delta Candles offer a straightforward way to analyze trading activity within each candle, making it easier to see what's happening without needing an extra volume indicator. This tool uses lower timeframe or real-time data to show the percentage of buying and selling volume within a candle as a colored bar. Make sure you understand Volume and Volume Delta before jumping in. If you’re not sure, reach out to me first for a quick rundown. But if you're already familiar, you're good to go! Ke
MACD ADX Oscillator – a powerful indicator that combines the best of the Moving Average Convergence Divergence (MACD) and the Average Directional Index (ADX) to provide unparalleled insights into market momentum and trend strength.
Key Features: Dual Momentum Analysis: This indicator merges MACD's ability to detect changes in market momentum with ADX's strength measurement, giving you a comprehensive view of the market's direction and power. Customizable Settings: Tailor the indicator to your t

Percentage Price Oscillator (PPO) for MT5 – a dynamic tool designed to measure price momentum and trend direction with precision. Core Features: Flexible Configuration : Customize the PPO to match your trading approach by adjusting the Fast Length, Slow Length, and Signal Length. The indicator is also versatile enough to adapt to any market condition with various source inputs. Intuitive Histogram Display : Choose to visualize the difference between the PPO and Signal lines with a histogram, pro
Moving Average Crossover Alerts by Chart Walker
The Moving Average Crossover Alerts Indicator is designed to help traders identify potential trend reversals and entry/exit points in the market. By tracking two moving averages—typically a faster (short-term) and a slower (long-term) one—the indicator generates alerts whenever these moving averages cross. Key Features: Customizable Moving Averages: Choose from various types of moving averages (SMA, EMA, WMA, etc.) and set your desired periods for

TheCubeTheory - Seu Indicador de Análise de Mercado em Cubos Descrição Completa O Que é o TheCubeTheory? O TheCubeTheory é um indicador exclusivo para MetaTrader 5 que mapeia os níveis de suporte e resistência usando uma abordagem inovadora baseada em cubos de tempo e Fibonacci . Desenvolvido pela Ethernal , ele combina: Análise de Máximas e Mínimas em períodos personalizáveis Níveis Automáticos (8 níveis ajustáveis) Visualização em Tempo Real com retângulos e linhas col
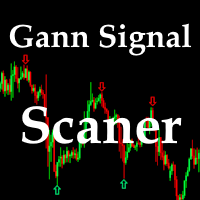
This indicator is based on a certain algorithm and acts as a market scanner. All you need to do is fill in the selected currency pairs in the settings and that’s it. Next, the indicator itself will view all these currency pairs and time frames from M5 to D1 simultaneously. When a new signal appears, the indicator will give you an Alert and also draw the letter N where this new signal will be.

1. What is this Due to the limitation of MT5 software, we can only see the minimum 1-minute candlestick chart. Sometimes this is not enough for high-frequency traders, or we want to see a more detailed candlestick chart. This tool allows you to see: A candlestick chart composed of N ticks, which allows you to better understand the price fluctuations. For example, each candle line has 20 ticks, or 70 ticks.
2. Parameters: NTick = 70; // The tick cnt for one candle BandsPeriod = 20;

1. What is this Due to the limitation of MT5 software, we can only see the minimum 1-minute candlestick chart. Sometimes this is not enough for high-frequency traders, or we want to see a more detailed candlestick chart. This tool allows you to see: A candlestick chart composed of N seconds, which allows you to better understand the price fluctuations. For example, each candle line has 20 seconds, or 30 seconds.
2. Parameters: SecondCandle = 20; // The second cnt for one candle, Needs
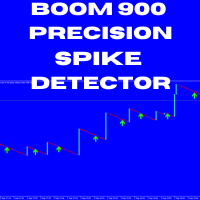
Boom 900 Precision Spike Detector The Boom 900 Precision Spike Detector is a powerful tool designed to help traders accurately identify spike opportunities in the Boom 900 market. With advanced features and precise alerts, this indicator takes the guesswork out of trading, enabling you to maximize your profits with confidence. Key Features: Non-Repainting Signals: Get reliable signals without repainting, ensuring your trading decisions are based on accurate, real-time data. Audible Alerts: Stay
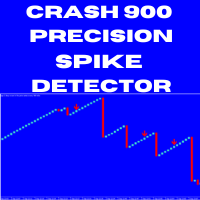
Crash 900 Precision Spike Detector The Crash 900 Precision Spike Detector is your ultimate tool for trading the Crash 900 market with precision and confidence. Equipped with advanced features, this indicator helps you identify potential sell opportunities and reversals, making it an essential tool for traders aiming to capture spikes with minimal effort. Key Features: Non-Repainting Signals: Accurate, non-repainting signals that you can trust for reliable trading decisions. Audible Alerts: Stay
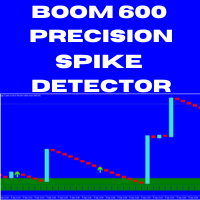
Boom 600 Precision Spike Detector The Boom 600 Precision Spike Detector is your ultimate tool for trading the Boom 600 market with precision and confidence. Equipped with advanced features, this indicator helps you identify potential buy opportunities and reversals, making it an essential tool for traders aiming to capture spikes with minimal effort. Key Features: Non-Repainting Signals: Accurate, non-repainting signals that you can trust for reliable trading decisions. Audible Alerts: Stay on t
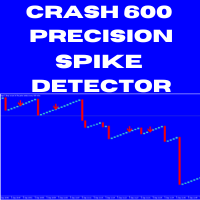
Crash 600 Precision Spike Detector The Crash 600 Precision Spike Detector is an essential tool designed to help traders navigate the Crash 600 market with accuracy and efficiency. Packed with advanced features, this indicator provides precise alerts that allow traders to capture spikes and reversals with confidence. Key Features: Non-Repainting Signals: Dependable, non-repainting signals that ensure your trading decisions are based on real-time, accurate data. Audible Alerts: Receive sound notif

In the context of trading, Malaysia SNR (Support and Resistance) refers to the technical analysis of support and resistance levels in financial markets, particularly for stocks, indices, or other assets traded. This is single timeframe version. Multiple timeframe version is avaiable here . There are three type of Malaysia SNR level Classic , GAP and Flipped 1. Classic Support is the price level at which an asset tends to stop falling and may start to rebound. It acts as a "floor" where demand is
Nadaraya Watson Envelope 멀티커런시 스캐너 MT5 는 여러 통화 쌍과 시간 프레임에서 중요한 반전 신호를 모니터링하는 간소화된 방법을 제공합니다. TradingView에서 정확한 반전 신호로 유명한 인기 지표를 기반으로 구축된 이 스캐너는 동일한 핵심 로직을 MT5 호환 형식으로 변환합니다. 낮은 시간 프레임에서의 단기 기회와 높은 시간 프레임에서의 강한 추세 신호에 초점을 맞춰 트레이더가 시장 전환점에 주의를 기울일 수 있도록 돕습니다. MT4 버전은 여기에서 확인할 수 있습니다: Nadaraya Watson Envelope Multicurrency Scanner MT4 자세한 문서는 여기에서 클릭하세요: 문서 주요 기능: 지표 통합: Nadaraya Watson Envelope 지표를 사용하며, 가격 움직임 주변에 부드러운 엔벨로프를 계산합니다. 트레이더는 Length 파라미터를 조정하여 고려할 바의 수를 정의하고, Bandwidth를 조정하여 평활화를 제어하
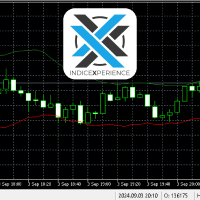
Indicador para mercado de Índice Futuro Brasileiro (WIN) __________________________________________________________________________________________________
O indicador trabalha com rompimento de canal indicando o sentido do movimento e os 3 possíveis TP e o SL baseado no ATR.
Indicação de utilização em TimeFrame de 5M, mas pode ser utilizado em qualquer tempo gráfico de sua preferencia. __________________________________________________________________________________________________

CVB Cumulative Volume Bands: 누적 거래량으로 트레이드를 강화하세요! CVB Cumulative Volume Bands 는 누적 거래량에 기반한 정확한 신호를 찾는 트레이더를 위해 설계된 고급 지표입니다. 이 지표는 누적 거래량 밴드를 사용하여 시장의 매수 및 매도 압력을 명확하게 읽고, 반전 및 강력한 가격 변동을 식별하는 데 도움을 줍니다. 주요 특징: 누적 거래량 분석 : 거래량을 기반으로 주요 압력 지점을 감지합니다.
명확한 진입/퇴출 신호 : 실시간으로 기회를 포착하세요.
쉬운 해석 : 사용자 친화적인 인터페이스와 간단한 시각적 표현.
모든 자산 및 시간 프레임에 적합 : 모든 시장에서 언제든지 사용 가능합니다. CVB Cumulative Volume Bands 로 한 발 앞서 나가며 자신감을 가지고 트레이딩 결정을 개선하세요! 피드백을 남기시고 개선에 도움을 주세요!

This indicator is one of our first brilliant programs, the indicator is quite useful and seems to give the best results when combined with price action, and a combination of oscillators , mainly the Bollinger bands and the moving average , you can also use this on all time frames but be careful on the lower time-frames as the trend is not too steady or rather moves fast, this will help you have better entries.

This is one of our best products available on the market, it will work with every pair you can think of, this ea works together hand in hand with the trend and support and resistance strategy , it will work with all the timeframes and all oscillators , this will amaze you on how best it works and makes trading a whole lot easier you can use this with the rsi oscillator for best results.
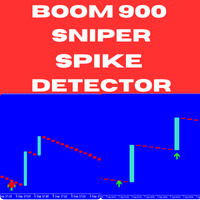
Boom and Crash Sniper Spike Detector - Boom 900 Unlock the potential of spike trading on Boom 900 with the Boom and Crash Sniper Spike Detector. This cutting-edge indicator provides precise and clear signals, helping you identify high-probability trades and capture spikes effortlessly. Designed for traders who want to enhance their trading performance, this tool simplifies the process of detecting spike opportunities. Key Features: Multi-Timeframe Compatibility : The indicator works across multi
This is Multiple Timeframe of Malaysia SNR Levels and Storyline. The single timeframe version here Features: + Display level on multiple timeframe (higher or lower) + Turn on/off level on timeframe + Alert when price touch level 1. if high > resistance level but close of candle < resistance level , this level become unfresh - Name of level will have "(m)" meaning mitigated if close of candle > resistance level , this level become invalid and can be removed in chart (there is setting for keep/rem

This indicator converted from Squeeze Momentum Indicator [LazyBear] version on TradingView [---- Original Notes ----]
This is a derivative of John Carter's "TTM Squeeze" volatility indicator, as discussed in his book "Mastering the Trade" (chapter 11). The Squeeze Momentum Indicator (or TTM Squeeze) is an indicator that measures volatility and momentum, based on price movement within a tight range for a period of time and then breaking out sharply to initiate large moves.
The most popular versi

CustomRSI50 Alert and Mail at Cross - 알림 및 이메일 기능이 포함된 맞춤형 RSI 지표 설명 CustomRSI50 Alert and Mail at Cross는 인기 있는 상대강도지수(RSI)를 기반으로 한 고급 기술 지표로, RSI 레벨이 50 임계값을 교차할 때 즉각적인 알림과 이메일 통지를 통해 자동화된 거래를 간소화하도록 설계되었습니다. 이 지표는 RSI의 명확하고 맞춤 가능한 시각화를 제공하며, 많은 트레이더들에게 모멘텀 분석에서 중요한 50 레벨에 특별히 중점을 둡니다. 주요 특징 50 레벨 교차 시 알림 및 이메일 통지 발송 구성 가능한 RSI 기간 강조된 50 참조 레벨 맞춤 가능한 적용 가격 유형 별도 창에서 표시 쉬운 해석을 위한 0에서 100까지의 고정 척도 맞춤 설정 가능한 매개변수 RSI_Period: RSI 계산 기간 설정 가능 (기본값: 14) applied_price: 계산에 사용할 가격 유형 선택 가능 (기본값: 종가) En
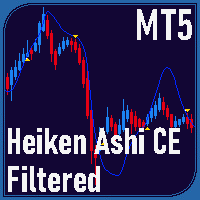
Overview Heiken Ashi CE Filtered MT5 is a technical indicator for the MetaTrader 5 platform. It integrates smoothed candlestick charting with a dynamic exit strategy and a customizable trend filter to deliver clear buy and sell signals. The indicator is designed to improve trend detection and signal reliability by reducing market noise. If you want to see more high-quality products or order the development/conversion of your own products, visit my partners' website: 4xDev
Get 10% OFF on manual
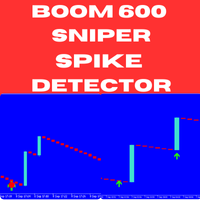
Boom 600 Sniper Spike Detector - MQL5 Listing Description Introducing the Boom 600 Sniper Spike Detector – a cutting-edge, non-repainting indicator designed to help you effectively capitalize on spikes in the Boom 600 market. Ideal for both seasoned traders and beginners, this indicator offers precise, actionable signals to enhance your trading strategy and maximize your profit potential. Key Features: Non-Repainting Signals : Guarantees reliable and consistent signals that do not repaint, provi
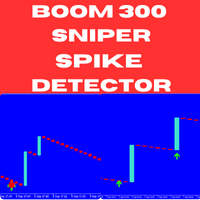
Introducing the Boom 300 Sniper Spike Detector – a powerful, non-repainting indicator specifically engineered to help you master spike trading in the Boom 300 market. Whether you're a seasoned trader or new to the game, this tool offers precise and timely signals, allowing you to catch spikes with confidence and improve your overall trading performance. Key Features: Non-Repainting Signals : Ensures consistent and accurate signals that do not repaint, providing you with reliable data to make con

The Super Trend Extended Indicator is a powerful tool designed to assist traders in identifying market trends and making informed trading decisions. It combines a robust trend-following algorithm with advanced filtering options to provide precise entry and exit signals. Key Features: Trend Identification : The indicator effectively highlights the current market trend, whether bullish or bearish, helping traders stay on the right side of the market. Customizable Parameters : Users can adjust sens

This indicator managge all kind of ICT FVG include: FVG, SIBI, BISI, Inverse FVG. The advantage point of this indicator is mangage FVG on all timeframe. FVG - Fair value gap ICT Fair value gap is found in a “three candles formation” in such a way that the middle candle is a big candlestick with most body range and the candles above & below that candle are short and don’t completely overlap the body of middle candle. * This indicator allow filter FVG by ATR. So you can just show valid FVG which

Certainly. Here's the explanation in English: This program is a custom indicator that calculates the MACD (Moving Average Convergence Divergence) and shows the crossovers between the MACD and Signal lines. Here are the main functions of the program: MACD Calculation: Calculates the difference between the Fast EMA (Exponential Moving Average) and Slow EMA. This difference forms the MACD line. Signal Line Calculation: Creates the Signal line by taking a simple moving average (SMA) of the MACD valu

ZigWave Oscillator: 오실레이터와 ZigZag로 거래를 강화하세요! ZigWave Oscillator는 금융 시장 분석에서 정확성과 명확성을 추구하는 트레이더를 위한 완벽한 도구입니다. 이 지표는 오실레이터의 강점과 ZigZag의 시각적 단순성을 결합하여 최고의 매수 및 매도 기회를 신속하고 효율적으로 식별할 수 있도록 도와줍니다. ZigWave Oscillator를 선택해야 하는 이유 정밀한 오실레이터 분석 : RSI, Williams %R 또는 CCI를 통합하여 시장의 주요 움직임을 포착합니다. 동적 ZigZag와 세밀한 조정 : ZigZag 스윙은 오실레이터의 과매수 및 과매도 영역에서 세밀하게 조정되어 반전 포인트를 명확히 강조합니다. 완전한 커스터마이즈 ️: 오실레이터와 ZigZag의 설정을 조정하여 자신의 전략에 맞게 최적화할 수 있습니다. 직관적이고 사용하기 쉬운 디자인 세련되고 사용자 정의 가능한 시각적 레이아웃으로 Zig

Attention all Boom and Crash traders! Elevate your market monitoring with the cutting-edge RSI indicator, Market Watch . - Customize alert settings for periods, volatility thresholds, and price spikes - Receive voice notifications when your targets are hit - Seamless integration with MetaTrader5 for real-time data
The indicator works on all five Boom and Crash Markets!
Default settings: Number of timeframes: Timeframe 1 - True Timeframe 2 - True Timeframe 3 - True Timeframe 4 - True Timeframe

이것은 바이너리 옵션에 대한 지표입니다. 이동 평균 신호 확인을 통해 Engulfing Candles를 계산합니다. Green Buy 및 Red Sell 화살표가 차트에 표시됩니다.
여러 쌍(EUR/USD, EUR/JPY, USD/JPY...등)을 사용하여 3분 및 5분 차트에서 테스트되었습니다. EUR/JPY OTC 및 EUR/USD OTC와 같은 Pocketoption OTC 시장에서도 작동합니다.
초보자를 위한, 마틴게일을 사용하는 경우 권장 설정은 다음과 같습니다. 초기 투자: $1.00 마틴게일 승수: 2.5 마틴게일 단계: 5
전문 트레이더의 경우, Martingale을 사용하는 경우 위험 관리 전략에 따라 초기 투자가 결정됩니다. 하지만 저는 2.5 Multiplier를 강력히 권장하고 단계를 5로 유지합니다.
지표가 다섯 번째 단계에 도달하지 못할 가능성이 높지만 지표가 매수 및 매도할 수 있는 여지를 스스로 확보해야 합니다.
첨부된 스크린샷을 참조하세요.

CBT Quantum Maverick
고효율 바이너리 옵션 거래 시스템 CBT Quantum Maverick는 정밀하고 간단하며 체계적인 거래를 원하는 트레이더를 위해 설계된 고성능 바이너리 옵션 거래 시스템입니다. 사용자 지정이 필요 없으며, 처음부터 최적화된 결과를 제공합니다. 약간의 연습만으로 신호를 쉽게 마스터할 수 있습니다. 주요 특징: 정확한 신호 제공:
현재 봉 데이터를 기반으로 다음 캔들에 대한 신호를 생성하며, 빈번한 재도색이 없습니다. 다양한 시장에 대한 적응성:
바이너리 옵션 거래에 특화되었으며, 여러 브로커 및 자산 클래스와 호환됩니다. 호환 가능: Deriv Synthetic Charts: 모든 시간 프레임에서 사용 가능. OTC 차트: Quotex, PocketOption, Binomo, Stockity, IQOption, Exnova, OlympTrade, Deriv, Binolla, Homebroker 등의 브로커와 호환(MT5로의 무료 데이터 임
Order Block Tracker is here to solve one of the biggest challenges traders face: identifying order blocks. Many traders fail to spot these critical zones, often missing out on key market entries. But with Order Block Tracker , you no longer have to worry about that. This advanced indicator automatically highlights these crucial zones for you, giving you the confidence to enter the market at the right time. MT4 Version - https://www.mql5.com/en/market/product/123358/ Key Features of Order

If you are unsure how to use this indicator, please feel free to reach out to me. I will explain it to you and provide reading materials to help you make the most of it.
TD Sequential Scanner: An Overview The TD Sequential scanner is a powerful technical analysis tool designed to identify potential price exhaustion points and trend reversals in financial markets. Developed by Tom DeMark, this method is widely used by traders to gauge market cycles and potential turning points with precision. Ho

This new version includes all MT5 timeframes (M1, M2, M3, M4, M5, M6, M10, M12, M15, M20, M30, H1, H2, H3, H4, H6, H8, H12, D1, W1 & MN1). The TD count for each timeframe is displayed on the top left corner. You don't need to do analysis anymore, as the scanner does all the analysis and updates every 1 second, allowing users to see real-time data for informed decision-making. Alerts are set on by default (can be turned off), which notifies users at the completion of every TD9. If you need a sca

This is the best indicator we have created by far, this indicator replicates the well known heiken ashi indicator, but with a more precise entry point, this indicator can work on all time-frames and is strong on all the time frames , this indicator does not repaint nor does it lag , this indicator strategy combined with price action will change your trading experience , elevate your experience to the next level.

This is best binary signal indicator for 1 minute expiry on 1 minute chart window. Buy and Sell arrows appear on previous candle. This is best momentum candle strategy in all markets. Important = Use martingale (if you are not aware of martingale system then first search martingale and learn it ) all forex ___indexs___companies___all timeframes best for binary trading style Thank you...............
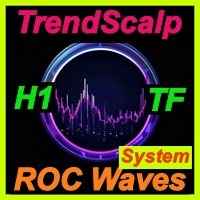
Looking for EA to automate your trading strategy on the Forex market? TrendRocWaves Oscillator — your faithful companion in the world of trading! This manual trading system offers unique features:
- works exclusively on high timeframes (H1,H2,H3,H4) for confirmed response to market changes. - uses the most popular and liquid currency pairs such as EURUSD,GBPUSD with minimal spreads and fast transaction execution. - applies a scalping method based on a medium-term trend to achieve local goals a

JsTrader: Connect MetaTrader 5 with JavaScript JsTrader provides an easy, drag-and-drop solution to connect your JavaScript strategies with MetaTrader 5 (MT5). Using a socket-based communication, your JavaScript script (client) interacts with the MT5 EA (server). It’s tested for real-time trading, enabling fast and efficient integration without the need for both to run on the same computer. Full documentation, including the JavaScript script, EA files, and examples, is available on our GitHub.

This multi-currency annual dashboard analyzes the nearest high and low to the current price for a chosen number of recent years. It displays how many pips away the price is from the nearest high or low. You can set a pip threshold, and the alert will notify you when the price gets close to the specified levels. In real-time, the dashboard also provides an overview of the closest high or low values for each specific year, helping you make informed trading decisions.

Key level analysis : The indicator tracks the nearest annual high and low to the current price over a chosen number of years. Proximity alerts : It triggers an alert when the price reaches a specified number of pips from the nearest high or low. Customizable notification intervals : You can set how often alerts repeat, for example, every 30 minutes. Historical perspective : Enables long-term tracking of market levels and effective planning of trading strategies. Multi-currency support : This ind
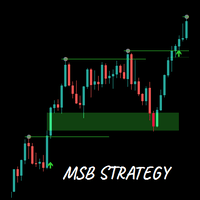
Capitalized on market structure and price gaps
The MSB Strategy indicator identifies swing highs and lows, detects high probability breakouts and price gaps (better knows as FVGs) which when price retests offer high probability entries. The indicator will draw an arrow to mark breakouts and when detected draw a rectangle FVG zone which you can use to define high probability entries. The 200 EMA is included to filter out noise and false signals. Summary of features Alerts on market structure bre
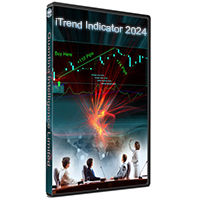
Introducing the iTrend Indicator – a cutting-edge tool designed to provide clear and reliable market insights for traders of all levels. This indicator efficiently analyzes each candle individually, detecting upward or downward momentum with unparalleled accuracy, ensuring you stay ahead of market movements without any redrawing.
Key Features: Accurate Signals WITHOUT REPAINTING: Once a signal is generated, it stays fixed, offering you confidence in your trading decisions. No more second-guess
Triple EMA Trend Following + Signals indicator is a tool for traders who are looking for accurate trend identification and buy/sell signals! Key Features: Triple EMA Trend Analysis: This indicator uses two Triple Exponential Moving Averages (TEMA1 and TEMA2) to capture short-term and long-term trends effectively. TEMA1 reacts to rapid price changes, while TEMA2 filters out market noise, helping you stay on the right side of the trend. RSI and ATR Filters: It incorporates the RSI (Relative Streng
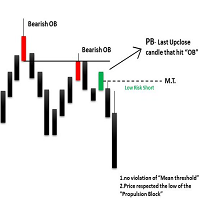
The ICT Propulsion Block indicator is meant to detect and highlight propulsion blocks, which are specific price structures introduced by the Inner Circle Trader (ICT). Note: THIS IS MTF version. Single Timeframe version avaiable at here
Propulsion Blocks are essentially blocks located where prices interact with preceding order blocks. Traders often utilize them when analyzing price movements to identify potential turning points and market behavior or areas of interest in the market.
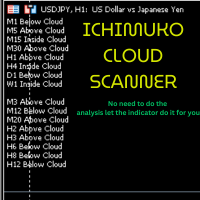
Description of the Ichimoku Cloud Scanner The Ichimoku Cloud Scanner is an advanced MetaTrader 5 (MT5) custom indicator designed to monitor the Ichimoku Cloud system across multiple timeframes and provide visual and audible alerts based on the price's position relative to the Ichimoku Cloud. Here's a detailed description of its features and functionalities: Features: Ichimoku Cloud Calculation : Utilizes the Ichimoku Cloud indicator, which consists of five components: Tenkan-sen (Conversion Lin
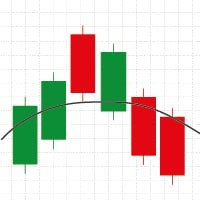
Wilder's Moving Average (Wilder's MA) is a smoothing technique developed by J. Welles Wilder, designed to reduce the impact of short-term price fluctuations and highlight longer-term trends. Unlike the standard Exponential Moving Average (EMA), Wilder's MA uses a unique smoothing factor, which gives it a slower and more stable response to changes in price. The calculation method emphasizes a more gradual adaptation to market changes, making it particularly useful in volatile markets. It helps tr

Our Silver Bullet indicator is designed to help you conduct clearer and more effective analysis based on ICT's popular Silver Bullet Strategy. With advanced tools and customizable features, this indicator enhances your ability to identify trading opportunities.
Key Features: Information Panel: Provides key data for your market analysis: DOL (Daily Objective Level): The target price for the session, where you should focus your trading strategy. DOL Price: The target value of the DOL for the sess
MetaTrader 마켓 - 거래자를 위한 로봇 및 기술 지표는 거래 터미널에서 바로 사용할 수 있습니다.
The MQL5.community 결제 시스템은 MQL5.com 사이트의 모든 등록된 사용자가 MetaTrader 서비스에서 트랜잭션을 수행할 수 있습니다. 여러분께서는 WebMoney, 페이팔, 또는 은행 카드를 통해 자금을 예치하거나 인출하실 수 있습니다.
트레이딩 기회를 놓치고 있어요:
- 무료 트레이딩 앱
- 복사용 8,000 이상의 시그널
- 금융 시장 개척을 위한 경제 뉴스
등록
로그인
계정이 없으시면, 가입하십시오
MQL5.com 웹사이트에 로그인을 하기 위해 쿠키를 허용하십시오.
브라우저에서 필요한 설정을 활성화하시지 않으면, 로그인할 수 없습니다.