 MetaTrader 5
 Experts
 지표
 라이브러리
 유틸리티
 위젯
 규칙
MetaTrader 4용 Expert Advisor 및 지표 - 65
 트레이딩 로봇은 자동으로 시장거래를 수행하는 반면 지표는 가격을 더 잘 분석하고 가격 행동을 예측할 수 있게 해줍니다.
이러한 어플리케이션을 사용하면 MetaTrader 4에서 더 많은 기회를 포착하는 동시에 보다 정보에 입각한 방식으로 거래를 수행할 수 있습니다.

The expert works digitally to open the first deals and Martingale deals And close all together at a profit from win_USD, or close the last profitable trades with the first losing trade until all close together at a profit. There are no complications in the expert’s work, he only works using the Martingale method with the same first lot The method of opening the first deal depends on closing a number of previous candles and dividing by 3 If the outcome number 3, 6, or 9 works to open the first d

Harvest GOLD USES THE TREND WAVE INDICATOR AND IT CAN IDENTIFY THE BEGINNING AND THE END OF A NEW WAVE TREND MOVEMENT.
AS AN OSCILLATOR, THE INDICATOR IDENTIFIES THE OVERBOUGHT AND OVERSOLD ZONES.
IT WORKS GREAT TO CATCH THE SHORT TERM PRICE REVERSALS AND USES A MARTINGALE STRATEGY TO CLOSE ALL TRADES IN PROFIT.
USE DEFAULT SETTINGS ON H1 OR HIGHER TIME FRAME ON ANY PAIR FOR MORE ACCURATE TRADES
WHY THIS EA :
Smart entries calculated by 3 great strategies The EA can be run on even a $30000

Budicon: Beast Mode The Emergence of the Financial Market Beast Only 10 copies left at current price, Final Price is $5,499 Enjoy Prop Firm Mode! With Conservative Mode on, it can handle unto 10 Pairs on $1000 Account Set files for Forex Pairs Available for download In Comment Section. Enjoy Steady Equity curve Growth Take advantage of the News Monster Mode No martingale No Risky Trading Approach Portfolio Diversification as it can trade many FOREX Pairs Proven Trading Strategies Used. D

Features:
Waddah Trend, Explosion Increase/Decrease Trend Percentage with Threshold DeadZone Trend Direction Aligned Checks Highlight and Alerts Multi-Timeframe & Multi-Currency Check out the blog post for more info: https://www.mql5.com/en/blogs/post/758020
With customizable threshold, you can identify best trading opportunities in volume-based trading. Use Trend Height (x times Explosion): Trend height in relation to the explosion signal Trend Percent: Compares the trend height to the maximu
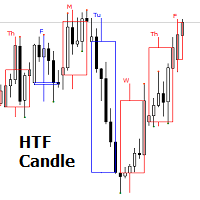
The indicator show Higher timeframe candles for ICT technical analisys Higher time frames reduce the 'noise' inherent in lower time frames, providing a clearer, more accurate picture of the market's movements.
By examining higher time frames, you can better identify trends, reversals, and key areas of support and resistance.
The Higher Time Frame Candles indicator overlays higher time frame data directly onto your current chart.
You can easily specify the higher time frame candles you'd li
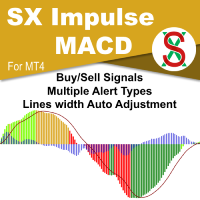
MACD is probably one of the most popular technical indicators out there. When the market is trending, it actually does a pretty good job, but when the market starts consolidating and moving sideways, the MACD performs not so well. SX Impulse MACD for MT5 is available here . Impulse MACD is a modified version of MACD that works very well for trading Forex, stocks, and cryptocurrencies. It has its own unique feature which perfectly filters out the values in a moving average range and enables it t

Elevate your trading game with TigerSignals – the ultimate MetaTrader 4 indicator. Designed for simplicity and precision, TigerSignals provides crystal-clear buy and sell signals, making it a must-have for traders of all levels.
Features: User-Friendly: Easy-to-use interface ensures hassle-free integration into your trading strategy. Alerts: Sound, phone, and email alerts. Receive notifications when a new signal appears, giving you the freedom to step away from the chart! Lot Size Calculato

The Tripl indicator is designed to visually display the current trend in the market. One of the key aspects of currency market analysis is identifying a trend, which is a stable direction in which prices are moving. For this purpose, the Tripl indicator uses calculations that smooth out sharp fluctuations that do not have a significant impact on the overall trend of price movements.
A trend can be either upward (bullish) or downward (bearish). Most often, a trend develops for a long time befor

With the growth of information technology and the increasing number of participants in financial markets, traditional analysis tools are becoming less effective. Conventional technical indicators, such as the moving average or stochastic, in their pure form are unable to accurately determine the direction of the trend or its reversal. Is it possible to find an indicator that remains effective for 14 years without changing its parameters, and at the same time adapts to market changes? Yes, such

30% DISCOUNT ! DISCOUNT ! DISCOUNT ONLY FOR 5 USERS at125$ valid for 1 day only.Grab it The PERFECT TREND HIT creates BUY and SELL perfect trend arrow signals based on ADX EMA AND RSI And all filters inbuilt with accurate trend entries. Furthermore, the indicator and template display the trend direction, strength, and trade recommendation for independent price charts. ROCK WITH THE TREND Moreover, it shows the final trade recommendation to BUY or SELL with all filters and displays that info
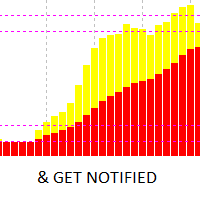
Direct translation of blackcat's L3 Banker Fund Flow Trend Oscillator. Get push notifications on your phone app when a signal bar has formed. Historical signals are shown with buy/sell arrow right on the main chart. Indicator uses two data calculations to check for a cross below 25% level (a signal to go long) and above 75% level (a signal to short). For any further questions feel free to contact me directly. Including requests for product improvements.
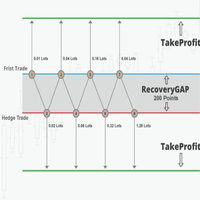
Hello all Expert works in Recovery Zone With the opening of a buy or sell deal at the expense of the general trend with the suspension of a pending deal in multiples With the control of the complications from the multiples box from LO1 to LO20 Control it according to the way you work With closing all together on the target with the arithmetic mean method Working on currency pairs, it is preferable to have a small spread Max Spread = 0.3 Broker link from here Deposit: 5000 USD lot :0.01 https://

Dragon Ball MT4 is newly available with a promotion There are only a few copies left, $599 Next price: $799
Final price: $1599 Real-time live account signals: https://www.mql5.com/en/signals/2361170
The Best Expert Advisor on XAUUSD any timeframes , H4 breakout strategy, The number of orders placed every day is staggering! Dragon Ball MT4 Updated v1.80 !! Important update: Optimized the stability of DB1~DB7 strategy, Merge ET9 's D1 breakout strategy, Add MaxStopLoss and MaxT

The EA Bot strategy was developed with a foundation in market trends, support and resistance, and a hedging strategy. Additionally, it includes an auto-correction feature designed to mitigate risk during periods of high volatility and high-impact news. The EA Bot also incorporates a money management tool to ensure minimal trade entry during market vulnerability. NOTE : See photos attached and follow the settings on it. Settings: CENT 20usd 20,000USD Capital. Standard 100USD to 20,000Usd Capital
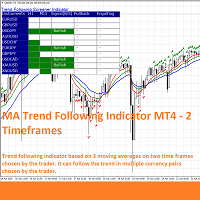
MA Trend Following Indicator for MT4 is a simple technical analysis tool designed to follow the trend in any currency pair chosen by the trader by combining 3 moving averages on two different time frames, one long term and one short term.
It basically provides a bullish or bearish signal when the moving averages on one time frame align with the moving averages on a different time frame to have a confluence signal.
The indicator is presented as a screener with multiple currency pairs (that th
차트 동기화 표시기 - 터미널 창의 그래픽 개체를 동기화하도록 설계되었습니다. TradePanel 에 추가로 사용할 수 있습니다. 구매하기 전에 데모 계정에서 데모 버전을 테스트할 수 있습니다. 데모는 여기 에서 확인하세요. 객체를 다른 차트로 복사하려는 차트에 표시기를 설치하세요. 이 차트에 생성된 그래픽 개체는 표시기에 의해 동일한 기호가 있는 모든 차트에 자동으로 복사됩니다. 표시기는 그래픽 개체의 변경 사항도 복사합니다. 입력 매개변수: Exception - 복사할 필요가 없는 그래픽 객체의 이름입니다. 여러 이름을 지정하려면 세미콜론(;)으로 구분하여 입력할 수 있습니다. 이름이 동일한 부분을 가지는 경우, '*' 기호를 사용할 수 있습니다. 예를 들어, Btn_1453, Btn_7565, Btn_1453은 공통 부분 Btn_를 가지고 있으므로, 필드에 Btn_*를 입력할 수 있습니다. Custom symbols - 그래픽 개체를 복사(동기화)할 추가 기호입니다. 세미콜론(

The "Trend Tandem" indicator is a trend analysis tool in financial markets that helps traders determine the direction of price movement.
Options:
RISK: Determines the level of risk taken into account in the trend analysis. The higher the value, the more aggressively volatility is taken into account. SSP (SSP Period): Defines the period of the moving average used to identify a trend. The higher the value, the smoother the trend signal will be. CountBars: Determines the number of bars on which

The Trend Seeker indicator is perfectly suited for tracking long-term trends in the Forex market and can be used without restrictions on instruments or time intervals. This indicator allows attempting to forecast future values, but its main application lies in generating buy and sell signals. The AlphaTrend Seeker tracks market trends, disregarding sharp fluctuations and noise around the average price. It is based on the idea of technical analysis, asserting that the market has a cyclical n

MasterMA
Forex Robot https://www.mql5.com/go?link=https://youtu.be/2wCzTFIGNp4 There are 3 Moving averages included
Is an fully automated Forex Robot for MT4 Terminal Trading. The default settings are already profitable. But you can test and adjust the files to your needs.
There are more then 5 Indicators built in to filter as much as possible,
You can also join the Telegram Channel and Group https://t.me/ +rbMoGQwS0WdjNGU0 https://t.me/+Ft3Q8y4akvxjN2Jk
10

The Forex Correlation Indicator is a powerful tool designed to analyze and display the correlation between different major forex pairs in the market. This indicator helps traders identify relationships and trends between currency pairs, allowing for more informed trading decisions. Key Features: Displays correlation coefficients between pairs. Visualizes correlation strength through color-coded indicators. Customizable settings for timeframes and correlation calculations. User-friendly interfac

The Precision Navigator EA is a powerful trading assistant tailored for Forex, gold, and oil markets, aiming to maximize profitability with minimal risk exposure. Built on a robust combination of technical indicators including RSI, Stochastic Oscillator, and moving averages, this expert advisor optimizes trading strategies by identifying key trend reversals and momentum shifts. Enhanced features like dynamic lot sizing based on predefined risk levels and optional trailing stop functionality ensu

*OPTIMIZE THIS EA BEFORE TEST, MAKE SURE IT WORKS FOR YOU BEFORE PURCHASE Once upon a time, in the bustling streets of Wall Street, there existed a sophisticated algorithm known as the "MOMENTUM PRO" Trader. This digital entity was not just any ordinary piece of code; it was equipped with a repertoire of a feed forward neural network that gave it a keen insight into the ever-shifting dynamics of the financial markets.
At the core of its decision-making process lay the moving averages (MA) and

Several experts in one expert
With this expert, you can use several up-to-date strategies
Enhanced with artificial intelligence
Can be used in several popular forex currencies
Can be used in the most popular forex time frames
Without using high-risk strategies
Attributes : Can be used in the EURUSD , GBPUSD , USDCHF , AUDUSD , USDCAD , NZDUSD currency pairs Can be used in M30 , H1 , H4 , D1 time frames Has profit limit and loss limit Without using risky strategies like martingale or hedge Acco

Channel indicator, written according to a strategy based on indicators: BollingerBands, Moving Average, RSI and TMA. The indicator embodies arrow signals for the trend, counter-trend, and also for fixing transactions. And also all possible alerts. The indicator is ideal for working together with a trend indicator for taking profits. All settings are on screenshots.

The Trend_Scalper_Arrows_Entry&Exit trend indicator perfectly follows the trend, indicates entry search zones, indicates entry signals with arrows, and also indicates zones for fixing market orders with vertical lines. An excellent indicator for both beginners in Forex trading and professionals.
All lines, arrows, alerts can be disabled.
See all indicator parameters on the screenshot.
Trend Master Chart는 귀하에게 필요한 추세 지표입니다. 차트를 오버레이하고 색상 코딩을 사용하여 다양한 시장 동향/움직임을 정의합니다. 두 개의 이동 평균과 서로 다른 오실레이터를 결합하는 알고리즘을 사용합니다. 이 세 가지 요소의 기간은 수정 가능합니다. 모든 시간대와 모든 쌍에서 작동합니다.
한 눈에 상승 또는 하락 추세와 이 추세의 다양한 진입점을 식별할 수 있습니다. 예를 들어 뚜렷한 상승 추세(밝은 녹색) 동안 이 추세 내의 다양한 시장 충동은 짙은 녹색 양초로 표시됩니다. 구성 가능한 경고를 사용하면 이러한 충동 중 하나를 놓치지 않을 수 있습니다.
MT5 버전.
입력 매개변수:
Period 1: 빠른 기간 이동 평균.
Period 2: 느린 기간 이동 평균.
Oscillator period: 오실레이터 기간.
Sell/Buy alert: 시장 충동 경고, 추세 진입점.
Bullish/Bearish alert: 추세 변화가 있을 경우
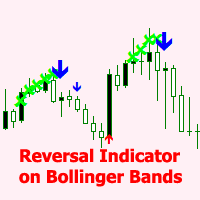
The BB Reversal Arrows technical trading system has been developed to predict reverse points for making retail decisions.
The current market situation is analyzed by the indicator and structured for several criteria: the expectation of reversal moments, potential turning points, purchase and sale signals.
The indicator does not contain excess information, has a visual understandable interface, allowing traders to make reasonable decisions.
All arrows appear to close the candle, without redrawin
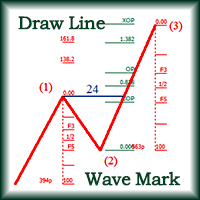
About Line Drawing: ( 1) Select Line Type Zigzag Line Fibo Horizontal Trend Line Range Line Price-Time Net ( 2) Set Line Style To set line color built-in or style and width just by clicking certain button To set line color to user color by clicking the second color button of second line when it is pressed ( 3) Start Drawing If you have not pressed any of those Drawing-Type-Button(HL/Rng/Net/Fibo),when you select the Line-Color-Button or Line-Style-Button or Line-Width-Button it will draw Zi

Introducing High Probability SARs, a classic Forex indicator designed to enhance your trading strategy with its advanced analysis capabilities. High Probability SARs utilizes sophisticated algorithms to identify potential trend reversals with precision. By incorporating the Parabolic SAR indicator, it offers traders valuable insights into market dynamics, allowing for informed decision-making. This innovative tool provides traders with signals based on the Modified parabolic SARs, helping to ide
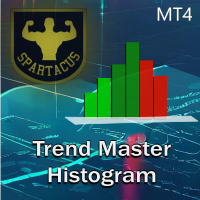
Trend Chart Histogram is an indicator based on an algorithm using two moving averages and several oscillators. Thanks to its color code, it allows you to quickly identify the trend and take advantage of the biggest market impulses. Light colors indicate the trend, dark colors define impulses and gray indicates that you should not enter the market. It will be a very good ally in your decision-making, combined with your other indicators.
MT5 version here.
Input parameters: - Period 1 (fast perio

Introducing FxArk Viper system - a powerful Forex trading tool that scalps and hunts the market for small profits using the true and tested moving average strategy
The system is able to run on any time frame, though its advised to run on the lower time frames where it performs the best, the system parameters are also customizable, it implements a grid method along with martingale [which can be disabled if the parameter is changed to 1].
We highly recommend you to the test the EA on demo first

Introducing Genius EA Creator for MetaTrader 4: Simplify Your Automated Trading Like Never Before Ready to automate your trading without worrying about coding? Genius EA Creator for MetaTrader 4 is here to transform the way you trade by offering a flexible and powerful platform that anyone can use. Whether you’re a beginner or an experienced trader, you’ll appreciate how this tool allows you to design and execute strategies tailored to your needs—no programming skills required! Key Features and
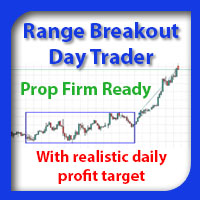
Introducing the Range Breakout Day Trader. This Expert Advisor only trades during the day (European time). This EA uses proven strategies and doesn't use high risk Grid, Hedge or Martingale recovery strategies. This EA shows that safe and reliable automated trading systems don't need to cost that much. Price: 179.00 USD Prop Firm Ready For the manual and set-files: Click here This carefully crafted Expert Advisor opens one position every day after a range has been set between 1:00 and 6:50 AM (

Advanced Currency Strength Indicator Comprehensive Market Analysis in One Tool User-Friendly and Versatile for All Traders This indicator simplifies market analysis by evaluating the strength of 28 forex currency pairs, along with Gold, Silver, and other selected instruments. By using a Triangular Moving Average (TMA) and ATR-based bands , it provides a structured view of market movements, assisting traders in making informed decisions. Identify Market Trends Efficiently The indicator helps ass
The indicator determines the state of the market (trend or flat) using the upgraded Bollinger Bands of higher timeframes and colors the bars in trend/flat colors. The indicator also gives signals (arrow on the chart + Sound and notification to Mail, Push):
signal at the beginning of every new trend; signal inside the trend (entry at the end of the correction) Signals are never redrawn!
How to use the indicator? The indicator works very well intraday. When using the indicator for intraday (TF M

Product detailed post: https://www.mql5.com/en/blogs/post/756962
Get free demo from the link in above post.
Features: - Multi Heiken Parameters
- Alerts & Highlights for Heiken Switch
- Heiken Alignment Alerts
- Multi-timeframe Alignment Alerts
- Multi Currency
Heiken Explained: Heiken Settings: All comma separated lists will be used for different heiken ashi's. Example: 5,40,188 will mean that MAPeriod1 in 1st heiken will be 5; In 2nd heiken will be 40 and in 3rd heiken ashi will be 188. 1,1
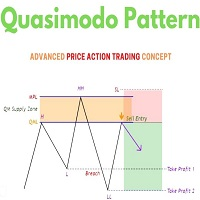
Introduction
One of the patterns in "RTM" is the "QM" pattern, also known as "Quasimodo". Its name is derived from the appearance of "Hunchback of Notre-Dame" from Victor Hugo's novel. It is a type of "Head and Shoulders" pattern.
Formation Method
Upward Trend
In an upward trend, the left shoulder is formed, and the price creates a new peak higher than the left shoulder peak . After a decline, it manages to break the previous low and move upward again. We expect the price to

The Trendline Trader indicator is designed to reliably track market trends, ignoring sharp fluctuations and noise in the market. This indicator is suitable for trading on both short and long time intervals due to its ability to filter out sudden price spikes and corrections. It is based on the iLow, iHigh, iMA and iATR indicators, which makes it particularly reliable.
Parameters for setting up the indicator: Length: period for channel calculation and noise filtering. Star: period for determini

TrendTrack indicator: Stay on trend easily!
The TrendTrack indicator is designed to analyze price behavior in the Forex market, helping the trader to quickly spot temporary weaknesses or obvious changes in trend direction. Entering the market is only the first step, but maintaining a position is more difficult. With TrendTrack, staying on trend becomes easy!
Peculiarities:
Trend Analysis: The indicator analyzes historical data, providing signals to the trader. The arrow format of the indicat
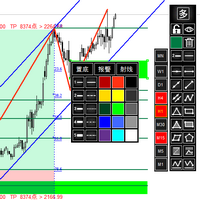
1. Compound Drawings (1) Line segment with arrow (2) Continuous line segment (broken line) (3) Parallelogram (4) Polygon (5) Profit and loss ratio measurement tools
2. Backtracking By the Z key in the process of drawing the line Line types that support Z-key backtracking: continuous line segments (broken line) ,channels,parallelograms,polygons, and fibo extensions.
3.Automatic Adsorption (1) Click the "Lock-Button" to switch the automatic adsorption switch before drawing the line (2) The

The Market Sentiment Meter indicator calculates the saturation levels of the price chart. A signal to exit the oversold zone indicates a buying opportunity, and a signal to exit the overbought zone indicates a selling opportunity. Typically, for this indicator you need to set relative values for the overbought (Top) and oversold (Bottom) levels.
Often a good trend can be seen visually on the price chart. However, an experienced trader must clearly understand the current distribution of forces
Introducing the Reversal and Breakout Signals
This innovative tool is crafted to enhance your chart analysis by identifying potential reversal and breakout opportunities directly on your charts. It's designed with both novice and experienced traders in mind, providing intuitive visual cues for better decision-making. Let's dive into the key features and how it operates:
### Key Features:
Dynamic Period Settings: Customize the sensitivity of the indicator with user-def

The TrendTide indicator provides accurate signals about potential market reversals. Its primary purpose is to generate signals for entering and exiting trades. Determining the current market trend is a critically important aspect for traders. The intelligent algorithm of TrendTide efficiently identifies trends, filters market noise, and creates precise entry and exit signals.
This indicator represents an advanced algorithm for visualizing the market trend. It is designed to identify both long-

The SignalSailor indicator is your reliable assistant in Forex for quick market analysis. It not only reflects the current market condition but also provides valuable signals about the best times to open trades. Market conditions are constantly changing, and to stay ahead, a trader needs to quickly adapt their strategies. This is precisely why the Klaus indicator was created - it will help you accurately determine the direction of the trend on the price chart.
SignalSailor is an indispensable

In the world of trading, one of the main concerns is finding a reliable trading system. Meet the TrendEdge Channel indicator - your reliable companion in this search. Developed based on complex mathematical calculations, this indicator predicts the most likely short-term price movements.
TrendEdge Channel is designed specifically to identify trends in price movements. Thanks to it, you can quickly determine not only the direction of the trend, but also the levels of interaction between buyers

Trop is a trend indicator that has several important advantages. It helps to pinpoint both new and existing trends in the market. One of its key advantages is its quick adjustment and responsiveness to changes in schedule. The effectiveness of the indicator depends on the set CalcBars period. The longer this period, the smoother the indicator displays the trend line. On the other hand, as the period decreases, the indicator takes into account more market noise, which can be useful in generating

This indicator is a simple trend line indicator.
The upper trend line is the highest price of 60 past candlesticks, the highest price of 30 past candlesticks,
The bottom line is the trend line that connects the lowest price of 60 past candlesticks and the lowest price of 30 past candlesticks.
*The color of the trend line is white.
Notes
This indicator is created with the above configuration, so if the highest and lowest prices of the past 60 candlesticks and 30 candlesticks are the same,
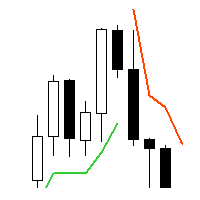
Supertrend - невероятно мощный и универсальный индикатор, предназначенный для помощи трейдерам в определении текущего тренда на конкретном торговом инструменте. С помощью двух встроенных индикаторов, Average True Range и Standard Deviation, трейдеры могут выбрать наиболее подходящий индикатор для своей стратегии торговли. Пользователи также могут настроить период этих индикаторов и выбрать цену (Close, High, Low, Open, Weighted), к которой он должен быть применен, с Typical price в качестве опци

Introducing Follow GOLD EA , the innovative MQL4 expert advisor transforming trading with the prestigious XAUUSD pair. Developed by a team of experienced traders with over 5 years of trading experience.
Follow GOLD EA utilizes a unique strategy where it follows the pair's trend, calculating the lot size based on a chosen risk percentage. This means that every time the EA executes a trade, the lot size is recalculated to contain the risk to protect the balance and achieve significant profits by

Our Expert Advisor (EA) revolutionizes trading in the Forex market by integrating two powerful strategies - Scaling and Averaging - into a dynamic and adaptable framework. Designed for the MetaTrader4/5 platform, this EA employs innovative techniques to optimize trading outcomes in various market conditions. Metatrader5 Version | Auto Smart Pro MT4 Live Results | All Products | Contact | How to install MT4 Product
Scaling Strategy: The Scaling strategy capitalizes on trending market move
OVERVIEW
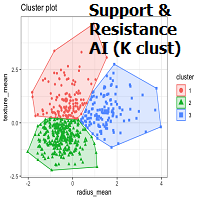
K-means is a clustering algorithm commonly used in machine learning to group data points into distinct clusters based on their similarities. While K-means is not typically used directly for identifying support and resistance levels in financial markets, it can serve as a tool in a broader analysis approach.
Support and resistance levels are price levels in financial markets where the price tends to react or reverse. Support is a level where the price tends to stop falling and m

Adaptive Market Dynamics Indicator (AMDI) is an innovative tool for traders across all financial markets. This indicator is designed to provide traders with a deep understanding of market dynamics and adaptive trading signals based on current market conditions. Key Features and Benefits: Adaptive Analytics : AMDI can automatically adapt to changing market conditions, allowing traders to effectively adjust their strategies in real-time. Multifactor Analysis : The indicator offers a comprehensiv
Summer Sale: 50% OFF!!! Promotion is valid until 08 August 2025! This indicator is unstoppable when combined with our other indicator called Katana. After purchase, send us a message and you could get Katana for FREE as a BONUS After purchase, send us a private message for your instructions. The Trend Forecasting indicator is a very unique & easy tool that is able to make prediction about future price movement based on the signals generated by MACD . It helps you have an estimation on the are

The RSI Advanced tool will help traders capture trends and optimal entry points by:
- Enter a Buy order when the green line crosses the yellow line. Provided that the yellow line is near line 32 or 20 - Enter a Sell order when the green line crosses the yellow line. Provided that the yellow line is near line 68 or 80
Additionally, you can combine it with the convergence divergence that occurs at the green line. **When you purchase the Mastering the RSI MT4 or Mastering the RSI MT5 indicator,
---Bar Open Time Trading--- Most of the EA in the market, it is often the case that trades are executed at the beginning of each bar, known as "Per Bar." We can infer the future trend in the first few seconds of each bar. Let the bullets fly! This EA compares the opening price of each bar with the price "after a few seconds" to make trades. This EA is suitable for all markets, including gold, indices, forex, and more. Let's explore different strategies for various markets and time periods. Have

The Practitioner indicator is based on a unique algorithm for analyzing price behavior and presents the result of this complex work in the form of lines. One of the advantages of this indicator is that it automatically changes the color of the line according to the current direction of the price movement.
It is important to note that the indicator has an option to enable alerts when the line color changes. This gives the trader the opportunity to quickly respond to changes and identify new tre

The expert works digitally to determine the trend and suspend trades while controlling it from Step While pursuing profit using the Trailing Stop Work on a number of currency pairs together with the same settings It is preferred to work on the M5 timing Max Spread = 0.3 Broker link from here
https://one.exnesstrack.net/a/lmeqq9b7 arameters:
Lot1: Manual Lot Size Auto_Lot: Set true to automatically calculate optimal Lot Size based on risk preferences, Set False if you want to use manual lot si
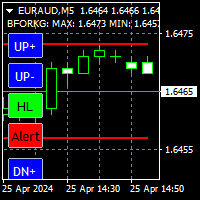
Very useful indicator, you won't be able to be without it. Essential for scalping. It shows rebound levels, top and bottom, forming a fork that surrounds the price. Each level has two blue controls associated to change it, has one green control for rebound mode: High/Low or Open/Close, and has a red breakage alert control. Features: -T wo independent modes of operation: High/Low, Open/Close. -When one level is broken it shows the next one in the same direction. -The levels closest to the pric
The indicator for Forex and Binary Options trading is based on the standard Mt4 Simple Moving Average indicator. But the difference from the standard indicator is that its lines are repainted in different colors depending on the state of the trend. If the color is green, then the trend is to buy. If it's red, then it's for sale. During a trend phase change, an audio alert appears along with a buffer on the chart in the middle of the lines. Thus, it is possible to determine the state of the trend

Overview
The Volume SuperTrend AI is an advanced technical indicator used to predict trends in price movements by utilizing a combination of traditional SuperTrend calculation and AI techniques, particularly the k-nearest neighbors (KNN) algorithm.
The Volume SuperTrend AI is designed to provide traders with insights into potential market trends, using both volume-weighted moving averages (VWMA) and the k-nearest neighbors (KNN) algorithm. By combining these approaches, the indicator

Introducing an Incredible EA!
Witness its outstanding performance, particularly on XAUUSD with the H4 timeframe.
This EA excels at identifying market trend angles.
When it spots a significant angle, it swiftly enters a trade, maximizing profit potential.
Rest assured, the default settings have been meticulously optimized for XAUUSD, ensuring optimal results.
Get ready to elevate your trading experience and unlock new possibilities with this remarkable tool!
<EA parameter input manual>
1.

In addition to understanding market trends and logic, surviving in the forex market requires a grasp of risk management, discipline, and a sound trading strategy. While the Grid EA you mentioned may offer a simplified approach, it's important to note that relying solely on grid trading without a deeper understanding of market dynamics and risk management could be risky. Grid trading strategies involve placing buy and sell orders at regular intervals or price levels, aiming to profit from market
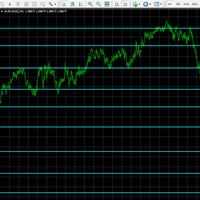
A powerful chart indicator which intelligently analyses Index, FX & Commodity prices to identify the strongest support and resistance price boundaries. Each line shows where prices consistently close, while the frequency of these matching prices is quoted to reflect each boundary strength. Use these predictive boundaries to identify pivot points, resistance and support levels for crossover, trending, reversal and channel strategies. For FX pairs, set volatility filter = 1 For Indices & Commodit

Welcome! We are delighted to introduce our latest expert, which is a semi-automatic trading system that includes all the features you need for position management. Simply draw a line on a significant trend or supply-demand level, and the expert will take care of the rest for you. It comes with a wide range of risk management and position management tools, such as trailing stop, partial closure, break even, determination of stop loss and take profit levels using ATR, as well as automatic lot sizi

Currencies Hunter is a new era of trading the most unique expert for trading currencies use very secretive trading algorithm , took a year to program and test it with a lot of coding ,Currencies Hunter designed to trade on real accounts and provides exceptional results. trade in fully automatic Currencies Hunter use very special algorithm you can make back test with every tick option and see the results by your self this expert use unique strategy to open order and close it Therefore

Our support and resistance levels help to determine the reversal of the market price, fully track the trend, and also fix the profits in a timely manner. Support and resistance levels can also determine trading ranges. When you hover your mouse over the upper right corner of a level, a hint with a description of the level pops up. To avoid cluttering the chart, levels disappear after breaking through.
Input parameters: WPR_Period = WPR period UpLevel = WPR top le

Smooth Heikin Ashi provides a more smoothed signal of bull or bearish trends than regular Japanese candlesticks, or even the standard Heikin Ashi candles. Heikin Ashi as an alternative candlestick pattern that has been in use since its invention in Japan back in the 1700s. On normal Japanese candlesticks, there is a lot noise with mixed bearish and bullish candles side by side, even during trends. Heikin Ashi reduces this noise leaving an easier visual representation of trends. This indicator is

The " Vertical Levels " indicator for the Forex market is a tool for displaying vertical levels on a price chart. These levels can be useful for a trader, as they help identify significant points in price movement and potential reversal or trend continuation zones.
Peculiarities:
Vertical Levels: The "Vertical Levels" indicator allows you to display vertical lines on the chart, indicating certain levels. These levels can be adjusted using input parameters. Setting options: Length : Length of

Introducing the GlobalMarketNavigator EA, a cutting-edge trading tool designed with the modern trader in mind. Developed by Azad Gorgis and backed by rigorous market analysis, this Expert Advisor is your gateway to navigating the complex terrains of forex, gold, and oil markets with unparalleled precision and efficiency. Elevate Your Trading Experience with Precision, Automation, and Expertise
For:
Gold = 15M, RSI = 16 or 11 Oil = 30M, RSI = 11 CAD/CHF = 15M, RSI = 11 NZD/CAD = H1, RSI = 11 RSI

an EA that use 3 Moving Average or Bollinger Bands indicators. You can choose one and setup the indicator selected as you wish. Moving averages and Bollinger bands is one of powerful indicator. The recommendation to uses the main trend to enter the market, H1 or H4 timeframe for identifying the trend. and you can uses a short timeframe to enter the market and setup how the EA allowed trade direction (Buy only, Sell only, or both) within short time frame. The EA have : - Take Profit and Stop Lo
트레이딩 전략과 기술 지표를 판매하기에 가장 좋은 장소가 왜 MetaTrader 마켓인지 알고 계십니까? 광고나 소프트웨어 보호가 필요 없고, 지불 문제도 없습니다. 모든 것이 MetaTrader 마켓에서 제공됩니다.
