MetaTrader 4용 Expert Advisor 및 지표 - 289

TargetX of the best Forex indicators, which is equipped with the most modern, adaptable and profitable trading algorithms. It is time to stop wandering in the dark and gain a clear vision of goals in intraday trading, for which this indicator was created.
One of the secrets of short-term trading is to know when to enter a trade. At the same time having the potential to earn the maximum number of points, but without unnecessary sitting out in the transaction in the hope of a ghostly profit. And

The SpecialBands indicator works equally well on any timeframe. For trends of average duration, it is recommended to use the standard setting. For the analysis of short-term trends, it is better to use a smaller indicator value. For the study of long-term trends it is recommended to use the indicator value greater than the standard.
Most often, the exponential method is used to calculate the indicator, but other varieties can also be used.
SpecialBands is a collection of lines. The two central

An ADX indicator based expert adviser taking a trade when ADX is more than 50. Follows trend to maximum and reverses. Lesser trades with overall profit as tested in strategy tester on EURUSD and USDJPY hourlies. Closes all trades and takes a trade in opposite direction on change of trend. There is a total profit message in journal on closing EA. Significant returns without leverage in strategy tester.
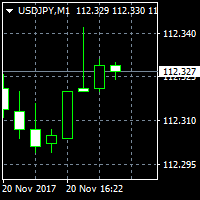
Based on candlesticks patterns. Different candlesticks patterns included with buy and sell on pattern recognition without stoploss and limit. Sell at peaks and buy at bottoms or follow a trend. A simple EA based on century old chart patterns. EA also uses extensions to established patterns and takes more than one buy or sell trades following a buy or sell trade and closes all previous buy or sell trades on a reverse pattern.

FairyFibo can generate as many as 70 different BUY signals and 70 different SELL signals solely based on Price Action and Fibonacci levels. The idea is to catch as many as Swing High's and Swing Low's but with the consideration of the current trend mind. This indicator can be also used for Binary Options Trading as most of the time price tends to follow the signal direction immediately. Most of the strategies are already optimized for different time frames and different market conditions. While

A trend following expert adviser with a trade every candle with stop loss and profit target. Profitable on 10 years hourly historical data and year 2017 separately. Can be run on 15 minutes as well with a higher stop loss multiple. There is a total profit message in journal on closing EA. Can be easily tested in strategy tester on different currency pairs on different time frames varying profit target and stop loss multiple.

Советник совершает сделки по сигналам индикаторов из стандартного набора терминала, которые можно включить или отключить в соответствующих настройках советника. Для закрытия ордеров используются два типа, по достижению установленной цели или по обратному сигналу при условии что вся серия сделок находиться в прибыли. Для вычисления объема следующей сделки также используется несколько вариантов. Описание входных параметров: Identification number - Идентификационный номер советника Panel - Включить

Gold Rain Expert Advisor Gold Rain is a completely automated instrument for all-day trading. Trading instruments: all, recomended - XAUUSD, EURUSD, GER_30(Germany 30 Cash index) Timeframe: any, recomended M30, H1 Time of trade: 24/5 (recomended to limit trade hours at night when spread is high) Strategy: scalping at braking of strong price levels, braking levels are determined by built in indicator, use no martingale, no grid, no everaging Description of settings: trading hours - time of trad

The advisor NewsCatcher Visual automatically downloads actual data from 2 economic calendars: investing.com or mql5.com . The advisor can work in the "autoclick" mode, that is it can open trades automatically by comparing actual and forecast values. It also allows to manually open both instant and pending orders with a set volume.
Recommendations
By default the advisor NewsCatcher Visual applies the "autoclick" strategy to all events of high volatility. This allows the advisor to work in the fu

The expert DSC AI GRID MTG is a expert that has an advanced system to authorize or not the opening of new trades, differentiating when to open orders by the Grid and also which system of Martingale to use. With that he manages to pass the long-term backtest. Drive with backtest e sets: https://drive.google.com/open?id=11ckmsl7HVA_sKx_F0AtvAjsCToZZhZ_M
Before running the Robot in real account, see what minimum capital you will need for when the Robot goes through the most complicated periods in

Robonacci USDJPY is the Second addition to my ROBONACCI EA Series. Like other ROBONACCI EA's this one also has the similar core features. The strategies are developed in a way that the EA should survive continuously. Using various Fibonacci levels extensively the EA decides which price action to take in account depending on various market conditions. It deals with only one trade at a time and maintain strict money management rules.
Product Home Page: https://www.mql5.com/en/market/product/351

Trading King MT4 Expert Advisor의 고급 버전. 사용된 지표: ATR, RSI, Stochastic, CCI, WPR, DeMarker, RVI. 각 표시기는 선택적으로 켜짐/꺼짐으로 사용할 수 있습니다. MT5 버전은 여기에서 사용할 수 있습니다.
설정 파일 및 최적화 결과는 어드바이저의 토론에 게시됩니다.
Expert Advisor의 전략은 추세의 강도를 평가하고 수정 / 반전 포인트를 찾는 것을 기반으로 특정 기간 동안 시장의 상승과 하락의 절대 값을 비교합니다. 필터는 뉴스, 시간, 스프레드 확대, 변동성 증가, 미끄러짐 및 요일에 사용됩니다. 전략은 단기 거래를 사용합니다 - 마틴게일을 사용하지 않는 야간 스캘핑
FIFO 요구 사항이 있는 미국 중개인을 포함하여 모든 중개인과 작업하는 데 적합합니다. 모든 주문에는 가상 손절매가 수반되며 핍으로 이익을 얻습니다. 차트는 지표의 다양한 정보와 지표를 표시합니다. 권장되는 최소 보증금은 0.01랏당
Multiple Indicators for Major Currencies
The purpose of this indicator is to save time to detect more good trading opportunities by scanning all 28 cross currency pairs of AUD, CAD, CHF, EUR, GBP, JPY, NZD and USD in the same time. There are 5 indicators included in this indicator which are CCI, RSI, Stochastic, MACD and the different between plusDI and minusDI of ADX (PlusDI-MinusDI). The indicator can help in determining the following properties of each currency depending on which indicator w

Подкрашивает аномально большие тиковые объёмы в красный цвет. Имеет следующие настройки: "Процент" по умолчанию "70" (Процент на который аномальный объём должен быть больше предыдущего) "Уровень" по умолчанию "500" (Количество тиков, больше которого будем брать во внимание аномальный объём) Внимание! Данный индикатор был разработан для мелких таймфреймов M1,M5,M15. Идея в том, что на таких Таймфреймах увеличение количества тиков говорит об увеличении количество сделок, увеличения интереса к цен
Dawn In Trading indicator is a new ray of light in trading! This indicator has been tested on a real chart in real trading; All statistics about this indicator from real trading on the market! From the screenshots you can see the profitability of quality and the number of signals of this tool, you can also check it in the tester! As soon as a blue arrow appears, open a deal to increase, when a red arrow appears, open a deal to fall!
Signals appear when you open a new candle and do not redraw, t

Big Scalper Pro комбинированный осциллятор, отображающий на ценовом графике Сигналы на вход отображаются в виде стрелок соответствующего цвета, а также дублируются текстовым сообщением. есть звуковые и текстовые алерты push уведомления уведомления на email все это можно включить и выключить в настройках индикатора настройки период это период г л авного индикатора в период это период дополнительного индикатора волатильности

This EA is suitable for everyone who need to generate cashflow from main portfolio by taking less risk. EA will help you to calculate risk parameter per order and trade Long position ONLY. How to use EA effectively Firstly, You have to define your trading zone which you need to trade and You have to DEFINE 1.Upper and lower limit Price which you need to trade.
2. Number of order which you trade and lot size of each order
3. Your initial Balance
4. STOP OUT Percentage 5. IMPORTANT THING is

This is the full version of HawaiiFree , a fully automated expert based on price action. For backtest use tickstory with fixed timeshift like gmt +0 without DST option activated, set current_broker_gmt parameter to the gmt of your backtest time shift. My Tickstory time shift setup
For demo, put on EURUSD H1 chart set current_broker_gmt parameter to the current broker gmt shift. Simple and safe , no grid, no hedge, no martingale and Stoploss is always set. You could expect 1 trade by day. Low sp

По факту вы выставляете виртуальные Buy Stop и Sell Stop которые срабатывают после закрытия свечи. Данный помощник позволяет заранее выставить уровень Stop Loss и Take Profit. Так-же имеется демо режим для предварительного расчёта параметра риск/прибыль. Помощник имеет следующие настройки "Лот" по умолчанию "0.01" "Проскальзывание" по умолчанию "60" (Значение в пунктах) "Номер Ордера" по умолчанию "0" (Магический номер ордера) "Цвет Комментариев" по умолчанию "Black" "Шрифт

Grid Halo 2 - the adviser uses one indicator, and the neural network to search for signals to enter. Works in fully automatic mode! You do not need any settings, you can use the default settings. The bot passes the historical gap for the 19-year period from 2000 to 2019. Unlike alternative developments, this bot can simultaneously trade both on buy and on sell. That is, it has two independent systems of analysis. This is a significant advantage in real work because it gives the opportunity to

Скрипт открывает графики по всем инструментам находящимся в окне "Обзор рынка" и по желанию может задать для всех графиков один шаблон. Так-же можно удалить все графике открытые в терминале Мт4. В скрипте имеются следующие настройки: "Таймфрейм" по умолчанию M30; (Можно поставить свой: M1, M5, M15, M30, H1, H4, D1, W1, MN.) "Задержка" по умолчанию "0"; (Задержка перед открытием следующего графика в миллисекундах.) "Шаблон" по умолчанию "True"; (True=пр

ArcTrend - The indicator should be used to enter the market, it looks like two moving averages, but this is only a first impression. The algorithm for calculating the indicator is completely different and quite complex. When using the indicator, use either the feet or the filter in the flat. Do not use take profit to close, it is much better to use a trailing stop. Indicator without parameters.

The Invisible Sniper arrow indicator is built on the use of candlestick analysis. The indicator finds the “Absorption” reversal candlestick patterns on the price chart and, depending on the figure, bullish or bearish absorption, gives a signal to enter in the form of blue arrows to buy, red to sell. in the indicator Invisible Sniper implemented sound and text alert..

the expert Advisor is an artificial intelligence that uses built-in algorithms to calculate currency support levels and place orders.
defined by five main levels support.in in cases of a breakdown of the strongest support, the adviser closes orders and opens an order in the direction of the trend, thereby saving the Deposit from being completely drained.
new levels are defined, and the EA starts working.
does not use martingale.
it works on any timeframe, but preferably 30 minutes.
the tes

Premium Volume Lite The Premium Volume Lite indicator plots the distribution of deals according to price levels in the form of a histogram on a chart of a currency pair. The width of the histogram at this level means, conditionally, the number of transactions carried out on it. If the broker provides data on real volume, the indicator can show the distribution over it. Ranges can be equal only to standard timeframes not lower than the current one. о periods value is current then the indicator wi

The Divergent Accuracy indicator is designed to identify discrepancies on the price chart of a currency pair. The Divergent Accuracy indicator recognizes bullish and bearish divergences, and can also output a signal that a divergence has been detected... In addition to identifying divergences, the indicator works with overbought and oversold levels, and also shows arrows to enter the market...

MA BuzzQue This EA uses MovingAverages for entry and trend following. It has the following features: Recovery trades by martingale. Trading hours Money Management to close all positions if floating loss is reached. Moving Average parameters can be changed for both trend and entry. Take Profit and Stop Loss.
INPUTS
Trade Comment- customize comment. Stop New Entry- can be ON/OFF. Max Spread-Maximum spread allowed to open first new position. Magic No.- this ea unique trade number. Lot- lot siz

the zigzag indicator draws lines on the chart from the highest point to the lowest
There are built-in fibonacci levels
built-in sound alert
the indicator highlights trends on small timeframes with a thin line and trends highlights with a coarse line
Fibonacci levels can be turned on and off in the settings settings are very simple and clear
the same sound alert can be turned on and off, you can change the colors of the lines.

The premium loudness indicator draws on the chart of a currency pair based on data on the price level in the back period in the input parameters of the indicator in the form of a histogram. The width of the histogram at this level means, conditionally, the number of transactions conducted on it If the broker provides real volume data, Cannot be received For example, the range H1 can be specified as H1, H4, D1, W1, MN1. For M1, it is recommended to use periodic settings for M5 values.

Always know when the Smart Money/Market Makers are active! Shows you Past to Present, the true volume of currency pairs in a quick and beautiful histogram you can size to fit any chart. --------------------------------------------------------------------------------------------------------------------------------------------------- -Works on all time frames and all currencies -Shows volume from Ultra Low to Ultra High and even shows Excessive volume, this will tell you when to stay out of the ba

The principle of this indicator is very simple: detecting the trend with Moving Average, then monitoring the return point of graph by using the crossing of Stochastic Oscillator and finally predicting BUY and SELL signal with arrows, alerts and notifications. The parameters are fixed and automatically calculated on each time frame. Example: If you install indicator on EURUSD, timeframe M5: the indicator will detect the main trend with the Moving Average on this timeframe (for example the Moving
Pinbar Pattern Scanner: Your Ultimate Forex Trading Tool The Pinbar Pattern Scanner is a cutting-edge, non-repainting, non-lagging price action tool designed for both novice and expert traders. With its unique ability to scan across 9 timeframes, this tool alerts you of potential price rejections in any forex symbol, all from a single chart.
Key Features:
Versatility: Originally developed for forex, it's also suitable for binary options for those well-versed in price action.
Customizable: Tai

Индикатор ForexMarshalsBars относится к группе трендовых индикаторов. Он дает возможность принимать правильные решения о входе в рынок или выходе из него и через его настройки указывает, следует ли открывать длинную или короткую позицию для получения прибыли. Вы должны понимать, на чем основываются сигналы, которые дает вам индикатор. Прежде всего надо запомнить то, что лучше всего использовать сразу несколько индикаторов, чтобы уменьшить свои риски и только так вам удастся получить более то

Pending Levels EA is a great expert advisor that places pending buy and sell orders at important levels. It doesn't use any indicators and only use price and levels to make profit.
It always use stopploss and takeprofit. Testresults use reasonable SL/TP. It has moneymanagement It doesn't use Martingale or Grid
Only a few easy settings: -Magic number: ID of order -Minimum lot allowed -Risk: 0 use fixed lot -Stopploss: Setting in points. One pip is 10 Points. So if you want 50Pip SL you set 500

Always have a quick reference to timely information while trading. -Includes Currency Spread, Currency Trend w/ Time frame, Bar Timer, Server Time, Connection Status. ------------------------------------------------------------------------------------------------------------------------------ -Currency Spread; to know exactly how much you have to pay to get in. -Currency Trend with Time Frame; Understand the major direction of the currency pair for the last 3 months or other Time Frame. -Bar Tim

The Trend PA indicator uses Price Action and its own filtering algorithm to determine the trend. This approach helps to accurately determine entry points and the current trend on any timeframe. The indicator uses its own algorithm for analyzing price changes and Price Action. Which gives you the advantage of recognizing, without delay, a new nascent trend with fewer false positives. Trend filtering conditions can be selected in the settings individually for your trading style. The indicator

The default settings for the currency pair EURUSD, H1 timeframe. Initial deposit of $ 1000 BoberHober is an intraday trading system. It automatically analyzes the market for 12 indicators and trades orders BUY and SELL. The robot does not open pending orders. With the help of an intelligent analysis and forecasting system, the robot calculates the optimal trading mode, depending on the market situation. Next, the maximum number of orders in the grid is determined and the robot starts trading. Th

ZeroPoint signals a change in the moving average angle, the LevelZero parameter sets the zero point circle, there are limits from -LevelZero to LevelZero including will be considered the zero point, it can be indicated in red on the histogram.
Options: LevelZero - zero point [-LevelZero, LevelZero]; Length - the length of the moving average; Start - the starting point for calculating the angle; End - is the end point for calculating the angle; MetodMA - averaging method; AppliedPric

Full Force WSK is a multicurrency EA that is optimized to trade on specific Gaps on market open using intelligent algorithm looking for daily volume and gaps pattern variation optimized for the last years for 14 forex pairs.
Trading Strategy:
FullForce WSK is fully optimized for the following pairs:
Majors: EURUSD / GBPUSD / USDCHF / USDJPY
Minors: AUDCHF / CADCHF / CADJPY / CHFJPY / EURCHF / EURGBP / EURJPY / GBPAUD / GBPCHF / GBPJPY
We really do not recommend any other pair because ou

DESCRIPTION :
SCALPING CATCHER is an automated Expert advisor with the use of 04 specified indicators that guaranties the best results of Scalping system.
GENERAL RECOMMENDATIONS : This is Scalping EA works Only with EURUSD pair on M5 TIMEFRAME . The minimum Deposit is 300 $ .
INPUT PARAMETERS : This EA uses AutoLot function that allows it to calculate the lot size basing on the account balance. It also uses AutoProfit which is calculated according the the volume size and the account balance

NIGHTCRUSHER is a fully automated expert advisor, designed for scalping on quite market situation. you can also run different strategies like swing trading or grid different Trade Entry Signals different Exit Strategies included (MA Cut / Signal Change / Trailing TP) clever Risk & Money management - Balance based - Longrun trades tracking You can also use a Grid function or Lot multipier, if needed News Feature included - to protect you of miss trades in news times
Important: Get informed about

Losser is one of the implementations of the indicator to protect the position from loss. Similar implementations exist, it is not a complicated algorithm. The principle is very simple, practical and effective - they are implemented in this indicator, which will help traders protect their deposit from loss. The indicator uses a series of moving averages, which, with a given Length step, form the resulting lines that are displayed on the price chart as blue and red lines. These lines are the level

Trailing Stop Forward EA locks trade profit once trade moves in profit by certain points(eg 100 points) by moving the Stop Loss in direction of trade. There are three inputs in EA to be provided by user to EA TrailingStart this input used as activator when trade moved 100 points towards profit, this EA will start shifting your stop loss towards profit. TrailingStop input defines what should be the distance of stop loss from current market price once TrailingStart activated i.e trade moved 1

Pisces TheProfitZone
"Pisces TheProfitZone MT4 Indicator Powered byFxGangster" This indicator will calculate new support and resistant zone everyday, and that give us a trading zone such as thats telling us TP and SL, So it still telling us for where should the price will go reach?
Fore Example. Uptrend : If Price can stay upper a Line and price close higher above a Line, then the price will continue go up to reach next Line. Downtrend : If Price can't pass to stay upper a Line and the price

Индикатор DivergenceMRDM ситуацию, когда направление движения цены и технических индикаторов не совпадает. Что можно воспринимать как точки для входа в рынок, точки потенциального разворота рынка. Чаще всего проявляется сигнал при достижении индикатором зоны перекупленности или перепроданности. Один из четырех индикаторов: MACD , RSI , ADX , Momentum . Готовая торговая система. Индикатор не перерисовывается и не запаздывает 95% сделок прибыльные. Работает на всех валютных парах и на всех таймфр

Martingale or Fixlot !!
Time unit: 1 min MM Type 1 Mrtingale MM Type 2 Fixlot Minimum lever: 1: 500 and or 1: 1000 In the discussions I will add a few sentences right away. The EA is programmed for EURUSD, but can also be used with other pairs. In this case, the settings must be adjusted! Wish good luck.
I test on the two accounts relatively many settings so do not wonder if it is more or less one! Real account Broker FBS Server Real 9: 290046195 Password: Invest1 Broker FBS Real 3 Login 23031

"Pisces Expert Advisor" Powered by FxGangster
This EA Better work with GBPJPY and USD Pairs. this Expert Advisor has a Scalping, hedging and trend following strategy when trade with wrong way, it will use hedging to fix it, and I have included too much indicator inside this EA, you can use all setting inside to set this EA, by the way you can look how many indicator and how to setting in my screenshots pictures. Live myfxbook : Pisces EA -------------------
We provide Forex Analyst signals,

Scalpinez is a complete scalping system. The indicator itself analyzes the market and gives the trader clear signals for opening and closing orders. The same indicator gives recommendations on the size of TakeProfit. StopLoss - reverse signal. That is, if we have an open sell order and it has not yet had TakeProfit, a blue arrow appears to buy - we close the sell order.
Thus, working with the Scalpinez indicator is reduced to following its instructions.
The trading strategy is as follows: When

The TrendLSMA indicator is very reliable because it is based on moving averages. The TrendLSMA feature is the presence of a signal for entry / exit - the indicator line indicates in a certain color the signals "buy" or "sell". The accuracy of this signal is very high, 95% success rate for 5% failures. TrendLSMA is also suitable for exiting a position. The indicator almost completely captures the trend, but during flat it is necessary to use filters. When entering a position, you will always work

Индикатор RegressionXP рассчитывает два типа регрессии и вычисляет среднеквадратичную девиацию цены на данном диапазоне. Важна прямая золотая линия (регрессия первой степени), показывающая направление и состояние текущего тренда на выбранном таймфрейме. Чем больше угол с горизонталью, тем сильнее тренд. Таким образом, мы имеем возможность делать выводы относительно состояния валютной пары по текущему расположению цены относительно линии регрессии. На расстоянии от золотой линии проходят параллел

This EA loads Support & Resistance Trend Lines and trade purely based on price action of Trend Reversal strategies. No effect with manual entry. It is possible to use this Expert Advisor as indicator. It also featuring both safe Hedging and Multingle methods as well MANUAL entry by using control panel. Auto Strategy: Swing Reversal Patterns with trailing TP & Stop. Manual Strategy: BUY/SELL using Control Panel on chart with trailing TP & Stop. Operating Procedure Use 15 Minutes time frame char

Currency Heat Wave Ultimate 기술 지표는 트레이더에게 주요 통화의 강세에 대한 실시간 통찰력을 제공하는 귀중한 도구입니다. 28개의 통화 쌍을 분석하여 차트에서 직접 통화 강도에 대한 포괄적인 개요를 제공하므로 매우 편리하게 사용할 수 있습니다. 색상을 동적으로 변경하여 트레이더가 통화 위치를 빠르게 식별하고 정보에 입각한 결정을 내릴 수 있습니다. Currency Heat Wave의 주목할만한 기능 중 하나는 거래자가 지체 없이 최신 정보를 받을 수 있도록 하는 빠른 활동입니다. 표시기의 다채로운 미터는 구매 및 판매 신호에 해당하는 생생한 색상을 표시하여 시각적 경험을 향상시킵니다. 이 시각적 표현은 명확성을 더하고 트레이더가 통화의 상대적 강세를 한 눈에 파악할 수 있도록 도와줍니다. Currency Heat Wave의 사용자 친화적인 설정은 그 매력에 더욱 기여합니다. 거래자는 선호도에 따라 지표를 쉽게 사용자 정의하여 거래 전략에 적용할 수 있습니다

Индикатор Analytic System - это полноценная торговая система. Он состоит из 2 частей: Первая - это стрелочки, показывающие наиболее оптимальные точки открытия и закрытия сделок. Стрелка вверх - сигнал на покупку,стрелка вниз - на продажу. Индикатор использует сложные аналитические алгоритмы, при помощи которых система определяет моменты входов и выходов. Вторая - это информационная панель в правом верхнем углу. Крупным шрифтом обозначена цена, справа от неё показано текущее направление тренда (в

KT Ichimoku Trader is a fully automated expert advisor that offers five popular trading strategies based on the Ichimoku indicator. Each strategy has it's own entry and exit method without any interference to other strategies. The Ichimoku system can be applied to all major currency pairs and metals. However, we found that it performs reasonably well mainly on two pairs. MT5 Version is available here https://www.mql5.com/en/market/product/35043
Features
Trade up to 5 famous trading strategi

Psr3 EA is the one of Psr series EAs. It works on 5 minutes chart only. You can use this EA any currencies but you should optimize first. Default parameters belongs to my broker databases EURUSD M5 . It uses pivot and Support/Resistance Levels. Stoploss and Takeprofit can be adjustable by user. ( for optimizing ) Input Parameters: MagicNum: Expert will use this number to determine experts orders. Lots: Lots amount which you want to use. Default is 0.01 ( it can be cahnged by expert due to you

Psr1 EA is the one of Psr series EAs. It works on 5 minutes chart only. You can use this EA any currencies but you should optimize first. Default parameters belongs to my broker databases EURUSD M5 . It uses pivot and 2 main moving averages. Moving averages can be adjustable by user. ( for optimizing ) Input Parameters: MagicNum: Expert will use this number to determine experts orders. Lots: Lots amount which you want to use. Default is 0.01 ( it can be cahnged by expert due to your broker's

How it works? This EA trades with Stochastic Signal Line and Base Line crossovers. Stochastic will base its value on the current time frame. Only allows one open trade at a time. Two strategy to choose, crossover and trend following. Optimize risk management settings for lot size and martingale. Strategy: Crossover Opens a buy position if the Signal Line crosses below Base Line and base line is below the Buy below crossover level. Opens a sell position if the Signal Line crosses above

The indicator bounds the price according to a cyclic wave dependency using moving averages. Thus, all the crossing points, in which the movement is changed considering the indicator period, are the optimal ones. The crossing points can be used as the potential market reversal points. However, do not forget about the complex approach: the indicator signals require additional data to enter the market.

The WiseBW indicator simplifies decision making by recognizing turns using the built-in algorithm, and then confirms signals at support / resistance levels. Thus, the indicator tracks the market trend with unsurpassed reliability, ignoring sharp market fluctuations and noise around the average price. The indicator can be used both for pipsing at small periods, and for long-term trading. Options: updown - offset pips for indentation of icons; back - how many bars to take into account; CountBa

SST Expert Adviser is a fully automated EA that uses a revolutionary Grid algorithm together with support and resistance zone
Real test: www.myfxbook.com/members/seng55/sst-expert-adviser/3054181
Set file: https://www.mql5.com/en/market/product/34702#!tab=comments&page=1&comment=10392694 Recommendations EA Settings : Use default settings or set files. Symbol : EURUSD USDJPY or Any. Time Frame : M15. Brokers : ECN brokers, low spread/commission, 1:500 up leverage , non-FIFO or FIFO. Trading Cond

Expert works H1 timeframe only There are two main criteria. Daily pivots and moving averages. To open a buy order, today's daily pivot must greather than the day before's daily pivots. Moving averages for EURUSD pair as default. They can be changed for other pairs and also for EURUSD too. You can also change takeprofit and stoploss level. expert doesnt trade on mondays and before 2 hour on other trade days. You can test and optimize for all pairs with extern parameters. Do not purchase without

Пинбар — это лишь 1 свечка или бар, представляющая собой цену, что отскочила от максимального или минимального ценового уровня. Свечка открылась, цена пошла в одном направлении и затем резко развернулась за период свечи — так формируется пинбар. Пинбар легко заметить — длинная тень (хвост), маленькое тело. Запомните: не все свечи с длинным хвостом являются пинбарами. Только когда хвост намного больше тела свечи, формируется пинбар. Как правило, рынок при этом закрывается там, где открылся или по

Neversys is a Scalping Trading and Intraday Trading. Neversys uses predictions and predictions using artificial intelligence algorithms. In this way, the professional higher law has lost its luck.
EURUSD does a practical, historically important job. Download the demo yourself. My tests were 90 days of accuracy, actual spread, extra slip and high visibility date of actual ticks. Also tested on MT4 Strategy Tester. Can be found here
The recommendations are as follows
optimized for the EUR / US
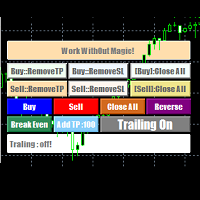
EasyAgent Trade Tool.This is not an automatic trading robot (EA) and it doesn’t take decisions or opens position, but it helps your work when you trading manual work with Strategy Tester and you can control trade via magic number. The following functions are available: Order opening in one click. Order closing/deleting in one click. Modification of Stop Loss and Take Profit using a mouse. Closing all orders based on their type. Order reversal. Breakeven function. Trailing Stop function.

추세선은 외환 거래에서 기술적 분석의 가장 필수적인 도구입니다. 불행히도, 대부분의 거래자는 올바르게 그리지 않습니다. 자동 추세선 표시기는 시장의 추세 움직임을 시각화하는 데 도움이 되는 진지한 거래자를 위한 전문 도구입니다.
추세선 강세 추세선과 약세 추세선에는 두 가지 유형이 있습니다.
상승 추세에서 Forex 추세선은 가격 움직임의 가장 낮은 스윙 포인트를 통해 그려집니다.
최소 두 개의 "최저 저점"을 연결하면 추세선이 생성됩니다.
하락 추세에서 추세선은 가격 움직임의 가장 높은 스윙 포인트를 통해 그려집니다.
최소 두 개의 "최고 최고점"을 연결하면 추세선이 생성됩니다.
추세선이 깨질 때?
강세 추세선은 약세 양초가 강세 추세선 아래에서 닫히고 양초의 고점이 추세선 위에 있을 때 깨집니다.
약세 추세선은 강세 양초가 약세 추세선 위로 마감되고 양초 저점이 추세선 아래에 있을 때 깨집니다.
추세선이 삭제되면?
강세 추세선은 전체 양초가 강세 추세선 아래에
The UpDownSignals indicator is designed to identify entry and exit points for a deal. Using it is very simple: when an up arrow appears, open a BUY deal, when a down arrow appears, open a SELL deal. The indicator gives accurate and timely signals for entry and exit, appearing on the current candle between the time the candle opens and closes. The indicator works on the basis of MACD, candlestick patterns and proprietary algorithms.
Indicator inputs: period - indicator period enableAlerts - Ena

Most of those who trade in Forex are aware of the Elliott Wave Analysis System. So what is this wave analysis: This is the study and analysis of price, and not its derivatives (various indicators); The ability to determine price targets using Fibonacci tools (Elliott waves are closely related to Fibonacci numbers). You can get a clear picture of the market at all time scales; With EWA, it is possible to build a trading system with a clear description of the inputs and outputs. For simplicity, t

How it works? This EA trades with Fast MA and Slow MA crossovers. Moving Average will base its value on the current time frame. Only allows one open trade at a time. Two strategy to choose, crossover and trend following. Optimize risk management settings for lot size and martingale. Strategy: Crossover Opens a Buy position if the Slow MA crosses below Fast MA. Opens a Sell position if the Slow MA crosses above Fast MA. Trend Following Opens a Buy position if the Slow MA is below Fast

This mutlitimeframe indicator is based on my own indicator wich shows trends at a early stage . You will see the trends from M1 to Month timeframe . The more the value is high ,the more the trend is confirmed .The values above 100 determine a high trend . Medium trend : 50 <=Value<100 No trend : 50<Value You can set alert for each timeframe and for your own value . Meaning of the parameters: M5|1: .....is the indicator's value on the 1st bar for M5 timeframe M5|2: .....is the indicator's va

Alpha Multi Scalper is a fully automated Expert Advisor. The strategy of this system consists of two mechanisms that work together between scalping strategies and multiple currency pair strategies . Based on the principles of predictive analysis of market price factors and price fluctuations that help determine trends and identify price patterns can help to see better opportunities for trading to make a profit. And diversify risks by trading multiple pairs at the same time. This system model li
트레이딩 전략과 기술 지표를 판매하기에 가장 좋은 장소가 왜 MetaTrader 마켓인지 알고 계십니까? 광고나 소프트웨어 보호가 필요 없고, 지불 문제도 없습니다. 모든 것이 MetaTrader 마켓에서 제공됩니다.
트레이딩 기회를 놓치고 있어요:
- 무료 트레이딩 앱
- 복사용 8,000 이상의 시그널
- 금융 시장 개척을 위한 경제 뉴스
등록
로그인
계정이 없으시면, 가입하십시오
MQL5.com 웹사이트에 로그인을 하기 위해 쿠키를 허용하십시오.
브라우저에서 필요한 설정을 활성화하시지 않으면, 로그인할 수 없습니다.