MetaTrader 4용 Expert Advisor 및 지표 - 277
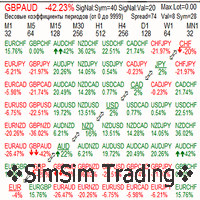
SimSim Tournament Currency Strength Table This is a multi-currency indicator; it shows the relative strength of the currency and 28 major currency pairs. There are many similar indicators on the market, but let there be one more. In this indicator, unlike others, you can specify weighting factors for each timeframe.
Weighting factors. Why are they? Each trader prefers to work with a specific time frame, which is the main one for him, and the signals from him are most important. Examples of s
« TrendFisherman »- трендовый скальпер. Может брать прибыль, даже от незначительных движений цены, от 1 пункта. Поэтому, перед установкой советника на реальный счет , очень важно уточнить, нет ли ограничений у вашего брокера по количеству закрытых пунктов или по времени существования ордера. Хотя « TrendFisherman » и является скальпером, не все ордера закрываются быстро. При выраженном тренде, особенно, если индикаторы подтверждают силу тренда, советник может держать открытую позицию до нескольк
PiggyBankFX EA based on breakouts of high and lows following the trend. Low spread account is recommended, but if you are using a high spread account , use the terminal optimization to find the best TrailingStop and TrailingStep for your account .
Trade Parameters StopL Stop Loss , Close position at maximum Loss allowed. TakeP Take Profit , Close position at target price. trailingStop Move the StopLoss to this amount of points below the current market price; trailingStep When to start

This expert works to obtain a percentage of the value of capital in every single trade. The risk is very low, but if the market in the case of a sharp trend may constitute a high risk for the account as it carries a very accurate risk management privatization. Running it on only one pair is not working properly and it is on more m Try pair n on demo and sign score ..._______________________________________________________________

This EA is Triumph Forex (https://www.mql5.com/en/market/product/40818)now with user fixed Stoploss and Take Profit, It uses strategy which works year after year. It makes an entry in the market early enough when the trend shifts at Price action verified supports and resistance levels.
why renting/Sell it when l can make enough using it? Well to be honest, am renting/selling out just to raise enough Capital for trading. Those who buy it are fortunate as it won’t be available after raising capit

The Force Two Scalper s a fully automated scalping Expert Advisor that you can use to backtest a 10-year of data with modelling quality of at least 90%. All features of The Force One is used in this EA but with a much different entry analysis and techniques that make this one have a different precision on profitability. This EA can be used to diversify investment. It uses only an entry analysis based on a proprietary multiple trades maneuver analysis and settings to detect price breakout movem

Expert Advisor does not use indicators, does not use a grid, does not use martingale. Work like this: ONLY one order per day with Stoploss and TakeProfit! Fully automated. This expert advisor is created for investment for a long period , but NOT for speculation (not scalper, not just order opener)! To get the most out of the robot - I advise you to use the robot for at least 1 year and longer! The longer the period, the greater the profit. The robot does not need to be set up! Just download and

Risk manager
Risk manager - it will simplify the tracking of drawdown and will notify you (alert) when the specified risk is reached, and close/lock orders when the critical DD risk level is reached.
If the specified drawdown is exceeded, you can choose two options for actions: All orders will be closed that mean loss will be fixed on depo. The terminal also closes. Instead of fixing the loss on depo, the opposite order will be opened - orders locking will occure. Not a single order will be c
MT5 버전 | Valable ZigZag 표시 | FAQ Grid HLevel 전문가 어드바이저는 매월 외환 시장에서 안정적인 수익을 내고자 하는 트레이더에게 적합합니다. 전문가 어드바이저는 평균화 전략에 따라 작동하므로 올바르게 사용하는 것이 좋습니다. "올바르게"사용한다는 것은 시장의 반전 지점에서 평균화 된 거래를 시작하고 글로벌 추세의 방향으로 만 거래하는 것을 의미합니다. 주요 추세의 방향에 관해서는 H4 기간의 Valable ZigZag 표시기로 결정하는 것이 좋습니다. 지표로 시장이 변할 수있는 수준을 결정하는 것이 더 어렵 기 때문에 평균화 주문을 사용하여 시장에보다 정확하게 진입하기 위해 거래자가 차트에서 수동으로설정하는 것이 좋습니다. Telegram 채팅: @it_trader_chat 새로운 Expert Advisor Prop Master - 트레이딩 터미널에서 테스트해보세요 https://www.mql5.com/ko/market/produc

:::: It is programmed to work on any M5 Chat windows !! Used to determine the Strongest currency pairs and the Weakest pairs also detect the peak of deviation of currencies strength IT CAN BE USED FOR INDICES AND STOCKS TOO !! Strategy one : It can be used in to BUY Strongest pair and SELL Weakest one Strategy two: It can be used on Daily basis to Hedge BUY Strongest pair with high % (ex: +1%) and BUY Weakest one with % lower(ex: -0.7%) the same with SELL Strategy three: on 3days or above ca

The robot works by calculating the offset of the balance between buyers and sellers, depending on the market situation, the preservation of previously opened orders continues, upon reaching the profit specified in the settings, profit is fixed and the adviser again becomes in the operating mode. The adviser uses the hedging mode of transactions with a preponderance of more orders in the direction of the trend. The EA works on the MT4 platform.
ATTENTION. Before starting work, it is necessary t
This EA has been developed for DOWJONES (US30) H1 timeframe, everything is tested and ready for immediate use on real account. This Expert Advisor is based on BREAKOUT of the PIVOT LINE. It uses STOP pending orders with FIXED STOP LOSS and ATR TAKE PROFIT . To catch more profit there is also a TRAILING PROFIT function provided. At 9:00 pm we are closing trading every Friday to prevent from weekly gaps. !!!Adjust these times to your broker time. Preset values are for UTC+1 only!!! For every

NEW YEAR SPECIAL DISCOUNT RUNNING NOW 40% DISCOUNT Price slashed from $149 to $89 until 3rd Jan 2025 Indicator captures the trend reversals with no-repaint Buy and Sell Arrow signals. CyberZingFx Trend Reversal Indicator - your go-to solution for accurate and reliable trend reversal signals. With its advanced trading strategy , the indicator offers you Buy and Sell Arrow signals that do not repaint, making it a reliable tool for catching Swing Highs and Swing Lows in any market and any time fr

Grid Zone Pro is a fully automated expert advisor. The system uses filtering measurements from trend signals to create buy zones and sell zones. Trading signals are processed by allocating them into the design zone. The system will automatically calculate the grid distance or the user can set it manually. This EA has passed 7 years back test of real tick data (2014-2020). This EA has improved smarter than ever before, taking into account other variables, filtering news and increasing profits f

This EA uses strategy which works year after year. It makes an entry in the market early enough when the trend shifts at Price action verified supports and resistance levels. why renting/Sell it when l can make enough using it? Well to be honest, am renting/selling out just to raise enough Capital for trading. Those who buy it are fortunate as it won’t be available after raising capital. Let’s discuss the Parameters to have an idea of how it trades. Name of EA =Triumph Forex Strategy Properties

The adviser works on the indicator, the martingale is used in the strategist, and when you turn it on, you can disable it in the settings. Recommended pair USDCHF
extern int Sl = 0; // SL extern int Tp = 50; // TP extern int Tral = 10; // Trailing 1 pp extern int magic = 3456346; // Magic extern double lot = 0.01; // Lot extern bool ilan_martin = true; // true or false ex

News expert is executing pending orders at the time of strong news and according to the user settings where the market movement is violent, he pauses the pending orders moving with the price Try on the demo and see the result See the video facility is also ideally works very strong news time can add news for the whole week Execute orders and according to the strength of the price action Try the demo also watch the video attached
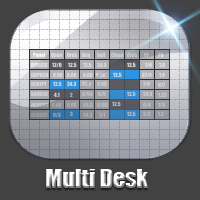
A small panel in the left corner of the chart displays the status and statistics on open and closed orders for all traded symbols. In the process of multicurrency trading, you need to know by what symbols the strategy gives profit or loss, how many deals and with what efficiency. It is important to see the comparative characteristics of all symbols in order to compare and analyze. This is necessary both for the operational management of open positions, and for the timely detection and removal f

Jealous about the colorful fibonacci tools in tradingview? Here is the solution for MT4! You can turn your existing charts into colorful masterpieces by adding this tool. Bring your presentations, webinars to the next level and attract more users when posting or sharing your analysis.
Simply add the indicator to the chart and your fibs will turned into the colorful ones. Don't loss your objects! They will turn back into "standard" objects when the indicator gets removed.
Watch this video to

Good looking overview panel for the current instrument showing: Instrumentname Flags of involved currencies for forex or indicies Bid/Ask price Spread The look and location of the panel can also be configured. Here the desctiption of the useable parameters: panelFontName : Name of the system font that is used to paint all text. panelBackgroundColor : Background color of the panel. panelNeutralColor : Color of the text within that panel. panelBorderColor : Color of the panel border panelBorderAl

This expert works in the strategy of hedging and hedging and then add a high-precision capital management. It does not use the entire balance in the trade process, but it splits it into several parts and trades part of it according to user settings also works to open several orders at the same time, taking into account the management of capital works On all the main couples but works on only one pair of them taking into account the capital management this expert wonderful profits infinite ... Tr
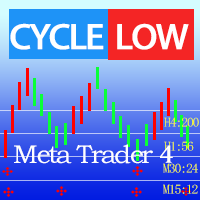
Doing things and doing trading are time-sensitive, geographical and people-friendly. Usually, most of the time we only care about which price to open a position, which price to stop losses, and which price to stop earnings, which is called geographical advantage. Little attention is paid to when to open a position, stop losses and stop earnings, which is called Tianshi.
This indicator can help you find out when to do trading, when to turn off the computer to accompany your family, travel, a

Это самая полная и продвинутая версия эксперта Start Trade. Отлично зарекомендовавшая себя. Ссылка: https://www.mql5.com/ru/market/product/39225 В платной версии вы получаете: более проработанную механику Траллинга ордеров. более прочная связь между параллельно открытыми валютными парами. дальнейшие обгрейды и поддержку. Коротко о главном.
Для начала торговли достаточно небольшого депозита. Идеален для быстрого разгона депозита!!! Подходит для мультивалютной торговли. Невосприимчивость к больш

MM Trend Direction follow trend. Color change trend changed. Works in EURUSD/GBPUSD/AUDUSD/USDCHF/EURNZD/NZDUSD/SILVER/USOIL/US500/AUS200/USDTRY/EURTRY and all pairs
Best timeframe 15M
Signal on close of a bar.
DOES NOT repaint. DOES NOT repaint. DOES NOT repaint. DOES NOT repaint.
DOES NOT recalculate. DOES NOT recalculate. DOES NOT recalculate. DOES NOT recalculate NOTE : COLOR CHANGED TREND CHANGED
Settings : No Settings

Стратегия Советник открывает отложенные ордера на пробой важных уровней поддержки и сопротивления. Открытие фильтруется специальной тренд следящей функцией. При возникновении противоположных условий отложенные ордера немедленно удаляются. Работа ведётся только в направлении локальных трендов на текущем таймфрейме. Особенности Советник не использует сетку, мартингейл, тиковый скальпинг! Для увеличения доходности - периодически оптимизируйте параметры за 3 последних месяца. Или используйте предлаг

MAGIC Bollinger Basket
Tired of loosing? Here comes the solution. An EASY to use like the ABC fully automated EA.
The MAGIC Bollinger Basket EA is a fully automated Expert Advisor with the use of a martingale system as an option. The Bollinger Band and the RSI indicator are used for entries.
The advantage of a Basket Trader, is the function to calculate for all open trades of the same symbol and the same direction a break even point. From there the defined TakeProfit will start. It is lik
Trading Robot which automates your scalping and take your profitability and forex trading experience to the next level ,Computer cannot analyse market as humans do, at same time we cannot compete with them in terms of speed of execution, hft & emotionlessness . In this scalp-trading robot we have integrated human analysis with quick algorithmic execution to enter and exit trades at fraction of seconds Get More details at : https://www.noemotionfx.com/tl-scalper-ea To test , use it in dem

Dear Traders it's happy to launch this EA much as possible. You can use various settings on this EA to maximize the profits. 100USD is enough for safe trading with small lot sizes. Enjoy the EA. Dollars will come to your hand. Feel free to ask any thing about the EA. You can choose several modes to trading activities. Safe trading is included to the EA. Your Equity is on safe hand with this EA.
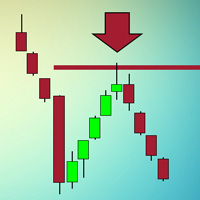
Индикатор, который ищет качественные точки входа в рынок и отображает их в виде стрелок. Действует по сложному алгоритму. Сначала ищет на графике специальные уровни, которые обязательно должны быть пробиты импульсом. Если цена возвращается к этому уровню в виде свечи с длинной тенью и маленьким телом и касается уровня только тенью - возникает точка входа. Не перерисовывается! Лучше всего выглядит и отрабатывает на Н1.
Может использоваться как: Индикатор уровней, где цена будет останавливат

Mars 8 is a TREND indicator is a powerful indicator of TREND DIRECCTION for any par and any timeframe. It doesn't requires any additional indicators for the trading setup.The indicator gives clear signals about opening and closing trades.This Indicator is a unique, high quality and affordable trading tool. Can be used in combination with other indicators Perfect For New Traders And Expert Traders Low risk entries. Never repaints signal. Never backpaints signal. Never recalculates signal. For

Trade Copy is an EA-shaped tool that replicates the trades done on a Meta Trader 5 to all Meta Traders 5 opened on same computer. Is useful if you want to trade more than once account yours or if you want to work with third party account management. The images are from MT5 because it is the same as MT4. Demo version: https://www.mql5.com/pt/market/product/40947 MT5 version (more advanced): https://www.mql5.com/en/market/product/40901 Configurations: MAIN OPTIONS Idiom - change to English or

버마우이 핀 바
또는 (BPB)는 차트에서 핀 바 가격 행동 패턴을 찾는 지표입니다. Pin Bars는 Hammer, Inverted-Hammer, Hanging Man, 슈팅 스타, Dragon Fly Doji 또는 Grave Stone Doji와 같이 높이가 높거나 낮은 그림자와 매우 작은 몸체를 가진 일본 촛대의 대안인 고전적인 바 패턴인 "Pinocchio Bars"의 지름길입니다. . Bermaui Pin Bars 표시기는 다음 단계에서 설명할 수 있는 공식에 따라 이 패턴을 찾습니다.
처음에 BPB는 양초 몸체의 중심을 계산합니다( = [Open + Close] / 2). 그런 다음 BPB는 몸체 중심과 촛불 사이의 거리를 낮게 찾습니다. 마지막 단계는 2단계 결과를 양초 범위로 나누는 것입니다. 양초 본체 중심이 양초의 고점 또는 저점에 너무 가까우면 BPB가 핀 막대 패턴을 감지하고 사용자에게 경고합니다. 버마우이 핀 바 공식 : https://www.mql5.com
Auto Chart Updater Indicator is created to update the window chart for any indicator, expert or any trading program receive fresh data retrieval at xx period interval set by the user as a preference. It is laced with on-chart Candle clock to give the user the sense of time when the updater would refresh the chart or the remaining time for the candle/session to end. It also has an option for the user to choose when exactly does he/she wants the Updater to update the chart. The User can also selec

Automatic redrawing of Trend Supports and resistances levels and Possible Wedge pattern formation to indicate price breaking of Rising Wedge (signal SELL) or price breaking of falling Wedge (signal BUY) Very simple and smart indicator ALERTS AND MOBILE NOTIFICATIONS availavle !!! you can edit the calculation bars of the bars count for formation of the trend lines and the initial shift from current price Smaller values for bars /shift inputs when using Higher Time frames (D1-H4) and the reverse

Only NonFarm Payroll Trade The employment situation is a set of labor market indicators. The unemployment rate measures the number of unemployed as a percentage of the labor force. Non-farm payroll employment counts the number of paid employees working part-time or full-time in the nation's business and government establishments. The average workweek reflects the number of hours worked in the non-farm sector. Average hourly earnings reveal the basic hourly rate for major industries as indicated

Chart Linker This tool is indicator for linking charts in Metatrader 4. Thanks to this tool you have to change symbol only in the main window and all other change automatically. Add this tool to all charts that you want to be linked with each other. Set one chart as a main. Change symbol in the main window and linked windows change automatically to the new symbol.
Compare to https://www.mql5.com/en/market/product/30048 Chart linker can work simultaniously with other indicators and/or exper

Motivated from: A market is the story of cycles and of the human behavior that is responsible for overreactions in both directions. - Seth Klarman
NeuroWave Scalper PRO is a advanced powerful cycle algorithm which depicts the cycles of market in a effective manner.This Indicator works in trending as well as ranging market conditions. This indicator is perfect for scalp trades as well as swing trades. NeuroWave Scalper PRO is not just an indicator, but a trading strategy itself. It doesn't

Standart "PureDailyEA" 's signal link has been working on 25 different instruments since 09.07.2019. It will be stopped after a while. https://www.mql5.com/en/signals/605823 Differences between Standart " PureDailyEa" and "PureDailyAdvanced" are: 1. Added one more input parameters for fine tuning ( optimizasyon ) 2. Only 5 currencies works together. You can add daily all 25 currencies but experts open orders ( if conditions met ) only five of them. This because margin problem in the small a

Due to the small number of orders, the rental price has been significantly reduced for everyone to experience. The newly added TDS dynamic backtest report that is closest to the real environment is displayed for 8 years, which proves the long-term effectiveness of the strategy. Moreover, the design and development only use the data of the latest year for design, and it has not been carried out for a long time optimization, combined with signal performance can prove that the EA has no fitted sti

Very often, the trader is faced with the task of determining the extent to which the price may change in the near future. For this purpose, you can use the Johnson distribution type SB. The main advantage of this distribution is that it can be used even with a small amount of accumulated data. The empirical approach used in determining the parameters of this distribution, allows you to accurately determine the maximum and minimum levels of the price channel. These values can be used in differ

The Force One Scalper is a fully automated scalping Expert Advisor that you can use to backtest a 10-year of data with modelling quality of at least 90%. It uses only an entry analysis based on a proprietary multiple trades maneuver analysis and settings to detect price breakout movement. The success secrets of the Expert Advisor if back-tested and forward-tested correctly are the combination of the entry method with the Money Management and multiple exit strategies. Once opportunity level is

This EA works with fast and long movements. This EA is a full version with MAX Lot 1000 Only on EURUSD timeframe 1 min.
Start with 50USD or 100 USD
This EA is a mix of Team Austria and IO9 where Terminator does not need such a fast speed as IO9.
This version is, so to speak, a lite version with the limit of max 1 lot.
The first trades with it were made on an ECN account with a VPS of 23 MS.
Nevertheless, we recommend a slightly faster connection to the broker.
QGrid is a trading robot for the EURUSD currency pair and the M1 timeframe.
Trading strategy. The first order opens on two Moving Average indicators. If the order is included in the profit, then it closes, and everything starts anew. If the order is at a loss, then gradually the grid of orders opens. When the grid goes into profit, it closes and everything starts all over again.
Options. qauto = true - set parameters automatically. For optimization, set to false. qperiod1 = 14 - the period of
This EA has been developed for EURUSD M30 timeframe, everything is tested and ready for immediate use on real account. This Expert Advisor is based on mean reversal by KELTNER CHANNEL indicator. It uses LIMIT pending orders with FIXED Stop Loss . To catch more profit there is also a TRAILING PROFIT function provided. At 9:00 pm we are closing trading every Friday to prevent from weekly gaps. !!!Adjust these times to your broker time. Preset values are for UTC+2 only!!! For every candle
Strike Line is an accelerator combining in itself a large number of the best tools filtered An exclusive algorithm ...
-------------------------------------------- It is great for scalping or binary options trading this the tool does not lag he draws there is a multi currency with him very simple work use given the tool stands with additional filters for example, like makdi or bolinger waves ......

This Expert Advisor is based on the Williams percent range strategy . It was developed by Larry Williams and it compares a closing price to the high-low range over a specific period. Williams percent range can be used in various capacities that can help us determine momentum confirmations, overbought and oversold readings, strength of the trend and potential buy and sell signals.
Key Features
Timeframe: H4
Currency pairs: GBPUSD
Use only five-digit accounts
Minimum deposit: $ 100
It is recom

Daily GBPUSD trade Our strategy relies on a choppy movement on most Forex pairs during the Asian session. Most traders in London sleep when the Sun shines over the Pacific and this results to a very slow movement of GBPUSD pair between 9:00 PM GMT and 7:00 AM GMT.
Input Parameters: Auto GMT shift extern int Broker_GMT_Shift = 0;//Manual Broker GMT shift extern int London_Night = 21; //London Night extern int London_Open = 7; //London Open

Expert Pro Scalping GBPUSD works at night taking small profits! The system passes the test from 2000 to the current day! The system is long-term and will not give you a sharp increase in the deposit! The expert uses independent strategies, including trading in short-term and long-term trends! Attention, the profitability of the system is not in one year, but in a couple of decades! It is for the patient! Take a test from 2000 to the current day to understand!
The price of the adviser will gro

Stick - уникальный авторский индикатор, отображающий сигналы в направлении основной тенденции, и против нее. Благодаря разнообразию настроек и фильтров индикатор можно настроить под свой стиль торговли. Stick подходит для любого таймфрейма, валютной пары. Сигналы индикатора не пропадают ни при каких условиях. Отличительной особенностью является возможность настроить сигналы индикатора отдельно для тенденции и против нее. С помощью Stick можно открывать сделку только в направлении основного д

Funcionamiento:
Little Shoutgun funciona de la siguente manera: En el momento en que usted ponga el EA a funcionar, éste colocara ordenes pendientes de compra hacia abajo del precio, cada 1.5 pips o 15 puntos (dependiendo del broker) y ordenes pendientes de venta hacia arriba del precio. Cerrara las operaciones con 2.8 usd de ganancia cada una hasta llegar al 25% del balance inicial; si se inicia con una cuenta de 100 el robot se reiniciara cuando el valor liquido sea igual a 125. Una vez que

indicator for trading binary options and forex trading. The indicator does not redraw the readings. when trading binary options, testing was performed. This indicator showed the good results correct predictions.
Under these conditions, the eur / usd m1 chart, when a signal appears, the transaction opens in the direction indicated by the indicator for 5 candles, then the truth is (5 minutes since in us the 1-minute chart of a candlestick is 1 minute) the result was.
When trading in the forex m

DailyFx - EA for scalping. Works on the principle of a smooth analysis of the market and the determination of peak wave values. With the help of three adaptation algorithms, EA systematically scans the time segments of the price chart by determining the impulse points of contact between demand and supply. The smoothed neural network algorithm, learning from historical data of price behavior, predicts its further behavior.
Trading with the indicator is very simple. To do this, simply place the

Quantum nest is a robot advisor using trade hedging. Refers to trend advisers, working on a quantum variable system.. The Expert Advisor applies security varnishing orders and fixes the profit with only a positive balance. Suitable for any style of trading, scalping, medium and long-term trading. It is possible to use martingale in trade. The Expert Advisor works on all market instruments of the MT4 platform. ATTENTION! First of all, before work, it is necessary to optimize the adviser on your

Pegasus Pro works on based on HFT (high frequency trading) algorithm , but it’s so sensitive, it’s 100% automatic,Pegasus Pro is capable to scalp every different situation ,Please try Backtest with the lowest spread : ( MAX 5 for majur currency ) Because the ECN accounts Types have very low spreads , Maximum Ms for VPS: 5, do not forget to get this Ms your broker's server address must be in the same place with your VPS address Live signal, https://www.mql5.com/en/signals/2256700?source=Site+S

Curiosity 7 The River It is an advanced trading system. This is a fully automatic Expert Advisor, which allows you to presize the trade according to the preferences of the trader. Curiosity 7 have more than 260 customization options for your trade. Different options for different styles of trade. Curiosity 7 The River is a Trend system of trade with different algorithm of trade mode. This EA using signals to place orders. Is a revolution in the customization of the trading. The algorithms d

Indicator patterns Price Action. The indicator uses in its work 12 patterns, a trend channel and horizontal price lines (support and resistance lines). You can work both by channel and lines, or simply by patterns. Some patterns are customizable. Below is a small manual.
Period of candles: Set the period on which the indicator will work.
Parameters of information on the chart
Consider trend and horizontal lin

The EA is not a scalper. The EA uses a strategy based on the breakdown of local support and resistance levels, also uses the reverse and rebound from support and resistance levels. The EA is based on the original author's strategy. Real monitoring: https://www.mql5.com/en/signals/author/profi_mql Detailed description of the strategy here: https://www.mql5.com/ru/blogs/post/728430 This is a link for general discussion of the EA: https://www.mql5.com/ru/blogs/post/728430 Hidden Take profit,
RSIbot - expert adviser which based on indicator RSI. Lot for 10000USD: Lot for 5000USD: Lot for 1000USD: Lot for 100USD: high risk = 2; high risk = 1; high risk = 0.5 - 1; high risk = 0.1; medium risk = 0.5 - 1; medium risk = 0.5; medium risk = 0.1; medium risk = 0.01; low risk = 0.1; l
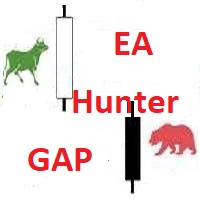
GAP Hunter EA
The expert's trading strategy is based on finding a gap (price gap) that occurs after weekends and holidays. Basically, the majority of gaps closes on the same day or within several days, the expert tracks such price gaps and when it arrives opens an order in the opposite direction in the direction of closure.
There are settings to search for gep only on Monday, search for gep every day on the shift of days, and 0-24 gap search around the clock.
In the settings there is a sprea

By checking Trend direction by 3MA at trading time frame and upper time frame With Intelligence Averaging system ,This EA " FX Smart " is made. This is very constant steady monthly profits EA ,As you know well Backtest Result has no News Control. so On real will be more steady Profits and low DD M5 EURUSD Recommended. Min 500USD , 1:400
Using News Filter, Please protect unexpected entry during News , So Please add at MT4 Tools/Options/ExpertAdvisors URL: http://ec.forexprostools.com/
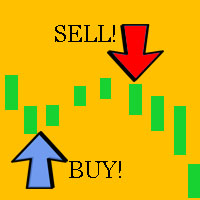
Ready trading system that gives the trader buy and sell signals. It is enough to place the indicator on the chart, it automatically analyzes the market situation, determines the direction of the trend, calculates support and resistance levels, analyzes the price movement dynamics and shows the trader on the chart in the form of arrows the moments when it is necessary to open orders and in what direction.
Trading strategies with ScalpingCircles: Trading with these signals is very simple. Add a

Robot nest is a robot advisor working on price levels calculated using a quantum system. The advisor is made with static flexible settings, which allows you to most accurately determine the price levels. There is an opportunity to work with a change in the period of the estimated time. The Expert Advisor applies security varnishing orders and fixes the profit only with a positive balance. Suitable for any style of trading, scalping, medium and long-term trading. It is possible to use martingale

A great indicator that allows one to spot reversals, and follow a trend easily, on any timeframe. Works on any forex pair and other instruments. Works extremely well on exotic pairs It changes colour and direction and can be set to provide an alert for both long and short trades. It can also be used to set the stop loss and manually trail the trade. The indicator can be used on different timeframes easily, and is reliable in that it does not change during slight market corrections, once a tren
The high and low band points made strictly according to Dow's theory can be used to distinguish the position of support and resistance, to identify the starting point of trend, and to stop and stop loss.
Whether you are a trend trader, an day short-term trader, or a scalp trader, I believe this indicator will be of great help to you.
For example, when the price goes down through the green line, the current short trend starts, and when the price goes up through the red line, the bull trend

This EA loads Support & Resistance Trend Lines and trade purely based on price action of Trend Reversal strategies. No effect with manual entry. It is possible to use this Expert Advisor as indicator. It also featuring safe virtual Hedging method as recovery as well MANUAL entry by using control panel. Auto Strategy: Swing Reversal Patterns and Major Trendline Breakout with trailing TP & Stop. Manual Strategy: BUY/SELL using Control Panel on chart with trailing TP & Stop. Operating Procedure U

SrEwo Expert adviser designed and optimized for EURUSD. You may Optimize all other instruments. It is easy to use. *** It uses only M5 chart graphic and you need to use M5. ( Both test and live ) Input Parameters: Lots: Base lot amount.Expert use this amount as referance. crossfactorlimit: expert will open new order with this limit modifylimit & TP limit : order modify and another TP limit. targetprofit : expert calculates this number in its logic. crossfactor : next order lots multiply with t

This is a very powerful indicator which is very useful in trend detection the way is used is similar to moving average but giving very reliable results. principle is very easy, that depicts a mobile support and resistance line when the price is below the orange line the trend is bearish and the line act as resistance and as soon as the resistance is broken and price is above the line then the trend becomes bullish and the line changes into the support line. this can be used in any time frames. i

Update: Push to mobile notification is now added as optinal in the settings. Most traders fail to generate profit because of the lack of so-called filters and scanners. If you want to win at trading you need a solid system and also a filtering tool for some or all of your entry criteria. It is impossible to follow 24 currency pairs, all the indices, stocks and commodities without a filtering tool. Imagine you can get an email any time CCI crosses bellow 100 and 0 when the price is bellow MA5 an

Install as an EXPERT ADVISOR for it to work. This product will not work in strategy tester because it requires trades to be opened first. Therefore, the 1 month rental option for $10 is included for you to test the product. That is the lowest price allowed by the website. The trailing stop loss (TSL) on MetaTrader 4 only works on set ranges. For example, if the TSL is set at 20 pips or 200 points, the trailing SL will move to sell/buy price only once 20 pips/200 points are gained. It does not
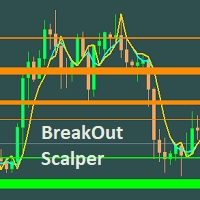
This Scalper is based on Support/Resistance level that are identified using innovative algorithm. This is very simple EA to set it up. Demo Accounts : Growth Status as of 2/06/2020 TickMill - https://www.mql5.com/en/signals/620466 -- 105327% (Initial Deposit - 200 USD, Profit - 210654.42 USD)
Recommended Currency Pair to run - GBPUSD Renko 4 pips bar chart with Wicks generated for Back testing. EURUSD Renko 4 pips bar chart with Wicks generated for Back testing. EURUSD M15 Recomme
MetaTrader 마켓은 과거 데이터를 이용한 테스트 및 최적화를 위해 무료 데모 거래 로봇을 다운로드할 수 있는 유일한 스토어입니다.
어플리케이션의 개요와 다른 고객의 리뷰를 읽어보시고 터미널에 바로 다운로드하신 다음 구매 전 트레이딩 로봇을 테스트해보시기 바랍니다. 오직 MetaTrader 마켓에서만 무료로 애플리케이션을 테스트할 수 있습니다.
트레이딩 기회를 놓치고 있어요:
- 무료 트레이딩 앱
- 복사용 8,000 이상의 시그널
- 금융 시장 개척을 위한 경제 뉴스
등록
로그인
계정이 없으시면, 가입하십시오
MQL5.com 웹사이트에 로그인을 하기 위해 쿠키를 허용하십시오.
브라우저에서 필요한 설정을 활성화하시지 않으면, 로그인할 수 없습니다.