 MetaTrader 5
 Experts
 지표
 라이브러리
 유틸리티
 위젯
 규칙
MetaTrader 4용 Expert Advisor 및 지표 - 22
 트레이딩 로봇은 자동으로 시장거래를 수행하는 반면 지표는 가격을 더 잘 분석하고 가격 행동을 예측할 수 있게 해줍니다.
이러한 어플리케이션을 사용하면 MetaTrader 4에서 더 많은 기회를 포착하는 동시에 보다 정보에 입각한 방식으로 거래를 수행할 수 있습니다.
Reanimator 반자동 거래 로봇. 위치를 열거나 닫으려면 버튼을 사용하십시오. 위치에 대한 추가 추적은 가상 이익 수준에 따라 자동으로 발생합니다. 감소/증가된 로트를 사용하여 수익성이 없는 위치를 평균화하는 시스템도 사용됩니다. 전략 테스터에서 어드바이저의 푸시 버튼 제어가 작동하지 않으며 어드바이저는 데모 또는 실제 계정에서만 완전히 테스트할 수 있습니다. 전략 테스터에서 어드바이저는 OPEN_BUY 및 OPEN_SELL 특수 설정을 사용하여 테스트할 수 있습니다.
설정
colorBUY - 구매 방향에 대한 선 색상 colorSELL - 판매 방향의 선 색상 _width - 선 너비 MagicNumber - 고문의 주문 식별자입니다. 로봇은 이러한 번호만 있는 주문에만 작동합니다. LOT - 고정 로트 크기. 0 MM 작품에서 (돈 관리) Choice_method - MM 방법. true - AccountBalance, false - AccountFreeMargin 위
SuperTrend Multicurrency Scanner MT4는 Supertrend 전략을 사용하여 여러 통화 쌍과 시간 프레임을 효율적으로 모니터링하도록 설계된 고급 거래 지표입니다. 트렌드 기반 전략을 활용하려는 거래자에게 이상적이며, 이 도구는 거래 결정을 향상시키기 위한 포괄적인 트렌드 분석 및 신호를 제공합니다. 이 지표는 실시간 트렌드 모니터링 및 알림 시스템과 같은 비할 데 없는 장점을 제공하여 거래자가 수익성 있는 진입 및 퇴출 포인트를 식별하는 데 도움을 줍니다. 숙련된 거래자이든 이제 막 시작하는 거래자이든, SuperTrend Multicurrency Scanner MT4는 forex 시장을 효과적으로 탐색하는 데 필요한 통찰력을 제공합니다. MQL 제품 설치 가이드 | 구매한 MQL 제품 업데이트 MT4/MT5 | 일반 문제 해결 가이드 | 지표 설정 / 가이드 주요 기능 버퍼 통합: Expert Advisor의 접근 가능한 버퍼로 지표 값을 노출하여 자동

SuperTrend Strategy EA MT4을 소개합니다. MetaTrader 4을 위해 특별히 설계된 강력한 거래 도구입니다. 이 전문가 어드바이저는 SuperTrend 지표를 활용하여 거래 전략을 자동화하여 트레이더에게 체계적인 시장 진입 및 퇴출 접근 방식을 제공합니다. 지능형 거래 관리 기능을 갖춘 SuperTrend Strategy EA MT4은 거래 성과를 향상시키고자 하는 초보자와 경험이 풍부한 트레이더 모두에게 이상적입니다. EA는 정확한 신호에 기반하여 거래를 실행할 수 있어 사용자가 시장 변동성을 효과적으로 활용할 수 있도록 합니다. MQL 제품 설치 가이드 | 구매한 MQL 제품 업데이트 MT4/MT5 | 일반 문제 해결 가이드 | 일반 설정 / 입력 가이드 | 지표 설정 | 백테스트 및 설정 파일 주요 기능 자동화된 거래 전략: SuperTrend 지표에 기반하여 최적의 시장 진입을 위한 거래를 실행합니다. 다양한 시간대: 다양한 거래 스타일에 적합하여 유연

MT4용 Crypto_Forex 지표 HTF RSI 오실레이터 - RSI는 가장 우수하고 널리 사용되는 오실레이터 중 하나입니다. HTF는 상위 시간대를 의미합니다. - 과매수 구간은 RSI가 70 이상일 때이고, 과매도 구간은 RSI가 30 미만일 때입니다. - RSI는 강세 및 약세 가격 모멘텀에 대한 정보를 제공합니다. - 이 지표는 가격 변동을 이용한 다중 시간대 거래 시스템 또는 다른 지표와 함께 사용하는 데 매우 유용합니다. - HTF RSI 지표를 사용하면 상위 시간대의 RSI를 현재 차트에 추가할 수 있습니다. - 지표에는 모바일 및 PC 알림 기능이 내장되어 있습니다. 여기를 클릭하여 고품질 트레이딩 로봇과 지표를 확인하세요! 이 제품은 MQL5 웹사이트에서만 제공되는 오리지널 제품입니다.
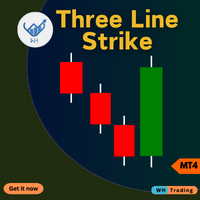
3선 스트라이크 표시기 MetaTrader 4(MT4)용입니다. 이 고급 도구는 시장의 잠재적 반전을 정확하고 쉽게 파악할 수 있도록 설계되었습니다.
초보자든 숙련된 트레이더든, 이 지표는 귀하의 트레이딩 결정을 향상시키고 수익을 극대화하는 데 도움이 될 수 있습니다. Contact me after purchase for guidance 주요 특징: 정확한 반전 신호 : 기술적 분석에서 입증된 캔들스틱 형성인 3줄 스트라이크 패턴을 기반으로 잠재적인 추세 반전을 감지합니다. 여러 개의 심볼과 여러 개의 시간대 : 대시보드/스캐너(GUI)를 통해 여러 개의 심볼과 시간대에 액세스하세요. 사용자 정의 설정 : 스트라이크 패턴, 기간, 시각적 선호도에 대한 조정 가능한 매개변수를 통해 거래 스타일에 맞게 지표를 맞춤화하세요. 실시간 알림 : 3줄 스트라이크 패턴이 형성되면 즉시 알림을 받아 중요한 시장 기회를 놓치지 마세요. 사용자 친화적인 인터페이스 : 직

진정한 수급 지표 - 모든 시간대에서 저항 및 지지 수준의 위치를 빠르게 결정할 수 있습니다. 이 지표는 거래에서 기술적 분석을 사용하는 사람들에게 유용합니다. 표시기는 사용하기 쉽고 차트에서 끌어다 놓기만 하면 표시기가 가장 가능성 있는 지지 및 저항 수준을 표시합니다. 기간을 전환하면 새로 선택한 기간의 수준이 표시됩니다.
추천 로봇 스캘퍼 - 테스트 .
입력 매개변수 Use_price 레이블 - 켜기 /끄다 레벨 근처에 가격 아이콘 표시 가격 수준 색상 - 가격 아이콘의 색상을 선택합니다. 가격 수준 크기 - 가격 아이콘 크기 지원/저항 레벨 색상 - 레벨 색상 선택 내 구독 페이지 , 나는 다른 많은 유용한 제품을 가지고 있습니다. 이 지표가 마음 에 든다면 리뷰를 남겨주세요. 유용한 제품을 무료로 공유할 수 있는 원동력이 됩니다.
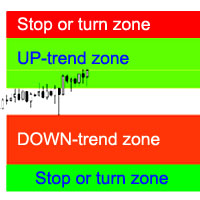
지표는 가장 가능성이 높은 추세 정지/반전 영역, 확실한 추세 이동 영역을 계산합니다.
계산은 다음을 고려합니다.
가격 변화율; 차트의 상대 편차 각도; 가격 움직임의 평균 진폭; "안락 지대"를 떠나는 가격; ATR 표시기의 값. 가격이 정지/반전 영역에 들어갈 때 표시기가 경고를 생성할 수 있습니다. 설정 전체 길이를 그립니다. - 차트가 끝날 때까지 영역을 그립니다. 정지 상승 추세 표시 - 상승 추세의 정지/반전 영역을 표시합니다. Show UP-trend - 자신감 있는 상승세 영역을 표시합니다. 하락 추세 표시 - 확실한 하락 추세 영역을 표시합니다. 정지 하락 추세 표시 - 하락 추세의 정지/반전 영역을 표시합니다. 영역 변경 경고 - 가격이 추세 중지/변경 영역에 들어갈 때 경고를 생성합니다. 다음은 각 거래 영역에 대한 색상 설정입니다.
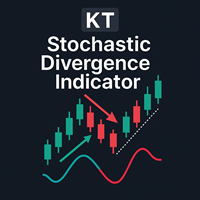
가격이 새로운 고점을 만들었는데 스토캐스틱이 그 움직임을 확인하지 못하는 장면을 본 적이 있다면, 트레이더들이 왜 다이버전스를 주시하는지 이미 알고 있을 것입니다. KT Stoch Divergence는 이런 차이를 차트에 직접 표시해 주므로, 선을 하나씩 직접 그리지 않아도 반전 가능성과 추세 지속 구간을 찾기 쉬워집니다. 이 지표는 가격과 스토캐스틱 오실레이터 사이의 일반 다이버전스와 히든 다이버전스를 모두 찾습니다. 자동 매매 신호를 주는 것이 아니라 판단에 필요한 배경을 제공합니다. 실제 진입 여부는 차트를 보고 직접 결정해야 합니다. 트레이더의 활용 방법 매도 압력이 약해질 수 있는 지지선 부근에서 일반 상승 다이버전스를 찾습니다. 매수 압력이 약해질 수 있는 저항선 부근에서 일반 하락 다이버전스를 찾습니다. 히든 다이버전스로 기존 추세 방향으로 이어질 수 있는 조정 구간을 찾습니다. 다이버전스를 진입 필터, 청산 참고 신호 또는 자신의 전략을 위한 추가 확인으로 사용합니다.
- All of my indicators are just 30$ ! Limited offer. Please contact me by temporarily account for more info: https://www.mql5.com/en/users/temp_elif_kaya/ messages Contact me for instruction, any questions! Introduction V Bottoms and Tops (or Fibonacci Retracement) are popular chart patterns among traders due to their potential for identifying trend reversals. These patterns are characterized by sharp and sudden price movements, creating a V-shaped or inverted V-shaped formation on the ch

랏 크기를 더 이상 짐작하지 마세요. TravaRisco Lot Calculator는 선택한 리스크에 맞는 정확한 랏을 차트에 바로 표시합니다. 작동 방식: 패널에 리스크(%)와 손절(포인트)을 입력하면 지표가 즉시 계산합니다: 리스크 금액(계좌 통화 기준) 해당 손절 시 1랏당 손실 브로커의 거래량 단위에 맞춰 반올림한 정확한 랏 반올림 후 실제 리스크 외환, 금, 지수, 암호화폐에서 작동하며 사용 중인 브로커의 틱 가치를 사용합니다. 패널은 영어 또는 포르투갈어를 지원합니다. 거래를 열지 않으며 계산만 합니다. 매개변수: Risk per trade: 거래당 리스크, 잔고 대비 %(기본값 1%) Default stop loss: 초기 손절 포인트(기본값 200) Language: 패널 언어(영어 또는 포르투갈어) X position / Y position: 차트 내 패널 위치 Background color: 패널 배경색 프롭 펌 챌린지를 위한 일일 손실 잠금이 필요하신가요? Tra
FREE

This is a multi timeframe version of the Supply and Demand indicator . It allows you to analyze a chart using the law of supply and demand on three different timeframes at a time. You will see zones of sales and purchases and determine the most profitable points to open positions. The indicator is based on the principle of market fractality. Supply and demand zones show places where a strong buyer or seller has made the price reverse and change its direction. The indicator has several types of
FREE

VirtualTradePad PRO SE MT4 — MetaTrader 4용 고급 트레이딩 패널 및 차트 워크스페이스 VirtualTradePad PRO SE 는 MetaTrader 4 용 전문 트레이딩 패널이자 거래 관리 워크스페이스입니다. 하나의 차트 기반 인터페이스에서 거래를 더 빠르게 열고, 관리하고, 보호하고, 닫고, 분석할 수 있도록 도와줍니다. 이 제품은 단순한 버튼 모음 이상의 기능이 필요한 적극적인 수동 트레이더를 위해 만들어졌습니다. PRO SE는 원클릭 실행, 예약 주문, 포지션 제어, 부분 청산, 바스켓 손익 로직, 평균가 레벨, ATM 규칙, 신호 모니터링, 시장 정보, 전략 테스터 워크플로, VPS 중심 준비를 하나의 구조화된 워크스페이스로 통합합니다. MT5 버전 | 전체 설명 및 스크린샷 | 구입 방법 | 설치 방법 | 로그 파일을 얻는 방법 | 테스트 및 최적화 방법 | Expforex의 모든 제품 일반 수동 트레이딩 대비 장점 여러 창 대신 하나의 워

Эксперт MACD_LevelTrader создан для торговле валютной пары XAUUSD. Данная версия это наработки того, что можно извлечь из индикатора MACD и Moving Average. Важно перед тестированием изменить настройку с 1000 на 5000 Offset in points UP from SMA200 for sell 5000 Offset in points DOWN from SMA200 for buy 5000 Тайм фрейм М5. Два варианта логики, П араметр true=вход по уровню MACD + SMA200, false=вход по MACD Тестируйте на демо
FREE
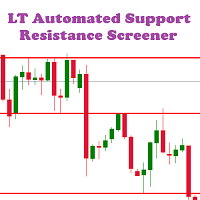
LT Automated Support Resistance Screener is a level indicator or a support resistance indicator that can be used to determine the level of support and resistance values. This indicator is free and easy to used in the Metatrader 4 platform which is built using the MQL4 programming language. Support resistance indicator is an important indicator that is often to used, but it is not available on the MT4 platform. This indicator can be used for all markets like forex, indices, gold etc and all time
FREE

Master Close via Telegram can help you perform some management tasks on MT4/MT5 remotely via your Telegram by one click, easy to set up & use. Demo here (see more Master Notify Master Control ) ************************************************************************************ LIST OF COMMANDS: info_acc - Get account info info_pen - Get pending orders details info_pos - Get positions details info_pos_sum - Get positions summary
close_pen - Delete all pending orders close_pos_all -
Are you tired of drawing trendlines every time you're analyzing charts? Or perhaps you would like more consistency in your technical analysis. Then this is for you. This indicator will draw trend lines automatically when dropped on a chart. How it works Works similar to standard deviation channel found on mt4 and mt5. It has 2 parameters: 1. Starting Bar 2. Number of bars for calculation The starting bar is the bar which drawing of the trend lines will begin, while the number of bars for c
FREE

리버설 셋업을 놓치지 마세요. **Candlestick Reversal Dashboard(캔들스틱 리버설 대시보드)**는 전체 관심 종목 목록을 모든 타임프레임에 걸쳐 자동으로 스캔하고, 패턴이 형성되는 즉시 알림을 보냅니다 — 절대 리페인트하지 않는 신호와 함께. 이 인디케이터가 하는 일 20개의 통화 쌍을 여러 타임프레임에 걸쳐 캔들스틱 리버설 패턴을 찾아 수동으로 스캔하려면 몇 시간이 걸립니다. 셋업을 발견했을 때는 이미 진입 시점이 지나간 경우가 대부분입니다. Candlestick Reversal Dashboard 는 이 문제를 완전히 해결합니다. 최대 20개 심볼과 9개 타임프레임에 걸쳐 14가지 모든 클래식 리버설 패턴을 동시에 자동 감지합니다. 확인된 모든 신호는 깔끔하고 스크롤 가능한 대시보드에 표시됩니다. 한 번의 클릭으로 패턴이 형성된 차트로 직접 이동할 수 있습니다. 신호는 캔들이 마감된 후에만 생성됩니다 . 패턴이 대시보드에 나타나면, 그것은 절대

EAPADPRO Library for MetaTrader 4 는 Expert Advisor에 현대적인 정보 패널을 추가할 수 있는 무료 전문 인터페이스 라이브러리입니다. 이 라이브러리는 MetaTrader 4 차트에서 자신의 거래 프로그램을 더 명확하고, 시각적으로 완성도 있게, 그리고 더 전문적으로 보이게 만들고 싶은 MQL4 개발자를 위해 제작되었습니다. 거래 알고리즘도 중요하지만, 제품의 첫인상 역시 중요합니다. 깔끔한 정보 패널은 사용자가 Expert Advisor가 현재 무엇을 하고 있는지, 어떤 설정이 활성화되어 있는지, 어떤 심볼과 Magic number가 처리되고 있는지, 그리고 현재 전략에서 어떤 값이 중요한지 더 빠르게 이해하도록 도와줍니다. EAPADPRO for MT4는 무료 라이브러리입니다. Expert Advisor의 인터페이스, 정보 표시 방식, 시각적 품질을 개선하는 데 사용할 수 있습니다. 전체 단계별 통합 가이드: LIB - EAPADPRO 단계별 설
FREE
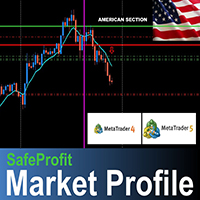
The SafeProfit Market Profile is the most advanced tracking indicator in the Forex Market. It was developed to track the market profile of each session of the day: Asian, European and American. With this indicator you will operate Intraday smiling ... knowing exactly where the Big Players are positioned and the exact moment where they are going to. The indicator is simple, fast and objective, tracking every movement of the Big Players in price. Get out of the 95% statistic that only loses and us

This may just look like another indicator for identifying and displaying supply and demand, but dig-in further and you will discover it has much more to offer. In addition to the complete flexibility for displaying zones, consider the identification of recent support or resistance, the back-testing capability to help you learn how to identify the best supply and demand zones to trader from, the continuously updated trend information for all time frames, times from around the world displayed on

무료 — Donchian 돌파 채널, SMA 추세 필터, 그리고 거래를 관리하는 ATR 트레일링 스톱을 하나로 모았습니다. 주요 암호화폐(BTC, ETH)에 맞춰 조정했습니다.
완전 무료이며 제한이 없습니다. 차트에서 유용하다고 느끼셨다면 짧은 리뷰가 저희에게 가장 큰 도움이 됩니다. 30초면 충분하며, 다른 트레이더가 이 도구를 발견하는 유일한 경로입니다.
플랫폼: MetaTrader 4 (이 페이지).
암호화폐는 길고 깔끔한 흐름으로 추세를 낸 뒤 심하게 횡보합니다. 단순 돌파 지표는 두 경우 모두에서 신호를 냅니다. 이 지표는 돌파가 장기 SMA와도 일치할 때에만 그것을 표시하며, 이것이 바로 추세형 암호화폐 EA가 박스권 내부의 가짜 돌파를 매수하지 않는 방식입니다.
=== 무엇을 그리는가 ===
- 최근 N개의 마감된 봉에 대한 Donchian 채널(상단과 하단).
- 추세 SMA(기본값 200).
- 어떤 봉이 채널 밖에서 마감되고 SMA의 올바른 쪽에 있을 때 표
FREE
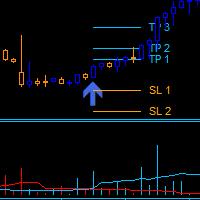
Dark Power is an Indicator for intraday trading. This Indicator is based on Trend Following strategy, also adopting the use of an histogram to determine the right power . We can enter in good price with this Indicator, in order to follow the strong trend on the current instrument. The histogram is calculated based on the size of the bars and two moving averages calculated on the histogram determine the direction of the signal
Key benefits
Easily visible take profit/stop loss lines Intui

멀티타임프레임 수급 히스토그램 (Multi-Timeframe Supply Demand Histogram)
설명:
멀티타임프레임 수급 히스토그램은 강력하고 깔끔한 지표로, H4와 D1과 같은 여러 시간대에서 시장의 수요와 공급 강도를 보여줍니다. 이 지표는 매수자나 매도자가 우세할 때를 히스토그램으로 시각화하여, 트레이더가 주요 시장 압력 영역을 빠르게 식별할 수 있게 합니다. 주요 기능: H4 & D1 히스토그램: 상위 시간대의 시장 강도를 명확하게 시각화. 히스토그램 변화 알림: 수요나 공급이 변할 때 선택적 알림 제공. 차트 혼잡 최소화: 가장 중요한 신호에만 집중. 맞춤형 표시: 시간대별 히스토그램 켜기/끄기 가능, 알림 선택적. 추천 15분 차트: 일중 스윙 트레이딩에 최적. 최적 조합: Ultimate Scalpers Zone 지표와 함께 사용할 때 다중 확인 진입에 최적. 장점: 높은 확률의 지지 및 저항 구간을 빠르게 식별 가능. 여러 시간대에서 시장 모멘텀을 한눈에
FREE
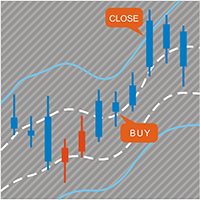
표시기는 두 부분으로 구성됩니다. 1부: 색상 양초가 주요 추세를 보여줍니다. 컬러 캔들(Color Candles)은 컬러 캔들스틱으로 시장 상태를 파악하는 것입니다. 스크린샷에서 보듯이, 색상이 아쿠아(Aqua)라면 시장은 매수 주문을 해야 하거나 매도 주문을 종료해야 하는 상태입니다. 색상이 토마토라면 짧은 주문을 하거나 긴 주문을 종료할 때입니다. 색상이 변경되는 경우 완료될 때까지 기다리는 것이 좋습니다(현재 막대가 닫힐 때까지). 파트 II: 밴드 그리기 안쪽 밴드는 안전 구역으로 정의되고, 바깥쪽 밴드는 마감 주문용으로 정의됩니다. 아래와 같은 거래 전략: 색상이 아쿠아이고 가격이 내부 밴드에 있는 경우 장기 주문을 하고, 가격이 외부 밴드를 넘으면 주문을 마감할 시간입니다. 색상이 토마토이고 가격이 안쪽 밴드에 있으면 짧은 주문을 하고, 가격이 바깥쪽 밴드를 넘으면 주문을 마감할 시간입니다. 참고 : 가격이 내부 밴드에 있을 때 진입 시장에만 해당됩니다. 이는 매우

RelicusRoad CopyTrader 는 MetaTrader 4 용 무료 트레이드 카피어( trade copier )입니다. 같은 컴퓨터에 있는 MT4 터미널 간에 거래를 복사하므로, 하나의 계좌로 매매하고 나머지 계좌들이 각자의 크기와 리스크로 이를 따라가게 할 수 있습니다. 완전판이며, 기능 제한이나 체험 기간이 없습니다. 한 계좌로 매매하고, 나머지는 따라오게 하세요. MetaTrader 5: RelicusRoad CopyTrader MT5 작동 방식 하나의 터미널이 리더 (Leader, 마스터)로 동작하며 보유 중인 주문을 공유합니다. 원하는 수의 터미널이 팔로워 (Follower, 슬레이브)로 동작하며 이를 그대로 복제합니다. 터미널은 채널 이름으로 짝지어지므로, 한 대의 컴퓨터에서 여러 개의 독립된 복사 그룹을 동시에 운영할 수 있습니다. 복사는 200밀리초 타이머로 실행되므로, 팔로워는 자신의 차트에 틱이 들어오는 것을 기다리지 않고도 새 주문에 반응합니다. 설정 방
FREE
이 EA는 이동 평균 크로스오버를 사용하여 거래합니다. 완전히 사용자 정의 가능한 설정, 유연한 위치 관리 설정, 사용자 정의 가능한 거래 세션, 마틴게일 및 역 마틴게일 모드와 같은 많은 유용한 기능을 제공합니다. [ 설치 가이드 | 업데이트 가이드 | 문제 해결 | 자주하는 질문 | 모든 제품 ] 사용 및 감독 용이 완전히 사용자 정의 가능한 이동 평균 설정 그것은 두 가지 다른 거래 행동을 구현합니다 맞춤형 손익분기점, SL, TP 및 후행 정지 ECN/비 ECN 중개인을 위한 작업 2-3-4-5 자리 기호에 대해 작동 거래는 NFA/FIFO를 준수할 수 있습니다. 거래는 반대 신호에서 마감될 수 있습니다. 마틴게일 및 역 마틴게일 기능을 구현합니다. 주중 및 시간별로 거래 필터링
내장된 자금 관리 EA는 네 가지 다른 동작을 구현합니다. 일반: 강세 크로스오버에서 매수하고 약세 크로스오버에서 매도 역: 강세 크로스오버에서 매도하고 약세 크로스오버에서 매수 매수만: 강세 크로스
FREE

The EMA Trader System is a technical overlay designed to isolate trend continuation and structural balance across active execution cycles. By processing price action dynamically through multi-timeframe moving average thresholds and robust slope filters, this utility completely eliminates calculation delay and gives traders an instant visual HUD dashboard of live trade signals on a single window.
Utilizing specialized single-pass memory arrays, this system tracks multi-period EMA loops and highe
FREE

as the name suggest Trend Maker Master is a trend scalping indicator that give long and short trading opportunity based on price action and ma style trend filter, the indicator Trend Period and Trend Extra Filter will change arrows signals quality and frequency, this leave a space for trader to come out with good combos for each pair. How to trade : Buy : when white buy arrow prints, set sl below recent swing low, and set tp to 1-1 Risk to reward ratio. Sell : when white Sell arrow prints, set
FREE
Japanese candlesticks can be used for any time frame, whether it be one day, one hour, 30-minutes ….whatever you want! They are used to describe the price action during the given time frame. Japanese candlesticks are formed using the open, high, low, and close of the chosen time period. CandleStick Scanner X provides market analysis through the detection and analysis of Japanese candlestick patterns. Candlestick based market analysis is one of the most popular technical analysis methods. Combina

KT Equal Highs & Equal Lows 는 가격이 동일한 수준에서 두 개 이상의 스윙 고점(Swing High) 또는 스윙 저점(Swing Low)을 형성한 구간을 자동으로 감지하여 유동성 풀(Liquidity Pool)로 표시합니다. Equal Highs는 매수 유동성(Buy-Side Liquidity), Equal Lows는 매도 유동성(Sell-Side Liquidity)을 의미하며, 가격은 반전하기 전에 이러한 유동성 영역을 먼저 테스트하는 경우가 많습니다. 이 지표는 캔들이 완전히 마감된 이후에만 스윙을 확정하므로 리페인트가 발생하지 않습니다. 서로 가까운 스윙은 하나의 유동성 풀로 묶어 표시하며, 각 풀에는 0~100의 품질 점수(Quality Score)가 부여되어 어떤 레벨이 더 중요한지 한눈에 확인할 수 있습니다. 또한 각 유동성 풀이 현재 활성 상태인지, Sweep되었는지 또는 Break되었는지를 지속적으로 추적합니다. 모든 종목과 모든 시간 프레임에서

볼륨 델타 MT4 이 도구는 MetaTrader 4용 전문 주문 흐름 지표로, 두 개의 실시간 모니터링 패널을 통해 매수 및 매도 압력을 시각화하도록 설계되었습니다. 캔들 구조와 틱 볼륨을 기반으로 공격적인 매수 압력과 매도 압력의 차이인 델타를 계산하여 차트를 복잡하게 만들지 않고 시장 지배력을 명확하게 보여줍니다. 이 지표는 외환, 지수, 상품, 암호화폐, 주식 등 모든 상품과 시간대에 적용 가능합니다. 모든 계좌 유형과 완벽하게 호환되며, 실계좌와 데모 계좌 모두에서 사용할 수 있고, CPU 리소스 과부하 없이 안정적인 성능을 제공하도록 최적화되어 있습니다. 모든 계산은 효율적으로 수행되며 필요한 캔들에 대해서만 처리되므로 사양이 낮은 VPS 환경에서도 원활하게 작동합니다. Volume Delta는 두 개의 독립적인 모니터링 패널을 통해 시장 상황을 보여줍니다. Delta Monitor 패널은 현재 델타 값, 임계값, 거래량 및 시장 상태를 상세하게 표시합니다. Status

INFINITY STAT PANEL — account statistics for MetaTrader 5
The INFINITY STAT PANEL shows the trading results directly on the chart.
Analyze profits and losses based on Expert Advisor comments, transaction wizards and trading instruments, track commissions and swaps, and compare results for a selected period.
The panel is suitable for any type of account, including when using multiple Expert Advisors on the same account.
Additional information about the broker, account type, and the broker’s
FREE

What is the ADX_DI Indicator? ADX_DI is an advanced technical analysis indicator developed for MetaTrader platform. It combines Average Directional Index and Directional Indicator components to analyze market trend strength and direction. What Does It Do? Measures Trend Strength : ADX line shows the strength of market trends Determines Direction : DI+ (green) and DI- (red) lines identify trend direction Detects Trend Changes : DI+ and DI- crossovers provide trend reversal signals Automatic Alert
FREE

How much room does gold have left today? This indicator shows the average daily range (ADR) of XAUUSD, how much of it today has already used, where today's ADR high and ADR low are, and how often past days that got this far went on to the full range. Gold ADR Daily Range Meter draws today's ADR high and ADR low on the chart, fills a bar as the day uses its range and alerts you when the day has used its full ADR. A table counts on your own daily history what usually happens next: once a day had u
FREE

Gann HiLo Swing MT4 is a free indicator for MetaTrader 4 with two of W.D. Gann's tools: the HiLo Activator line and the 2-bar swing chart. It shows the trend side and the swings. An arrow and an alert mark the start of a new trend. Everything comes from closed bars, so nothing on the chart changes after its bar has closed. MetaTrader 4 edition: the same calculation, lines and arrows as the MetaTrader 5 version. Only the arrow distance is set as a fraction of ATR, because MetaTrader 4 cannot shif
FREE

ATR Stops is an MT4 indicator that shows the size of market volatility. It helps you decide where to place your stop-loss and take-profit, so you avoid the loss from an oversized stop or the profit drawdown from an oversized target. A very practical indicator. Main features A one-line data panel that tells you the size of the volatility A stop-loss reference line that helps you quickly place your stop A take-profit reference line that helps you quickly place your target Parameters ATRPeriod - AT
FREE

Candle based EXPERT
The signal is based on the number of bullish and bearish candles
Interesting and useful result
Can be used in all currency pairs and all time frames
Can be used in all markets
completely free
Fast and simple Do not forget to use in each currency pair (or broker), first find the best settings for that currency pair (through optimization method in Meta Trader 4).
Settings: Period: The number of candles used to predict the future. Signal: Specifies the trading time. You can se
FREE

QCL Dynamic RSI Zones — MetaTrader 4 QCL Dynamic RSI Zones combines a smoothed RSI signal with adaptive boundaries to help you assess momentum relative to recent market conditions. Instead of relying on fixed overbought and oversold levels, the indicator adjusts its zones using recent RSI behavior. A dynamic balance line, a color-changing signal, and excursion columns display momentum conditions in a separate chart window. Key Features Adaptive boundaries: Upper and lower zones respond to recent
FREE

This is a Multi pair and Multi time frame dashboard. The founder of the system is Mr. Oma Ally, which is a system based from Bollinger Band and Moving Average(BBMA). BBMA consists of the use of 2 indicators: Moving Averages Bollinger Bands BBMA consists of 3 types of entries: Extreme MHV Re-Entry Rejection EMA50 This Dashboard Help you to scan current Extreme, Reentry setup, Rejection EMA50 and also MHV How to read signals:
find the same color in 3 different timeframes in succession
For exampl
FREE

SuperTrend MTF Analytics is a high-performance trend intelligence system engineered to eliminate chart switching and bring institutional-grade multi-timeframe alignment directly to a single workspace. By combining a proprietary, noise-filtering modified ATR algorithm with advanced multi-timeframe overlays, this utility transforms the classic SuperTrend from a simple lagging indicator into a definitive trend-alignment and entry engine. JOIN OUR SUPERTREND MTF COMMUNITY Stop trading in a sil
FREE

개요 ExportCSVFile 은(는) MetaTrader 4용 스크립트로, 지정된 기간 동안의 계좌 거래 내역을 CSV 파일로 내보냅니다.
거래 성과 분석, Excel 보고서 작성, 수동 거래 기록 관리 등에 유용합니다.
이 스크립트는 거래를 실행하지 않으며, 모든 계좌에서 안전하게 사용할 수 있습니다. 주요 기능 사용자가 지정한 기간의 계좌 내역을 CSV 파일로 내보내기 Excel에서 바로 열 수 있는 CSV 형식(쉼표 구분)으로 저장 주요 필드 포함: Ticket, Type, Symbol, OpenTime, CloseTime, Lots, Price, Profit, Swap, Commission, Magic, Comment UTF-8(BOM 포함) 인코딩으로 문자 깨짐 방지 내보내기 전에 확인 대화상자를 표시하여 안전하게 실행 출력 필드 CSV 파일에는 다음과 같은 열이 포함됩니다. Ticket, Type, Symbol, OpenTime, CloseTime, Lots, OpenP
FREE
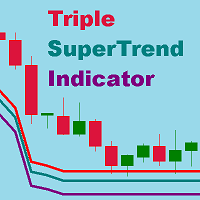
Super trend is one of the best trend indicators in metatrader 4 (MT4). Triple SuperTrend indicator is an indicator that consist of three super trend indicator that can be aranged. This indicator is built by mql4 language and doesn't provided by MT4 platform. Highly recommended using EMA SuperTrend Strategy Indicator if you want to get better result in here:
https://www.mql5.com/en/market/product/91664
This indicator is easy to use, power full and has many benefits, there are: Using three indic
FREE

WONNFX iSTATS: Account Statistics on Your Chart A free indicator for MetaTrader 4. It shows your account’s trading results in a compact panel right on the chart: balance, equity, profit for the day, week, month, quarter and year, plus key risk metrics. No reports, no History tab, no calculators: everything you need at a glance. The indicator does not trade. It never opens or closes positions; it only reads the account history and open positions.
Features Account card Balance and equity in larg
FREE

Pivot Tide — 파동 피벗, 자동 추세선, 추세선 기반 추세 방향 판단 Pivot Tide 는 MetaTrader 4용 인디케이터입니다. 차트를 자동으로 파동 단위로 나누고, 각 파동의 고점과 저점에 마커를 표시하며, 이를 이어 추세선을 그리고, 추세선의 상태로 추세 방향을 판단합니다. 모든 내용은 차트 위에 바로 표시되며, 간결한 정보 패널도 함께 제공됩니다. 모든 종목, 모든 시간 프레임에서 사용할 수 있습니다. MT5-version: https://www.mql5.com/en/market/product/199662
기능 파동을 감지합니다. 파동은 두 이동평균선의 관계로 정의됩니다. 빠른 SMA와 느린 LWMA입니다. 빠른 선이 느린 선 위에 있는 동안은 상승 파동, 아래에 있는 동안은 하락 파동입니다. 피벗을 표시합니다. 파동이 끝나면(이동평균선이 교차하면) 그 극값에 마커를 놓습니다. 상승 파동의 고점 또는 하락 파동의 저점입니다. 추세선을 그립니다. 연속된 같은

MT4 버전: https://www.mql5.com/en/market/product/183369 MT5 버전: https://www.mql5.com/en/market/product/183370
Heikin Ashi Smoothed
Heikin Ashi Smoothed는 정교한 Heikin Ashi 평활화 기법을 사용하여 시장 방향, 추세 전환, 잠재적인 진입/청산 영역을 파악하는 데 도움을 주는 전문적인 추세 추종 지표입니다. 표준 Heikin Ashi와 달리, 이 지표는 2단계 평활화 과정을 적용하여 시장 노이즈를 줄이고 추세 시각화를 더욱 명확하게 합니다. 깔끔한 차트, 부드러운 추세 신호, 그리고 다중 시간 프레임 확인을 원하는 트레이더에게 적합합니다. 이 지표는 평활화된 Heikin Ashi 캔들을 메인 차트에 직접 표시하며, 사용 편의성을 높이기 위해 화살표, 알림, 다중 시간 프레임 모드, 차트 켜기/끄기 버튼을 선택적으로 제공합니다.
주요 기능 메인 차트에 평활화
FREE

거래 정확도를 높여보세요 WH 트레이딩 세션 MT4 MetaTrader 4를 위한 지표! 이 강력한 도구는 주요 시장 세션을 손쉽게 시각화하고 관리하는 데 도움이 됩니다. 기반 : WH SMC Indicator MT4
MT5 버전 : WH 트레이딩 세션 MT5 주요 특징: 대화형 GUI 패널 – 쉽게 선택하고 전환하세요 아시아, 런던, 뉴욕 거래 세션.
사용자 정의 가능한 알림 및 설정 – 직관적인 인터페이스를 통해 전략에 맞게 지표를 조정하세요. 옵션 탭 .
빠르고 반응성이 좋은 인터페이스 – 매끄러운 경험을 즐겨보세요 이동 가능하고 최소화 가능하며 최대화 가능한 패널입니다 .
자동 GMT 오프셋 처리 – 수동 조정이 필요 없습니다. 세션은 항상 시장 시간에 맞춰 조정됩니다.
Trading Session을 통해 시장 활동을 앞서가고 거래
FREE

Dark Mimas is a fully automatic Expert Advisor for Scalping Trading. This Expert Advisor needs attention, in fact presents highly customizable. Dark Mimas is based on Dark Oscillator indicator, these Trades can be manage with some strategies. The expert advisor is able to get a very high-rate of winning trades. Optimization experience is required to Download the robot. My tests are indicative, for best results it is necessary to study the user manual and create your settings. All the se
FREE

GRock EA – XAUUSD Smart Grid Recovery System GRock EA is a professional automated trading solution developed specifically for XAUUSD (Gold) on the H1 timeframe. The system combines trend-following logic, adaptive grid management, and integrated risk controls to provide a structured approach to automated gold trading. Designed for traders seeking a balance between opportunity and risk management, GRock EA continuously analyzes market conditions and adapts its behavior based on volatility and
FREE

Harmonic + Ratio — 멀티 패턴 반전 시스템 클래식 하모닉 패턴(ABCD, Gartley, Bat, Butterfly, Crab)을 결합한 고정밀 반전 인디케이터 대부분의 하모닉 인디케이터는 기하학적으로 가능한 모든 패턴을 표시하여 차트를 복잡하게 만듭니다. Harmonic + Ratio 는 패턴 구조가 반전 방향으로 명확한 불균형을 보여주고, 캔들 확인 조건이 충족될 때에만 신호를 생성합니다 — 이를 통해 노이즈가 많은 스캐너를 선택적인 트레이딩 도구로 바꿉니다. 핵심 기능 5가지 하모닉 패턴 자동 감지 — ABCD, Gartley, Bat, Butterfly, Crab (각각 개별적으로 활성/비활성 가능) 4단계 허용 오차 설정 — 매우 공격적(15%)부터 매우 보수적(4%)까지 선택 가능 캔들 확인 필터 — Piercing Line, Dark Cloud, 상승/하락 Engulfing, Inside Bar, Pin Bar 등 (선택적 적용) 리페인트 없음 — 패
FREE

Product Overview Liquidity Pool Hunter is a liquidity pool main chart indicator designed specifically for both MT4 and MT5 platforms. Based on institutional order flow theory, it constructs liquidity accumulation zones by statistically analyzing recent highs and lows, precisely identifying sweep, fake break, and true break behaviors in the market. This indicator helps traders view the market from an institutional perspective, recognizing smart money liquidity hunting behavior, thereby captu

Dual Scale Candles MT4 draws a second symbol's candles over your chart, with the second symbol's own prices on a separate left scale. Compare two instruments on one chart. The overlay uses a linear price mapping to fit the second symbol to the chart. Choose alignment at the first available bar of the current day or week, at the oldest drawn bar, or choose Range Fit. Day and week modes show a vertical anchor line. If the beginning of the period is not loaded, the label identifies the partial peri
FREE

VR Locker 는 MetaTrader 4 및 MetaTrader 5용 독특한 전문가 고문으로, 고전적 헤징을 진정한 이익 관리의 예술로 바꿉니다. 시장과 싸우는 대신 VR Locker는 저자의 독특한 포지티브 락 논리를 사용합니다: 로봇이 동일한 수량의 반대 포지션을 열고 가격을 따라 주문 그리드로 「밀어내며」 미실현 이익을 「안전 쿠션」에 축적합니다. 이는 예치금 하락을 줄이고, 종종 0으로 만들며, 트레이더의 스트레스를 덜어줍니다. 9가지 랏 계산 방법, 13가지 거리 유형, 실제 TakeProfit의 4가지 평균화 모드, 여러 락을 동시에 스마트하게 관리하는 기능, Telegram, Push, Email, Alert 통합 알림 시스템은 VR Locker를 시장에서 가장 신중하게 설계된 「락커」로 만듭니다 — 초보자와 전문가 모두에게 이상적인 선택입니다. 설정 파일(set files), 제품 데모 버전, 지침 및 보너스는 [블로그] 에서 확인할 수 있습니다 락 관리에 VR L

Общие сведения Для начала торговли достаточно небольшого депозита. Идеален для быстрого разгона депозита!!! Подходит для мультивалютной торговли. Невосприимчивость к большой задержке и величине спреда.
Принцип работы После запуска советника на графике советник запоминает уровень открытия первого ордера. Выше уровня открытия первого ордера советник выставляет сеть ордеров на Sell . Ниже уровня открытия первого ордера советник выставляет сеть ордеров на Buy . Если общая прибыль ордеров на покуп
FREE

Pegasus Quantum – Intelligent Gold Trading on MT4 (XAUUSD)
Pegasus Quantum is an advanced Expert Advisor specifically designed to trade XAUUSD on MetaTrader 4 , combining algorithmic logic, dynamic risk management, and precise execution on lower timeframes. After a long period of development and optimization under real market conditions, Pegasus Quantum was created with a clear goal: to deliver a trading system that is robust, flexible, and adapted to gold market behavior .
️ Optimized for:
FREE
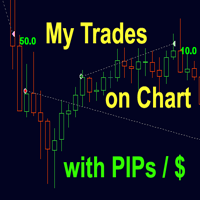
놓치고 싶지 않은 거래 도구. 표시기는 차트의 모든 거래/거래에 첨부 된 기호로 표시됩니다. 이익 또는 손실의 핍 수를 인쇄합니다. 선택에 따라 더 나은 분석을 위해 하위 창을 통해 수직선을 인쇄합니다.
여기에서도 확인하십시오 : My Trade History Pro https://www.mql5.com/en/market/product/50206
또한 예금 통화의 거래 결과 및 총 PIP에 대한 정보를 추가합니다.
당신은 오늘의 거래 만 보여 주거나 여러 막대 내에서 거래 만 보여 주도록 선택할 수 있습니다.
지정된 마법 번호로 거래를 표시 할 수 있습니다. 값이 0으로 설정되면 표시기는 모든 거래를 표시합니다. 전문가 고문의 마법 수를 지정하면 EA의 거래 만 표시됩니다. 입구 오버 엔트리 화살표에는 주문 번호, 댓글 및 마법 번호가 표시됩니다.
이 표시기는 주로 통화 강도의 다른 특수 지표 중 하나와 함께 사용됩니다. https://www.mql5.com/en/blog
FREE

Info Plus is a simple tool that displays the current status on an asset class. The information displayed by Info Plus includes: Bid Price The high and low of the day. Candle time left. Current spread. Selected timeframe. Asset class selected (Symbol). Pip value. Open Positions. Total pips booked. Pips per trade. Session times (they may not be accurate and are subject to changes). Date and time.
How it Works When loaded onto any chart, Info Plus automatically gets the following parameters: Bid P
FREE
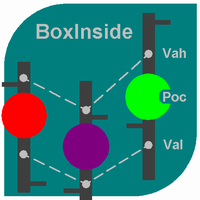
This indicator calculates the volume profile and places labels that correspond to the VAH, VAL and POC levels, for each candle individually.
Indicator operation features The indicator works on the timeframes from M5 to MN, but it uses the history data of smaller periods: M1 - for periods from M5 to H1, M5 - for the H4 period, M30 - for the D1 period, H4 - for the W1 period, D1 - for the MN period. The color and location of the VAL, VAH and POC labels on the current candle are considered to be c
FREE

SAAD TrendTracker is a fully automated EA. It is based on mathematical algorithms Trend Tracker indicator and SAADScalper. The EA scalps pips by its strong Entry strategy based on SAADScalper. Trades that are not successful to scalp are handled in a different way of uniquely designed algorithm based on Trend Tracker indicator. EA is designed for M1, M5, M15 and M30. It consults daily chart for successful trading accuracy. It consults H1 to handle unsuccessful trades using Trend Tracker Indicator
FREE
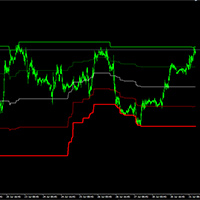
Price Channels are also known as Donchian Channels being named after Richard Donchian. They use the highest and lowest price of a set number of periods to create an upper and lower channel or envelope around the price. The upper channel shows the high of the number of periods chosen. The lower channel shows the low of the number of periods chosen. For example, the screenshot shows the Price Channels using 320 periods. The upper channel in the screenshot shows the highest high of the previous 3
FREE

GoldKiller EA – Professional Expert Advisor for Gold Trading (XAUUSD) General Overview GoldKiller EA is an advanced Expert Advisor specifically designed for gold trading (XAUUSD) . It is not a simple grid robot, but a complete capital, risk, and profit management system , built to operate over the long term in an extremely volatile market. Unlike classic EAs focused purely on raw performance, GoldKiller prioritizes capital preservation , progressive profit protection , and strict risk control .

평균 실제 범위( ATR )는 지정된 일수 동안의 시장 변동성을 측정한 것입니다. 가격이 박스권 끝에 도달했을 때 큰 폭의 연속 움직임을 기대해서는 안 됩니다. 시장에 연료가 떨어진 것으로 간주됩니다. 가격이 가장자리에 도달하지 않은 경우 여전히 이동 마진이 있습니다. 인디케이터 공식을 사용하면 고점-저점 레벨을 종합적으로 또는 개별적으로 계산할 수 있습니다. 이러한 레벨을 지지/저항 및 목표로 사용할 수도 있습니다.
매개변수 입력.
Start Day - 하루의 시작을 몇 시부터 계산할 것인가. 00 - 기본값입니다. ATR - 계산할 일수입니다. Calc Mode - 계산 방법 선택 (높음-낮음 / 높음 및 낮음).
Visual Button - 버튼 표시(활성화/비활성화). Corner - 버튼 앵커 각도. X indent - 픽셀의 수평 패딩. Y indent - 픽셀의 수직 패딩.
Label Visual - 디스플레이 레벨 레이블. Label Font Size -
FREE

RSI Divergence MT4을 소개합니다. 가격 움직임과 RSI (상대 강도 지수) 간의 관계를 분석하여 추세 반전을 식별하도록 설계된 강력한 지표입니다. 의사 결정 과정을 향상시키고자 하는 트레이더에게 완벽한 이 도구는 발산 패턴을 기반으로 잠재적인 매수 및 매도 신호에 대한 통찰력을 제공합니다. 강세 및 약세 발산을 모두 감지할 수 있는 RSI Divergence MT4은 트레이더가 약화되는 추세를 포착하고 종료 전략을 최적화할 수 있도록 합니다. 숙련된 트레이더든 이제 막 시작하는 트레이더든 이 지표는 거래 결과를 크게 개선할 수 있습니다. MQL 제품 설치 가이드 | MT4에서 구매한 MQL 제품 업데이트 | 일반 문제 해결 가이드 | 지표 설정 / 가이드 주요 기능 버퍼 통합: 지표 값을 접근 가능한 버퍼로 노출하여 Expert Advisor가 자동 거래를 위한 실시간 신호를 활용할 수 있도록 합니다. 빠르고 백테스트 가능: MetaTrader의 네이티브 OnCalcu
FREE

WaveForce Structure is a manual market-structure toolkit built around the impulse–correction–impulse logic. Core idea
You mark three structure points. The indicator helps you formalize the markup, zones, and working levels. It does not replace your decision with automatic buy/sell calls. Panel features 1-2-3 markup
Place structure points, lines, and labels. Suitable for impulse sequences and for reading corrective formations. Zones
Zones between key legs of the markup with adjustable fill. Usefu
FREE

Trading XAUUSD is a double-edged sword. Its massive volatility offers incredible profit potential, but it also carries significant risk for those without a disciplined strategy. Today, I am excited to introduce my latest automated trading system: B Clode . Built specifically for the XAUUSD H1 timeframe , B Clode was engineered to harmonize high-frequency grid trading with intelligent risk management.
1. Why B Clode for XAUUSD? Gold is notorious for its "noise." By focusing on the H1 timeframe
FREE

Median Cross 지표는 Forex 및 기타 금융 시장에서 강력한 도구입니다. 전통적인 이동평균선과 달리 두 개의 중앙값 선을 그리고, 교차 시 화살표와 알림을 제공하여 트렌드 변화와 진입점을 더 빠르고 신뢰성 있게 파악할 수 있습니다. 중앙값 가격은 가격 범위의 중간값을 나타내며, 이동평균선보다 급격한 변동, 극단값, 단기 노이즈에 덜 민감합니다. 이로 인해 더 부드럽고 명확한 신호를 제공하며, 변동성이 높거나 횡보하는 시장에서 특히 유용합니다. MA는 극값에 의해 왜곡될 수 있지만, 중앙값은 실제 가격 움직임을 정확히 반영합니다. 트렌드 및 박스권 거래에 활용 가능하며, 주요 지지와 저항 포인트를 쉽게 식별할 수 있습니다. 화살표와 알림으로 차트를 계속 확인하지 않아도 빠르게 대응할 수 있으며, 다른 도구와 결합하면 의사결정 정확도를 높이고 잘못된 신호를 줄입니다.
FREE

표시기는 지정된 수의 양초를 분석하고 고가를 기준으로 피보나치 수준을 표시합니다. 레벨이 재정렬되기 때문에 범위의 오른쪽에 관심이 있습니다. 가격은 레벨을 자화하고 터치에 반응합니다. 이 도구를 사용하여 수정 후 추세 진입점을 찾습니다. 왼쪽에서 레벨이 완벽하게 상승한 것을 보면 극한 지점에서 움직임의 끝을 발견했다고 가정할 수 있습니다. 모든 선은 버퍼 또는 개체를 통해 그려집니다(선택 사항).
입력 매개변수.
Bars Count - 계산 범위.
Visual Button - 버튼 표시(활성화/비활성화). Corner - 버튼 앵커 각도. X indent - 픽셀의 수평 패딩. Y indent - 픽셀의 수직 패딩.
Label Visual - 디스플레이 레벨 레이블. Label Font Size - 글꼴 크기. Label Shift Bars - 비문의 들여쓰기(촛불의 수). Label Tooltip - 레벨 위의 커서 아래에 텍스트 표시.
Draw Lines
FREE

The Super Arrow PRT Indicator generates high-probability trading signals by using multiple indicators such as Moving Averages, Bull/Bear power, Relative Strength Index (RSI), Bollinger Bands, and Magic Filter. It filters out false signals and provides good trade signals by combining these indicators. The Supper Arrow PRT indicator is a trend reversal system that paints buy/sell signal arrows at the potential reversal zone of the price. The buy/sell signal arrows are painted directly on the ch
FREE

NZDCAD에 특화된 안정형 EA 주요 특징 적응형 조기 이익 실현 로직
여러 그리드 포지션이 누적되면, EA가 자동으로 조기 이익 실현 전략을 가동하여 건강한 마진 수준을 유지합니다. 보유 시간 기반의 청산 전략
포지션 보유 시간이 설정한 최대 시간을 초과할 경우, 시스템이 자동으로 조기 청산하여 위험을 줄이고 수익을 확보합니다. 유연한 이익 실현(Take Profit) 설정
롱 포지션과 숏 포지션 각각에 별도의 이익 목표를 설정할 수 있어, 본인의 리스크 성향과 거래 스타일에 맞춘 운영이 가능합니다. 꾸준하고 안정적인 거래 방식
단일 거래당 수익은 비교적 적지만, 장기적으로 일관된 성과와 심리적 안정감을 중시합니다. 성과 요약 2007년 8월 21일 부터 2025년 6월 27일 까지, 초기 자금 10,000 USD 가 84,297 USD 로 성장하였습니다. 수익 팩터(PF): 1.98 최대 낙폭(Drawdown): 36.67% 승률: 67.23% 거래 조건 복리 설정: 활
플라워 지표는 주로 추세를 파악하고 스캘핑 또는 일중 거래 전략을 지원하는 데 사용되는 기술 분석 도구입니다.
플라워 지표는 기술적 분석 및 가격 변동 분석을 기반으로 하는 신호 추세 지표입니다. 파란색 꽃은 상승 추세를, 빨간색 꽃은 하락 추세를 나타내는 등 다양한 색상의 꽃을 사용하여 추세를 시각적으로 보여줍니다.
각 레벨은 지지선과 저항선 역할을 할 수 있습니다(+/- 200 레벨과 차트에 나타나는 점을 주의 깊게 살펴보세요).
과매수/과매도 고정 레벨이나 그에 따른 밴드, 또는 둘 다, 또는 둘 중 하나를 돌파할 때 점이 나타나도록 설정할 수 있습니다.
이 지표는 시장의 잠재적 반전을 감지하고 매집/분산 구간을 파악합니다. 모든 상품 및 시간대와 호환되며, 매개변수는 필요에 따라 조정할 수 있습니다. 각 레벨은 지지선과 저항선 역할을 할 수 있습니다.
FREE
Non-Repainting Indicator dont; s forget this;s work well stronger trend fast markert lower time frame How to trade with SL Scalping Arrow * this system trend trading system we trade 15M chart using day tp,if you want identify Accumulation Distribution (H4) i am reccomend my SL Currency Strength Meter 28 Pair monthy weekly strenght you can easy filter best rank symbol list weekly monthy * we dont;s trade trend change time waiting trade next day pullback * if you want golden entry find. SL Cur
MetaTrader 마켓은 개발자들이 거래 애플리케이션을 판매할 수 있는 간단하고 편리한 사이트이다.
제품을 게시하고 마켓용 제품 설명을 어떻게 준비하는가를 설명하는 데 도움이 됩니다. 마켓의 모든 애플리케이션은 암호화로 보호되며 구매자의 컴퓨터에서만 실행할 수 있습니다. 불법 복제는 불가능합니다.
