 MetaTrader 5
 Experts
 지표
지표
 스크립트
스크립트
 라이브러리
라이브러리
 보관함
보관함
당사 팬 페이지에 가입하십시오

CME Gap Tracker for Gold and Bitcoin: Open Gaps, Fill Rate and a Fade-Trade Test - MetaTrader 5용 지표

- 조회수:
- 124
- 게시됨:
-
 이 코드를 기반으로 한 로봇이나 지표가 필요하신가요? 프리랜스로 주문하세요
프리랜스로 이동
이 코드를 기반으로 한 로봇이나 지표가 필요하신가요? 프리랜스로 주문하세요
프리랜스로 이동

CME Gap Tracker for Gold and Bitcoin: Open Gaps, Fill Rate and a Fade-Trade Test
Finds the weekend CME gap on gold and on 24/7 Bitcoin charts, keeps every unfilled gap on the chart until price returns to it, and shows how often gaps filled, how fast, how far price ran first, and what fading them would have made. Non-repainting, with buffers for an Expert Advisor.
The idea
"CME gaps always fill" is something you hear in every Bitcoin chat and in a lot of gold channels too. CME futures stop trading on Friday at 16:00 Chicago time and start again on Sunday at 17:00. Whatever the market did in between shows up as a gap on the futures chart, and the belief is that price comes back to close it.
I wanted two answers before I believed it. How often does the gap actually fill? And if it does fill, can you make money trading toward it, or does price run the other way first and stop you out? This indicator answers both on your own chart.
What it does
- Converts the CME Friday close and Sunday open to your broker's server time, with the US daylight saving rule for Chicago and the rule of your server clock.
- Takes the price of your chart at those two moments. The difference is the gap. Gaps smaller than InpMinGapPct (0.30% by default) are ignored.
- Draws each gap as a box and labels it with its size. An unfilled gap stays on the chart, extended to the right, until a closed bar trades back to the Friday close. Then the box turns gray and the label shows how many hours the fill took.
- Puts an arrow on the bar where CME opened: up for a gap down, down for a gap up, in the direction of the fill.
- Shows a scorecard panel for the last InpWeeksBack weeks (104 by default).
On a Bitcoin chart that trades all weekend there is no visible gap between Friday's last bar and Monday's first bar, so an ordinary weekend-gap tool finds nothing. The CME gap only appears when you look at the price at the two CME moments, which is what this indicator does. On gold the spot market closes over the weekend too, so the CME gap and the broker's weekend gap are almost the same thing.
One thing to be clear about: the indicator uses the prices of the chart it runs on, not the futures prices. On a spot or CFD chart you get the spot move over the CME weekend. The gap on the real futures chart can differ a little because futures trade at a premium or discount to spot.
What the panel shows
- The number of gaps, split into up and down, and how many weekends were below the minimum size.
- How many gaps filled, and what share filled within 24 hours and within 7 days.
- The median time to fill, and the time the slowest 10% of gaps needed.
- Heat before fill: how far price ran away from the fill level before it came back, in multiples of the gap size. A heat of 2.0x on a 1% gap means price first moved another 2% the wrong way.
- A fade-trade test: enter at the CME open toward the Friday close, stop at InpStopGapMult times the gap size on the other side, exit after InpMaxHoldDays days if neither level is hit. The spread of the entry bar is charged. When the stop and the target are both inside one bar, the stop is counted.
- The number of open gaps in the scored window, and the nearest open fill level above and below the current price (these two look at every gap in the loaded history).
What it found on gold
XAUUSD H1, MetaQuotes-Demo data, default inputs except where noted. The two windows overlap by a few days at the end of December 2025.
| 2026, 38 weeks to 18 Sep | 2026, 38 weeks to 18 Sep | 2025, 52 weeks to 31 Dec | 2025, 52 weeks to 31 Dec | |
|---|---|---|---|---|
| Minimum gap | 0.30% | 0.10% | 0.30% | 0.10% |
| Gaps (up / down) | 24 (10 / 14) | 33 (13 / 20) | 6 (2 / 4) | 19 (9 / 10) |
| Filled | 23 (96%) | 32 (97%) | 5 (83%) | 18 (95%) |
| Filled within 24 h | 58% | 67% | 50% | 68% |
| Filled within 7 days | 83% | 85% | 50% | 74% |
| Median time to fill | 7 h | 3 h | 3 h | 3 h |
| Median heat before fill | 2.18x gap | 2.31x gap | 2.16x gap | 1.70x gap |
| Fade trades, stop 1x gap | 24 | 33 | 6 | 19 |
| Fade win rate | 29.2% | 27.3% | 16.7% | 26.3% |
| Fade profit factor | 0.41 | 0.37 | 0.20 | 0.35 |
| Fade total | -10.1R | -15.1R | -4.0R | -9.1R |
So the saying is mostly true on gold: 83% to 97% of the gaps filled. The trade is where it falls apart. Among the gaps that filled, the median one first ran about twice its own size the wrong way, so most fade trades with a stop of one gap size lost.
I tried wider stops with the 0.30% minimum. A wider stop wins more often, but each loss is bigger and the total stayed negative in both years:
| Stop | 2026 win rate | 2026 total | 2026 PF | 2025 win rate | 2025 total | 2025 PF |
|---|---|---|---|---|---|---|
| 1x gap | 29.2% | -10.1R | 0.41 | 16.7% | -4.0R | 0.20 |
| 2x gap | 45.8% | -7.0R | 0.44 | 33.3% | -3.0R | 0.25 |
| 3x gap | 66.7% | -2.0R | 0.72 | 50.0% | -2.0R | 0.33 |
2025 had only 6 gaps of 0.30% or more, so treat that column as a small sample. What I take from it is simple. On gold the gap is a good place to expect price to visit, but fading it at the open with a fixed stop didn't pay in either year.
Some gaps don't fill for a long time. As of 18 September 2026 one gold gap from 2025 was still open with a fill level of 3201.00, far below the price.
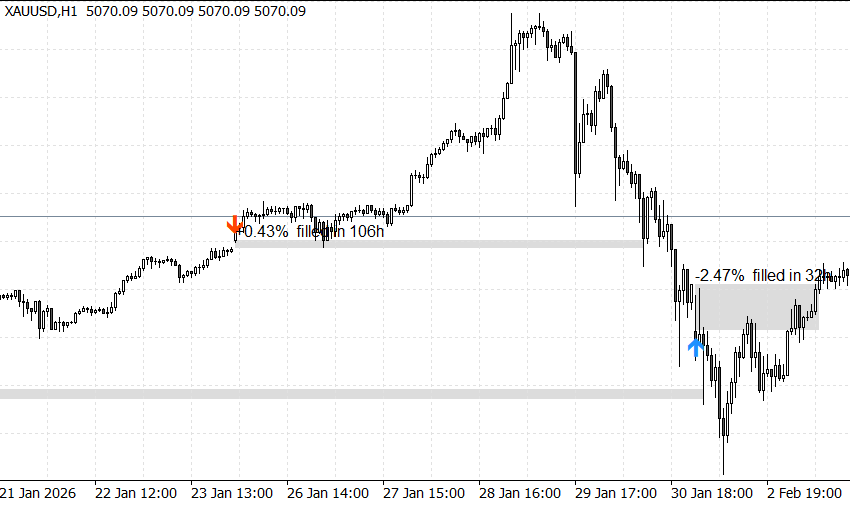 Fig. 1. XAUUSD H1, late January 2026: a +0.43% gap filled in 106 hours and a -2.47% gap filled in 32 hours
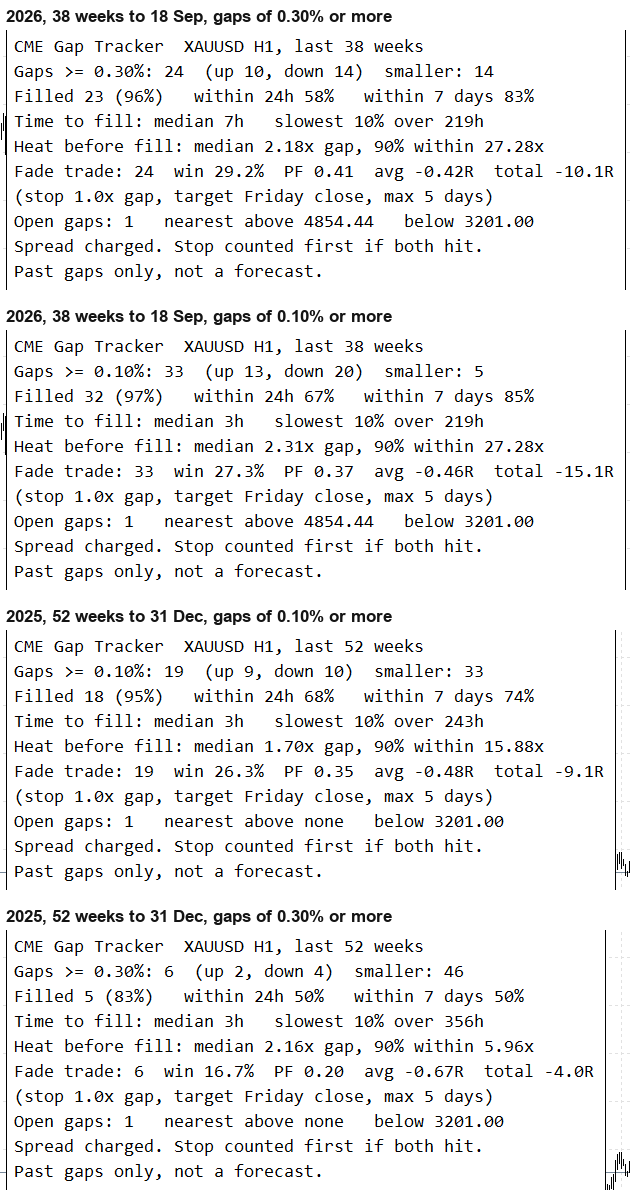 Fig. 2. The scorecard panel for the four runs in the table
About Bitcoin
I couldn't test it on Bitcoin. My test broker, MetaQuotes-Demo, has no 24/7 BTCUSD, only a Bitcoin ETF that trades during Nasdaq hours. The code path for a 24/7 chart is the same one that runs on gold: the price at the Friday close time and at the Sunday open time. Before you rely on it for BTC, check the first few gaps against a CME futures chart, and set the server offset inputs for your broker.
Inputs
| Input | Default | What it does |
|---|---|---|
| InpGMTWinter | 2 | Server GMT offset in winter, hours |
| InpGMTSummer | 3 | Server GMT offset in summer, hours |
| InpServerDST | Europe | Daylight saving rule of the server clock (fixed, Europe or USA) |
| InpMinGapPct | 0.30 | Minimum gap size, % of price |
| InpWeeksBack | 104 | Weeks of history in the scorecard |
| InpDrawWeeks | 26 | Weeks of filled gaps drawn (open gaps are always drawn) |
| InpStopGapMult | 1.0 | Fade test: stop as a multiple of the gap |
| InpMaxHoldDays | 5 | Fade test: exit after this many days |
| InpShowPanel | true | Show the scorecard panel |
| InpPanelCorner | left upper | Panel corner |
| InpOpenGapColor | light orange | Color of unfilled gaps |
| InpFilledGapColor | Gainsboro | Color of filled gaps |
| InpAlertNewGap | true | Alert when a new gap opens |
| InpAlertFill | true | Alert when an open gap is filled |
| InpAlertPush | false | Also send push notifications |
The defaults (GMT+2 in winter, GMT+3 in summer, European rule) match MetaQuotes-Demo and many other MetaTrader brokers. If your broker's server runs on UTC all year, set both offsets to 0 and the rule to fixed. Use H1 or a lower timeframe. On H4 and above the CME times fall inside a bar and the prices are less exact.
Using it from an Expert Advisor
The gap is written on the bar where CME opened, as soon as that bar opens, so an EA reads it at shift 0. It only uses the Friday close and the open price of that bar, so it never changes afterwards. I checked this with a test EA that recorded every gap as it appeared and compared the list with the indicator's buffers at the end of the run: 24 of 24 gaps matched on gold in 2026.
| Buffer | Content |
|---|---|
| 0 | Gap down (fade buy), value is the entry price, EMPTY_VALUE otherwise |
| 1 | Gap up (fade sell), same format |
| 2 | Fill level (Friday close) on the gap bar |
| 3 | Fade-test stop on the gap bar |
| 4, 5 | Nearest open fill level above and below each closed bar |
| 6 to 9 | Scorecard on the last closed bar: closed fade trades, wins, total R, sum of losing R |
int      handle;
datetime lastBar = 0;

int OnInit()
  {
   handle = iCustom(_Symbol, PERIOD_H1, "CMEGapTracker");
   return(handle == INVALID_HANDLE ? INIT_FAILED : INIT_SUCCEEDED);
  }

void OnTick()
  {
   //--- a gap is written on the CME open bar as soon as that bar opens
   datetime bar = iTime(_Symbol, PERIOD_H1, 0);
   if(bar == lastBar)
      return;
   lastBar = bar;

   double up[1], down[1], target[1], stop[1];
   if(CopyBuffer(handle, 1, 0, 1, up) < 1 || CopyBuffer(handle, 0, 0, 1, down) < 1 ||
      CopyBuffer(handle, 2, 0, 1, target) < 1 || CopyBuffer(handle, 3, 0, 1, stop) < 1)
      return;

   if(up[0] != EMPTY_VALUE)
      Print("Gap up, fill level ", target[0], ", fade stop ", stop[0]);
   if(down[0] != EMPTY_VALUE)
      Print("Gap down, fill level ", target[0], ", fade stop ", stop[0]);
  }
Buffers 4 and 5 are handy for a different kind of EA, one that uses open gaps as targets for trades it takes for other reasons. The indicator has no input groups on purpose, because MQL5 counts each "input group" as a parameter of iCustom() and every value after it would shift by one.
Limits
It works on bar data, so it can't tell the order of events inside one bar. It uses your chart's prices at the CME times, not the futures prices. US holidays that shorten the CME week are not handled separately. The fade test charges the spread of the entry bar but no commission and no slippage, and weekend opens are exactly when slippage is worst. All the numbers above describe past gaps on one broker's data.
Ali Rajput
 Trade Reporter Lite - Telegram trade notifications
Posts your MT5 opens and closes to a Telegram chat: side, symbol, entry, stop and target in pips, lots, and on close the result, pips, R-multiple and time held. Retry queue, restart-safe, never trades. Free version of Trade Reporter Telegram and Discord.
ATR Trailing Stop (Pine Script Port)
MQL5 port of a Pine Script ATR trailing-stop indicator: nLoss = ATR-multiple, the stop ratchets under price in an uptrend and over price in a downtrend, and flips (with a buy/sell arrow) when price closes through it. Includes a Python reference port and a parity test that checks both agree with a literal, bar-by-bar transcription of the Pine semantics (na/nz/series history).
Gold Breakout EA for XAUUSD H4 +90 Percent in a 2020 to 2026 Backtest
A Turtle-style breakout EA for gold. It buys when an H4 bar closes above the 20-bar high in an uptrend, with a 2 ATR stop and a 2R target. Backtested on XAUUSD from January 2020 to September 2026: +9,029.72 on 10,000 at 1% risk, profit factor 1.77, max drawdown 11.38%, 6 of 7 years profitable.
Turtle Breakout Indicator Tested on Gold: Profitable in 2025 and 2026 (70)
Turtle-style Donchian breakouts on gold, followed with three exits at once: an ATR trailing stop, the Turtle exit channel and a fixed target. Backtested on XAUUSD H1 and H4 in 2025 and 2026, where all twelve combinations were profitable. Non-repainting, with buffers for an Expert Advisor.