 MetaTrader 5
 Experts
 지표
지표
 스크립트
스크립트
 라이브러리
라이브러리
 보관함
보관함
거래 로봇을 무료로 다운로드 하는 법을 시청해보세요
당사를 Facebook에서 찾아주십시오!
당사 팬 페이지에 가입하십시오
당사 팬 페이지에 가입하십시오
스크립트가 마음에 드시나요? MetaTrader 5 터미널에서 시도해보십시오

EdgeMeter - does your entry signal beat the spread? - MetaTrader 5용 스크립트

- 조회수:
- 13
- 평가:
- 게시됨:
-
 이 코드를 기반으로 한 로봇이나 지표가 필요하신가요? 프리랜스로 주문하세요
프리랜스로 이동
이 코드를 기반으로 한 로봇이나 지표가 필요하신가요? 프리랜스로 주문하세요
프리랜스로 이동


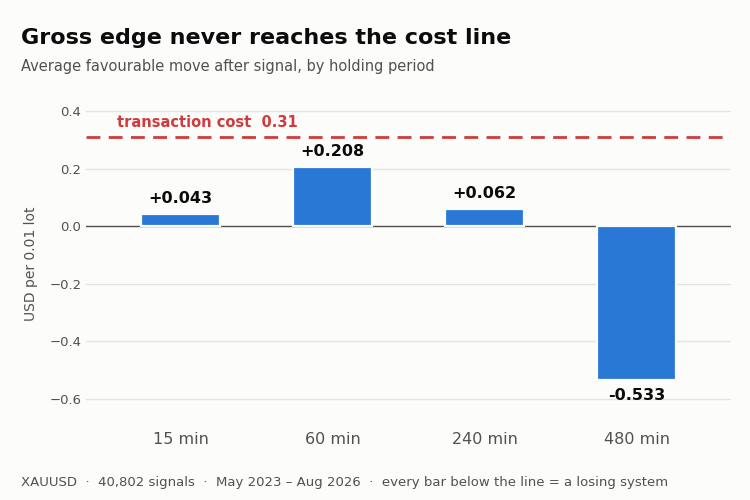
EdgeMeter는 모든 진입 신호에 대해 다음과 같은 한 가지 질문에 답합니다:
거래 비용을 제하고도 이 신호가 수익을 내는가?
이 도구는 주문을 체결하지 않습니다. 대신 과거 데이터를 분석하여, 매 거래가 종료된
바마다 신호를 평가한 후 결과를 출력합니다.
이 프로그램을 만든 이유
저는 한 달 동안 XAUUSD M1 차트에서 그리드 EA를 개발했습니다. 스톱 로스를 고정하고,
변동 손실 상한선, 반전 청산, 최대 바스켓 보유 기간을 추가했습니다. 하지만 계속해서 손실을 기록했습니다.
마침내 진입(ENTRY) 신호만을 따로 분석해 보았을 때, 그 답을 도출하는 데 30
초 만에 나왔습니다:
신호 발생 후 15분 동안의 평균 변동폭: +0.04
왕복 거래당 지불한 스프레드 : 0.26
어떤 청산 로직으로도 이를 만회할 수 없습니다. 자금은 진입 시점에 이미 손실되었고, 청산에
출구 전략에 쏟은 시간은 모두 낭비였습니다. 바로 이런 상황을 방지하기 위해 이 스크립트가 존재합니다.
보고 내용
사용자가 지정한 각 보유 기간에 대해:
- 총 우위: 신호 발생 후 나타난 평균 긍정적 가격 변동
- 원가 차감 후 순수익: 한 번에 한 포지션씩 시뮬레이션한 결과
- 중복되지 않는 거래를 기준으로 계산된 t-통계량
- 수익이 발생한 달의 비율
- 최대 드로다운
그런 다음 무작위 대조군에 대해 동일한 측정을 수행합니다: 동일한 발동 빈도,
동전 던지기 방식으로 방향을 결정합니다. 무작위 진입 시에는 거래 비용을 정확히 잃어야 하며,
그 이상도 이하도 아니어야 합니다. 이는 두 가지 역할을 합니다. 시뮬레이터가 정확함을 입증해 주며,
또한 노이즈 플로어를 파악할 수 있게 해줍니다. 만약 신호가 해당
행들을 명확히 능가하지 못한다면, 그 신호는 아무런 정보도 담고 있지 않은 것입니다.
중첩의 함정
이 부분이 저를 혼란스럽게 했고, 대부분의 사람들도 이 부분에서 걸려 넘어갑니다.
연속된 신호들은 전방 윈도우의 대부분을 공유합니다. 매 바마다 샘플링되는 60바의 관측 기간은
매 바마다 샘플링하면 59가지 방식으로 겹치는 윈도우가 생성됩니다. 이를
서로 독립적인 것으로 간주하면 t-통계량이 관측 기간의 제곱근 정도만큼 부풀려집니다.
제 신호도 그런 방식으로 계산했을 때 t = 3.32를 보였는데, 이는 설득력 있어 보였습니다. 그러나 진정한
독립적인 표본에서는 t = 1.20으로 나타났는데, 이는 잡음과 구별할 수 없는 수준이었습니다. EdgeMeter는
는 한 번에 하나의 포지션만 시뮬레이션하므로, 보고되는 거래들은 서로 겹치지 않고
t-통계량은 실제 값을 반영합니다.
통과 기준
이 스크립트는 다음 세 가지 기준을 모두 충족해야 하며, 이 세 가지 모두 필수입니다:
[1] 비용 차감 후 거래당 순수익 > 0
[2] |t| > 2
[3] 4개월 중 최소 3개월이 흑자여야 함
수치를 확인하기 전에 기준을 정해 두십시오. 나중에 결정하는 것은
손실을 내는 시스템이 실거래 계좌로 적용되는 지름길입니다.
자신만의 시그널을 테스트하는 방법
파일을 열고 USER SECTION에 있는 두 가지 함수를 수정하세요. 그 외에는
변경할 필요는 없습니다.
bool UserInit() - 지표 핸들을 생성하고
버퍼를 로드합니다.
int UserSignal(int i) - 마감된 바 i를 평가합니다
매수 시 +1, 매도 시 -1, 관망 시 0을 반환합니다
모든 배열의 인덱스는 0이 가장 오래된 바를 나타냅니다. 이는 일반적인
시계열 인덱싱 방식과 반대이며, 이는 의도된 것입니다. 즉, forward 반환 값은 단순히
인덱스 + 호라이즌으로 계산되므로, 특정 유형의 부호 오류를 완전히 제거할 수 있습니다.
진입은 다음 봉인 Open(i+1)에서 시뮬레이션됩니다. UserSignal 내부에서 절대 i+1번 봉이나 그 이후의 봉을 읽지 마십시오
- 이는 룩어헤드 편향이며, 이로 인해 쓸모없는
신호를 훌륭해 보이게 만들 수 있습니다.
기본 UserSignal은 두 개의 타임프레임을 사용하는 이동평균 크로스오버로,
실습 예제로 유지됩니다. 이를 다른 것으로 대체하십시오.
비용 설정
InpSpread, InpCommission 및 InpSlippage는 포인트가 아닌 PRICE 단위로 표시되며,
이 변수들은 스크립트에서 가장 중요한 입력값입니다. 브로커가 광고하는 수치가 아닌, 본인의
계좌에서 직접 확인하십시오. 브로커가 광고하는 수치가 아닙니다.
실전 또는 데모 거래의 체결 내역이 있다면, 측정된
평균값을 사용하십시오. 만약 없다면, 차트에서 확인되는 일반적인 스프레드에
슬리피지를 0으로 가정하지 말고, 슬리피지 허용치를 더하십시오. 데모 서버는
0에 가까운 슬리피지를 보고하지만, 이는 시세의 특성이 아니라 데모 서버의 특성입니다.
필수 사항
실행 전에 충분한 시세를 불러오세요: 해당 종목의 차트를 열고
시간대를 선택한 뒤 차트를 맨 왼쪽으로 스크롤하십시오. 데이터가
충분하지 않은지 알려줄 것입니다. 신호가 30개 미만이면 어떤 결과도 증거가 아닌 일화일 뿐입니다.
무료로 사용 및 수정할 수 있습니다.
MetaQuotes Ltd에서 영어로 번역함.
원본 코드: https://www.mql5.com/en/code/76316
 Adaptive Volume Profile Node Tracker
설정 가능한 룩백 기간에 걸쳐 변동성에 적응하는 롤링 볼륨 프로파일을 생성하고, 제어점(POC), 밸류 영역 고점/저점, 그리고 통계적으로 유의미한 고점/저점 볼륨 노드(HVN/LVN)를 차트에 직접 표시합니다.
Multi-Symbol Correlation Divergence Meter
현재 차트 종목과 선택한 기준 종목 간의 이동 상관관계를 추적하며, 두 종목의 가격 차이가 통계적으로 확대된 상태에서 상관관계가 이탈하는 시점을 표시합니다.
Dynamic Session Range Sweep Detector with Liquidity Zone Marking
아시아, 런던, 뉴욕 세션의 가격 변동 범위를 추적하고, 각 세션 마감 시 해당 범위를 고정하며, 진정한 유동성 스윕(고점 또는 저점을 뚫고 나갔다가 다시 그 범위 안으로 마감되는 촛대)을 화살표 신호와 음영 처리된 반응 구역으로 표시합니다. 리페인팅이 없으며, 모든 종목과 시간대에서 작동합니다.
Heiken Ashi ATR Blend
Heiken Ashi ATR Blend combines smoothed Heiken Ashi candles, ATR-based volatility filtering, and fast/slow EMA trend confirmation to identify potential trend-change signals.