Rustan Nino Mallari / プロファイル
- 情報
|
no
経験
|
1
製品
|
1
デモバージョン
|
|
0
ジョブ
|
2
シグナル
|
0
購読者
|
Rustan Nino Mallari
パブリッシュされたプロダクト
ICT Turtle Soup Advanced MT5 is a visual trading indicator designed around ICT-style liquidity concepts and the Turtle Soup reversal model. The indicator monitors the chart for a structured sequence of events: Liquidity → Purge/Sweep → Market Structure Shift → FVG → Retest → Entry Context → Standard Deviation Targets It is designed as a chart-analysis tool , not an automated trading EA. The goal is to help traders visually identify liquidity events, displacement, structure shifts, imbalances
Rustan Nino Mallari
From EA Buyer to EA Developer — Building a REAL ICT Algorithmic EA
For years, I was on the other side.
I was the buyer.
I bought EAs, tested EAs, watched systems perform, fail, recover, overfit, hide behind blocked dates, martingale, grids, random entries, and beautiful backtests that sometimes had very little connection to how the strategy actually traded.
Now I’m entering a completely different chapter.
I decided to build my own.
Not another random Gold EA.
Not another “AI trading robot” with a fancy name.
Not another system designed only to make a Strategy Tester graph look good.
We are attempting to build a REAL ICT-based EA around a very specific recurring market algorithm — a model built around liquidity, displacement, market structure, FVG/PFVG behavior, session timing, and the recurring price-delivery behavior surrounding the market open.
And we are using the full capability of an expensive, high-compute Astra development workflow to do it.
This project has already gone through 4,000+ automated research/development iterations.
Yes — thousands.
Compile.
Backtest.
Inspect trades.
Analyze failed setups.
Analyze missed setups.
Generate candidates.
Reject weak ideas.
Promote better logic.
Retest.
Repeat.
Again.
Again.
Again.
The objective is not to ask:
“How can we make the backtest prettier?”
The objective is:
“Can we teach the EA to recognize the actual ICT sequence we are trying to trade?”
Liquidity is taken.
Price shows intent.
Displacement appears.
Structure changes.
An imbalance forms.
Price retraces into a meaningful location.
The EA must understand when these events are connected and when they are just random candles that happen to look similar.
That difference is where most mechanical ICT systems fail.
Current Progress
The latest development run is finally becoming interesting.
Current 2026 test:
History Quality: 100%
Initial Deposit: $10,000
Net Profit: +$6,975.06
Ending Balance: approximately $16,975
Profit Factor: 2.83
Recovery Factor: 6.23
Equity Drawdown: approximately 7.65%
Total Trades: 54
Winning Trades: 48.15%
Average Winning Trade: $414.48
Average Losing Trade: -$135.77
What interests me most is NOT the win rate.
The system currently wins less than half of its trades.
But the average winner is roughly 3× the average loser.
That is much closer to the type of asymmetric behavior I want to see than an EA advertising a 95–99% win rate while carrying enormous hidden tail risk.
And the equity curve is beginning to show something important:
progress without requiring a martingale-style recovery structure.
We still have losing periods.
We still have drawdowns.
We still have failed interpretations.
That is exactly why development is continuing.
We Are NOT Finished
PF 2.83 is progress.
It is not the destination.
The research engine is still running.
Thousands of iterations have already been consumed, and significant compute/API resources have been spent because I don't want to stop development simply because the EA became “profitable.”
The target is much more ambitious.
I want the system to become increasingly selective until it recognizes the highest-quality version of this recurring ICT model while rejecting the noise around it.
The long-term research target is to push toward:
PF 10+ territory if the underlying market behavior genuinely supports it
—not by manipulating the test, removing losing dates, or curve-fitting one magical parameter combination.
If the data cannot support that goal robustly, the research should tell us that too.
What Makes This Project Different
The intention is to avoid the usual tricks:
No martingale.
No recovery grid.
No blocked losing dates just to improve the report.
No random scheduled entries pretending to be ICT.
No manually cherry-picked trades.
No manipulated history quality.
The EA is supposed to earn its performance by understanding increasingly specific pieces of the model.
The development process is also being built toward continuous automation:
Code → Compile → Backtest → Analyze → Research → Modify → Retest
Eventually I want the development loop capable of running for hours without me sitting in front of MetaEditor manually babysitting every iteration.
The Bigger Goal
Imagine eventually having an EA that doesn't simply ask:
“Did an FVG appear?”
but instead understands:
Where is liquidity?
Which liquidity was just raided?
Was the raid meaningful?
Did real displacement follow?
Was there an MSS?
Where is price relative to PD arrays?
What is the active session/macro?
What is the probable draw on liquidity?
Is this the first valid presentation of the setup?
Is the retracement still valid?
Has the original thesis already been invalidated?
That is the level we are trying to reach.
Not a candle-pattern EA.
A price-delivery model.
And that is why this project may require thousands more iterations before I consider it finished.
The expensive part isn't buying an EA anymore.
The expensive part is now researching one.
But if this works the way I believe it potentially can, the end result won't simply be another robot I purchased from somebody else.
It will be something we built from the ground up, learned from thousands of failed and successful experiments, and eventually validated across multiple years of real market conditions.
Buyer → Tester → Researcher → Developer.
This is probably the most ambitious trading project I've ever worked on.
And we're only getting started.
Current checkpoint: PF 2.83 / DD 7.65% / +69.75% on the tested 2026 period.
Next objective:
Make the algorithm smarter — not merely the backtest better.
Backtest results are development results, not a promise or guarantee of future live performance.
For years, I was on the other side.
I was the buyer.
I bought EAs, tested EAs, watched systems perform, fail, recover, overfit, hide behind blocked dates, martingale, grids, random entries, and beautiful backtests that sometimes had very little connection to how the strategy actually traded.
Now I’m entering a completely different chapter.
I decided to build my own.
Not another random Gold EA.
Not another “AI trading robot” with a fancy name.
Not another system designed only to make a Strategy Tester graph look good.
We are attempting to build a REAL ICT-based EA around a very specific recurring market algorithm — a model built around liquidity, displacement, market structure, FVG/PFVG behavior, session timing, and the recurring price-delivery behavior surrounding the market open.
And we are using the full capability of an expensive, high-compute Astra development workflow to do it.
This project has already gone through 4,000+ automated research/development iterations.
Yes — thousands.
Compile.
Backtest.
Inspect trades.
Analyze failed setups.
Analyze missed setups.
Generate candidates.
Reject weak ideas.
Promote better logic.
Retest.
Repeat.
Again.
Again.
Again.
The objective is not to ask:
“How can we make the backtest prettier?”
The objective is:
“Can we teach the EA to recognize the actual ICT sequence we are trying to trade?”
Liquidity is taken.
Price shows intent.
Displacement appears.
Structure changes.
An imbalance forms.
Price retraces into a meaningful location.
The EA must understand when these events are connected and when they are just random candles that happen to look similar.
That difference is where most mechanical ICT systems fail.
Current Progress
The latest development run is finally becoming interesting.
Current 2026 test:
History Quality: 100%
Initial Deposit: $10,000
Net Profit: +$6,975.06
Ending Balance: approximately $16,975
Profit Factor: 2.83
Recovery Factor: 6.23
Equity Drawdown: approximately 7.65%
Total Trades: 54
Winning Trades: 48.15%
Average Winning Trade: $414.48
Average Losing Trade: -$135.77
What interests me most is NOT the win rate.
The system currently wins less than half of its trades.
But the average winner is roughly 3× the average loser.
That is much closer to the type of asymmetric behavior I want to see than an EA advertising a 95–99% win rate while carrying enormous hidden tail risk.
And the equity curve is beginning to show something important:
progress without requiring a martingale-style recovery structure.
We still have losing periods.
We still have drawdowns.
We still have failed interpretations.
That is exactly why development is continuing.
We Are NOT Finished
PF 2.83 is progress.
It is not the destination.
The research engine is still running.
Thousands of iterations have already been consumed, and significant compute/API resources have been spent because I don't want to stop development simply because the EA became “profitable.”
The target is much more ambitious.
I want the system to become increasingly selective until it recognizes the highest-quality version of this recurring ICT model while rejecting the noise around it.
The long-term research target is to push toward:
PF 10+ territory if the underlying market behavior genuinely supports it
—not by manipulating the test, removing losing dates, or curve-fitting one magical parameter combination.
If the data cannot support that goal robustly, the research should tell us that too.
What Makes This Project Different
The intention is to avoid the usual tricks:
No martingale.
No recovery grid.
No blocked losing dates just to improve the report.
No random scheduled entries pretending to be ICT.
No manually cherry-picked trades.
No manipulated history quality.
The EA is supposed to earn its performance by understanding increasingly specific pieces of the model.
The development process is also being built toward continuous automation:
Code → Compile → Backtest → Analyze → Research → Modify → Retest
Eventually I want the development loop capable of running for hours without me sitting in front of MetaEditor manually babysitting every iteration.
The Bigger Goal
Imagine eventually having an EA that doesn't simply ask:
“Did an FVG appear?”
but instead understands:
Where is liquidity?
Which liquidity was just raided?
Was the raid meaningful?
Did real displacement follow?
Was there an MSS?
Where is price relative to PD arrays?
What is the active session/macro?
What is the probable draw on liquidity?
Is this the first valid presentation of the setup?
Is the retracement still valid?
Has the original thesis already been invalidated?
That is the level we are trying to reach.
Not a candle-pattern EA.
A price-delivery model.
And that is why this project may require thousands more iterations before I consider it finished.
The expensive part isn't buying an EA anymore.
The expensive part is now researching one.
But if this works the way I believe it potentially can, the end result won't simply be another robot I purchased from somebody else.
It will be something we built from the ground up, learned from thousands of failed and successful experiments, and eventually validated across multiple years of real market conditions.
Buyer → Tester → Researcher → Developer.
This is probably the most ambitious trading project I've ever worked on.
And we're only getting started.
Current checkpoint: PF 2.83 / DD 7.65% / +69.75% on the tested 2026 period.
Next objective:
Make the algorithm smarter — not merely the backtest better.
Backtest results are development results, not a promise or guarantee of future live performance.
Rustan Nino Mallari
2026.09.28
One more thing — I’ll eventually be looking for a small group of serious testers once the EA reaches the stage where I’m comfortable releasing it outside my own environment.
I’m not looking for people who will just install it and disappear.
I want testers who are willing to:
- run it on different brokers and trading conditions
- compare spreads, execution, slippage and symbol specifications
- forward-test it continuously
- report missed trades, strange entries and execution differences
- send logs and screenshots when something does not behave as expected
- help verify that the strategy survives outside the environment where it was developed
The goal is to find out whether the same ICT logic remains consistent across different brokers, data feeds and live market conditions.
I will probably keep the first testing group very small — maybe 10–15 people.
Ideally, I want people who already understand MT5, EAs and proper testing.
No promises of easy money and no guarantees.
You would basically be joining the final stage of turning a research project into something that can actually survive in the real world.
If the final version reaches the standard I’m targeting, the early testers will be the first people outside my own testing environment to run it. If you’re interested, leave a comment or follow the project. I’ll post again when the EA is actually ready for external testing.
I’m not looking for people who will just install it and disappear.
I want testers who are willing to:
- run it on different brokers and trading conditions
- compare spreads, execution, slippage and symbol specifications
- forward-test it continuously
- report missed trades, strange entries and execution differences
- send logs and screenshots when something does not behave as expected
- help verify that the strategy survives outside the environment where it was developed
The goal is to find out whether the same ICT logic remains consistent across different brokers, data feeds and live market conditions.
I will probably keep the first testing group very small — maybe 10–15 people.
Ideally, I want people who already understand MT5, EAs and proper testing.
No promises of easy money and no guarantees.
You would basically be joining the final stage of turning a research project into something that can actually survive in the real world.
If the final version reaches the standard I’m targeting, the early testers will be the first people outside my own testing environment to run it. If you’re interested, leave a comment or follow the project. I’ll post again when the EA is actually ready for external testing.
Rustan Nino Mallari
2026.09.28
The part I’m most excited about isn’t the current PF 2.83.
It’s seeing the EA gradually become more selective.
Earlier versions were basically asking:
“Is there an FVG?”
Now the research is moving toward:
“Why did this FVG form, what liquidity event caused it, what session are we in, where is the draw on liquidity, and is this actually the setup we’re looking for?”
That evolution is what I’m really watching.
The end goal isn’t more trades.
It’s fewer stupid trades. started with 0.80 PF now at 2.83 PF :)
It’s seeing the EA gradually become more selective.
Earlier versions were basically asking:
“Is there an FVG?”
Now the research is moving toward:
“Why did this FVG form, what liquidity event caused it, what session are we in, where is the draw on liquidity, and is this actually the setup we’re looking for?”
That evolution is what I’m really watching.
The end goal isn’t more trades.
It’s fewer stupid trades. started with 0.80 PF now at 2.83 PF :)
Rustan Nino Mallari
Just sharing something interesting I found while looking for a possible alternative to Quantum Queen.
I used QQ before, and after seeing its deep recovery baskets and large floating drawdowns, I became more careful with grid EAs. I still like the consistent trading activity that grid systems can provide, but I don’t want another strategy that can suddenly put the whole account at risk.
Recently, I started analyzing **Gold Fusion**.
What caught my attention is that the author is familiar with Quantum Queen and the failures experienced by other grid EAs. He said he studied where these systems usually fail before creating Fusion, with the goal of building a more diversified and better-controlled grid portfolio.
Fusion has **15 BUY and SELL strategies**, with same-direction overlap protection and built-in protection around high-impact news.
Here is what I found from my independent fixed 0.01 backtest analysis:
**Gold Fusion — 2023 to 2026**
• 3,674 trades
• $5,387.72 net profit from $1,000
• 15.08% maximum equity drawdown
• Completed the entire backtest period
For comparison:
**Quantum Queen original test**
• Account failed
• 112.90% maximum equity drawdown
**Quantum Queen restarted test**
• $2,617.36 net profit
• 44.83% maximum equity drawdown
During the directly comparable period, Fusion produced approximately **60.7% more trades** and considerably more profit than QQ.
I also found that some Fusion strategies have entry behavior closely resembling several QQ engines. The difference is that Fusion combines them with additional BUY and SELL strategies and tighter portfolio controls.
To be clear, Fusion is still a recovery/grid EA. It is not risk-free, and I am not saying that historical performance guarantees future safety. Its largest historical basket reached 16 entries, so proper lot sizing and drawdown protection are still important.
However, compared with my QQ results, Fusion’s historical basket behavior was much cleaner and its drawdown was substantially lower.
I also asked the author about the default 60% DD setting. He openly explained that it was used to pass the MQL5 marketplace validation—not because Fusion historically required 60% drawdown to recover. The DD protection can be lowered according to the user’s risk tolerance, and when triggered, it closes all open positions created by Fusion.
I shared my analysis with the author and asked if he could temporarily lower the price so more former QQ users could test it and provide independent feedback.
He agreed to make it **$149 for 24 hours only**.
I’m sharing this because I would like to see more results from different users, brokers and trading conditions. I’m especially interested in comparisons involving:
• Floating drawdown
• Maximum basket depth
• Broker sensitivity
• News protection
• Live versus backtest performance
If you decide to try it, I still suggest starting on demo or with controlled capital. Monitor the floating equity—not only the closed-profit graph.
The **$149 price is available for 24 hours**, but please test it because the system genuinely interests you—not simply because of the temporary price.
If anyone here has experience with Quantum Queen or other grid EAs, I would be interested to hear your opinion and eventually compare results.
I used QQ before, and after seeing its deep recovery baskets and large floating drawdowns, I became more careful with grid EAs. I still like the consistent trading activity that grid systems can provide, but I don’t want another strategy that can suddenly put the whole account at risk.
Recently, I started analyzing **Gold Fusion**.
What caught my attention is that the author is familiar with Quantum Queen and the failures experienced by other grid EAs. He said he studied where these systems usually fail before creating Fusion, with the goal of building a more diversified and better-controlled grid portfolio.
Fusion has **15 BUY and SELL strategies**, with same-direction overlap protection and built-in protection around high-impact news.
Here is what I found from my independent fixed 0.01 backtest analysis:
**Gold Fusion — 2023 to 2026**
• 3,674 trades
• $5,387.72 net profit from $1,000
• 15.08% maximum equity drawdown
• Completed the entire backtest period
For comparison:
**Quantum Queen original test**
• Account failed
• 112.90% maximum equity drawdown
**Quantum Queen restarted test**
• $2,617.36 net profit
• 44.83% maximum equity drawdown
During the directly comparable period, Fusion produced approximately **60.7% more trades** and considerably more profit than QQ.
I also found that some Fusion strategies have entry behavior closely resembling several QQ engines. The difference is that Fusion combines them with additional BUY and SELL strategies and tighter portfolio controls.
To be clear, Fusion is still a recovery/grid EA. It is not risk-free, and I am not saying that historical performance guarantees future safety. Its largest historical basket reached 16 entries, so proper lot sizing and drawdown protection are still important.
However, compared with my QQ results, Fusion’s historical basket behavior was much cleaner and its drawdown was substantially lower.
I also asked the author about the default 60% DD setting. He openly explained that it was used to pass the MQL5 marketplace validation—not because Fusion historically required 60% drawdown to recover. The DD protection can be lowered according to the user’s risk tolerance, and when triggered, it closes all open positions created by Fusion.
I shared my analysis with the author and asked if he could temporarily lower the price so more former QQ users could test it and provide independent feedback.
He agreed to make it **$149 for 24 hours only**.
I’m sharing this because I would like to see more results from different users, brokers and trading conditions. I’m especially interested in comparisons involving:
• Floating drawdown
• Maximum basket depth
• Broker sensitivity
• News protection
• Live versus backtest performance
If you decide to try it, I still suggest starting on demo or with controlled capital. Monitor the floating equity—not only the closed-profit graph.
The **$149 price is available for 24 hours**, but please test it because the system genuinely interests you—not simply because of the temporary price.
If anyone here has experience with Quantum Queen or other grid EAs, I would be interested to hear your opinion and eventually compare results.
mann0099
2026.09.11
Hey Have a very bad experience with QQ. Lost about 60k$ with QQ and After getting in touch with the author ayush i spoke to him, tested the EA myself and the backtest seems very promising and safe so have put in on a 10k$ Demo account. If it passes the monitoring phase then will be creating a fresh 50k$ account with Fusion
Rustan Nino Mallari
2026.09.12
same i loss around 10k usd! you nmight want to try vantage Vantage - Register Online: https://vigco.co/la-com-inv/RfsLc2Zl
Rustan Nino Mallari
🚨 If you’re running XAUUSD breakout/scalping EAs, your broker might be costing you more than the EA itself.
After spending a lot of time testing Gold breakout systems, one thing has become extremely obvious:
The exact same EA can perform completely differently depending on the broker.
And I’m not just talking about the advertised spread.
I’m talking about:
Real execution speed.
Actual slippage per trade.
Spread expansion during entries.
Stop-order execution.
Gold liquidity during volatility.
How closely live trades reproduce the backtest behavior.
This matters massively with fast systems like Gold Space / TGS, ThunderGold, SGH and other XAUUSD breakout EAs.
A strategy can look incredible in a backtest and then slowly get destroyed live because the broker is adding a few extra points of slippage to almost every entry and exit.
I’ve been testing different setups specifically for this.
And surprisingly, the broker giving me some of the best real-world execution is NOT one of the names that constantly appears in those “Top 5 Fastest Brokers” or “Best Razor Spread Brokers” articles.
That was actually one of the biggest surprises.
Some brokers look incredible on paper:
“0.0 pip spreads”
“ultra-fast execution”
“institutional liquidity”
“raw pricing”
Then you actually run a fast Gold EA through them and the execution tells a completely different story.
The broker I’m currently using has been giving me:
⚡ Sub-50ms execution on my setup
📉 Very thin XAUUSD spreads
🎯 Much more reasonable slippage per trade
🔄 Better consistency between expected and actual entries
🤖 Much better conditions for fast breakout EAs
And that last part is what I care about most.
I don’t care where a broker ranks on some affiliate “Top 10 Broker” website.
I care about what happens when a pending order gets triggered on Gold during a fast move.
What price did I ask for?
What price did I actually get?
How long did execution take?
How much spread was added?
That is the real test.
I’m not posting the broker publicly because execution also depends heavily on your location, VPS and trading setup, and I’d rather recommend the appropriate setup individually than just throw out a link.
If you’re currently running SGH, ThunderGold, Gold Space / TGS, Gold House or another fast XAUUSD EA and you’re seeing worse live results than expected:
Message me.
Tell me what EA you’re running and roughly where your VPS/server is located.
I can recommend the broker/setup I’m currently using for low-latency execution, thin Gold spreads and more reasonable slippage.
For these EAs, changing the broker can sometimes matter just as much as changing the strategy itself.
Backtests show you the strategy.
Execution determines how much of that strategy you actually get to keep.
After spending a lot of time testing Gold breakout systems, one thing has become extremely obvious:
The exact same EA can perform completely differently depending on the broker.
And I’m not just talking about the advertised spread.
I’m talking about:
Real execution speed.
Actual slippage per trade.
Spread expansion during entries.
Stop-order execution.
Gold liquidity during volatility.
How closely live trades reproduce the backtest behavior.
This matters massively with fast systems like Gold Space / TGS, ThunderGold, SGH and other XAUUSD breakout EAs.
A strategy can look incredible in a backtest and then slowly get destroyed live because the broker is adding a few extra points of slippage to almost every entry and exit.
I’ve been testing different setups specifically for this.
And surprisingly, the broker giving me some of the best real-world execution is NOT one of the names that constantly appears in those “Top 5 Fastest Brokers” or “Best Razor Spread Brokers” articles.
That was actually one of the biggest surprises.
Some brokers look incredible on paper:
“0.0 pip spreads”
“ultra-fast execution”
“institutional liquidity”
“raw pricing”
Then you actually run a fast Gold EA through them and the execution tells a completely different story.
The broker I’m currently using has been giving me:
⚡ Sub-50ms execution on my setup
📉 Very thin XAUUSD spreads
🎯 Much more reasonable slippage per trade
🔄 Better consistency between expected and actual entries
🤖 Much better conditions for fast breakout EAs
And that last part is what I care about most.
I don’t care where a broker ranks on some affiliate “Top 10 Broker” website.
I care about what happens when a pending order gets triggered on Gold during a fast move.
What price did I ask for?
What price did I actually get?
How long did execution take?
How much spread was added?
That is the real test.
I’m not posting the broker publicly because execution also depends heavily on your location, VPS and trading setup, and I’d rather recommend the appropriate setup individually than just throw out a link.
If you’re currently running SGH, ThunderGold, Gold Space / TGS, Gold House or another fast XAUUSD EA and you’re seeing worse live results than expected:
Message me.
Tell me what EA you’re running and roughly where your VPS/server is located.
I can recommend the broker/setup I’m currently using for low-latency execution, thin Gold spreads and more reasonable slippage.
For these EAs, changing the broker can sometimes matter just as much as changing the strategy itself.
Backtests show you the strategy.
Execution determines how much of that strategy you actually get to keep.
Rustan Nino Mallari
🚨 For anyone here testing XAUUSD breakout EAs — I think I found one worth looking at.
I’ve spent a lot of time recently testing Gold EAs on MT5, especially the breakout/scalping systems that are popular on MQL5.
I started with Smart Gold Hunter (SGH) because it’s obviously one of the popular names right now. I’m not saying SGH is a bad EA — it has a real SL, no martingale/grid, and plenty of users. But after testing it and looking at live-user feedback, I became concerned about how much the performance can change depending on broker, spread, slippage and execution.
That actually matches what SGH’s own MQL5 page says about broker sensitivity, and there are currently both positive reviews and users reporting that their live results don’t match the main signal/backtest as closely as expected.
So I kept looking.
I tested Gold House and several other Gold EAs, but the first breakout EA that really impressed me was ThunderGold.
ThunderGold was different.
In the author’s recent live history that I analyzed, I counted 34 trades: 26 wins / 8 losses, around 76.5% win rate, with a simple gross PF around 3.86. More importantly, the winners were allowed to become substantially larger than the losses.
There were trades around:
+$1,128
+$1,329
+$1,562
+$2,294
while many of the losses stayed roughly in the -$400 to -$600 range on that account.
That payoff structure caught my attention because I prefer an EA that can accept a controlled loss and then make it back with a meaningful winner instead of relying on recovery/grid logic.
At that point, ThunderGold became one of my favorite breakout EAs.
Then last week I found another one.
Gold Space / TGS.
And this is where things became really interesting.
I put the MT5 reports through a much deeper analysis — trade history, weekly results, drawdown, losing streaks, hold times, SL behavior, pending-order behavior, and execution sensitivity.
For the things I personally care about most — consistency, very low drawdown, controlled losses and avoiding consecutive losing weeks — Gold Space actually came out ahead of ThunderGold in my overall scoring.
In the historical period I analyzed, Gold Space was around 92% positive weeks, and its longest sequence of negative weeks was only ONE week.
No martingale.
No averaging recovery.
Hard SL.
Breakout logic.
Very aggressive trade management.
What impressed me most is how ridiculously smooth the historical equity curve is.
Now, there is an important warning: Gold Space is extremely fast, so I also found that its live performance can decline compared with the perfect backtest because spread, slippage and broker tick differences matter a lot. I’ve actually compared live trades against the expected behavior and seen that degradation myself.
So I’m definitely not saying “buy this and it prints money.”
I’m saying:
SGH made me interested in breakout EAs.
ThunderGold made me realize how good a properly designed breakout EA can be.
Gold Space made me realize there may be another level above that.
And now I’m testing an even newer breakout system alongside them, so I’m going very deep into this category.
If you already use SGH, ThunderGold, Gold House or other XAUUSD breakout EAs, I’d genuinely be interested in comparing your live results because broker execution seems to be one of the biggest differences between these systems.
Gold Space / TGS:
https://www.mql5.com/en/market/product/179831?source=Site+Profile
Don’t just look at the profit screenshot. Backtest it, study the DD, check the losing weeks, and compare it with your current breakout EA.
I wasn’t expecting to find something that would challenge ThunderGold in my ranking.
This one did.
I’ve spent a lot of time recently testing Gold EAs on MT5, especially the breakout/scalping systems that are popular on MQL5.
I started with Smart Gold Hunter (SGH) because it’s obviously one of the popular names right now. I’m not saying SGH is a bad EA — it has a real SL, no martingale/grid, and plenty of users. But after testing it and looking at live-user feedback, I became concerned about how much the performance can change depending on broker, spread, slippage and execution.
That actually matches what SGH’s own MQL5 page says about broker sensitivity, and there are currently both positive reviews and users reporting that their live results don’t match the main signal/backtest as closely as expected.
So I kept looking.
I tested Gold House and several other Gold EAs, but the first breakout EA that really impressed me was ThunderGold.
ThunderGold was different.
In the author’s recent live history that I analyzed, I counted 34 trades: 26 wins / 8 losses, around 76.5% win rate, with a simple gross PF around 3.86. More importantly, the winners were allowed to become substantially larger than the losses.
There were trades around:
+$1,128
+$1,329
+$1,562
+$2,294
while many of the losses stayed roughly in the -$400 to -$600 range on that account.
That payoff structure caught my attention because I prefer an EA that can accept a controlled loss and then make it back with a meaningful winner instead of relying on recovery/grid logic.
At that point, ThunderGold became one of my favorite breakout EAs.
Then last week I found another one.
Gold Space / TGS.
And this is where things became really interesting.
I put the MT5 reports through a much deeper analysis — trade history, weekly results, drawdown, losing streaks, hold times, SL behavior, pending-order behavior, and execution sensitivity.
For the things I personally care about most — consistency, very low drawdown, controlled losses and avoiding consecutive losing weeks — Gold Space actually came out ahead of ThunderGold in my overall scoring.
In the historical period I analyzed, Gold Space was around 92% positive weeks, and its longest sequence of negative weeks was only ONE week.
No martingale.
No averaging recovery.
Hard SL.
Breakout logic.
Very aggressive trade management.
What impressed me most is how ridiculously smooth the historical equity curve is.
Now, there is an important warning: Gold Space is extremely fast, so I also found that its live performance can decline compared with the perfect backtest because spread, slippage and broker tick differences matter a lot. I’ve actually compared live trades against the expected behavior and seen that degradation myself.
So I’m definitely not saying “buy this and it prints money.”
I’m saying:
SGH made me interested in breakout EAs.
ThunderGold made me realize how good a properly designed breakout EA can be.
Gold Space made me realize there may be another level above that.
And now I’m testing an even newer breakout system alongside them, so I’m going very deep into this category.
If you already use SGH, ThunderGold, Gold House or other XAUUSD breakout EAs, I’d genuinely be interested in comparing your live results because broker execution seems to be one of the biggest differences between these systems.
Gold Space / TGS:
https://www.mql5.com/en/market/product/179831?source=Site+Profile
Don’t just look at the profit screenshot. Backtest it, study the DD, check the losing weeks, and compare it with your current breakout EA.
I wasn’t expecting to find something that would challenge ThunderGold in my ranking.
This one did.
Rustan Nino Mallari
2026.08.30
I came from QQ, and after the July event I finally started looking seriously for better alternatives. I honestly thought QQ was the holy grail before that. Credit to the people in this group who shared real experiences and weren’t afraid to question the hype—it pushed me to do my own testing instead of just following anyone. After weeks of backtesting, analyzing trades and watching live results, my top picks so far are: 1. The Gold Space
2. ThunderGold
3. MoonDog
4. Iron Stop — still needs more live validation The biggest lesson for me is the difference between these breakout EAs and recovery/basket systems like QQ. Controlled losses are much easier for me to accept than waiting for a huge basket to recover. And just imagine: SGH and ThunderGold can sit near the top of the MQL5 rankings with tons of buyers, while a cheaper EA much lower down the list could quietly be producing Sometimes the best EA isn’t the most popular one. Test everything yourself, compare the live results, and don’t let rankings or hype make the decision for you.
2. ThunderGold
3. MoonDog
4. Iron Stop — still needs more live validation The biggest lesson for me is the difference between these breakout EAs and recovery/basket systems like QQ. Controlled losses are much easier for me to accept than waiting for a huge basket to recover. And just imagine: SGH and ThunderGold can sit near the top of the MQL5 rankings with tons of buyers, while a cheaper EA much lower down the list could quietly be producing Sometimes the best EA isn’t the most popular one. Test everything yourself, compare the live results, and don’t let rankings or hype make the decision for you.
Rustan Nino Mallari
🔥 150-DAY PERFORMANCE UPDATE — QUANTUM QUEEN (LIVE) | JAN 29 START | CXM → VANTAGE CONTINUATION 🔥
Day 150 since January 29 activation
It has now been 150 days since I started running Quantum Queen live, and at this point the story is very clear:
This is no longer an “early result.”
This is no longer a “good week.”
This is now a multi-month live track record across broker phases, changing market conditions, withdrawals, and continued execution.
And the system is still standing strong.
✅ 150-Day Timeline
To keep everything transparent:
Phase 1: CXM from Jan 29 → Apr 15
Phase 2: Vantage continued after CXM stopped, and is now the main active account
So yes — this 150-day milestone started on January 29, but after April 15 the journey continued through Vantage only.
📊 ACTIVE ACCOUNT SNAPSHOT — VANTAGE (Main Low Risk)
Latest Vantage Statistics
✅ Gain: +145.06%
✅ Abs Gain: +60.29%
✅ Profit: +$6,028.61
✅ Drawdown: 6.39%
✅ Balance: $13,514.83
✅ Highest Balance Recorded: $14,463.25
✅ Deposits: $10,000.00
✅ Withdrawals: $2,513.78
At this point, this is not just “growth.”
This is growth with controlled drawdown, even while withdrawals have already been taken out.
📈 PERFORMANCE METRICS
Trading Statistics
✅ Total Trades: 297
✅ Profit Factor: 6.91
✅ Pips Captured: 57,164.0
✅ Win Rate: 88%
✅ Long Trades Won: 89% (228/254)
✅ Short Trades Won: 83% (36/43)
Trade Quality
✅ Average Win: 258.44 pips / $26.70
✅ Average Loss: -335.30 pips / -$30.91
✅ Best Trade: +$264.59
✅ Worst Trade: -$219.66
✅ Best Trade (Pips): 2,948.0
✅ Worst Trade (Pips): -3,658.0
✅ Expectancy: 192.5 pips / $20.30
✅ Average Trade Length: 9 minutes
That is the part I pay attention to most:
This is not a bot randomly spraying entries.
This is a system showing structure, efficiency, and repeatability.
📅 MONTHLY MOMENTUM
From the live Vantage continuation:
March: +25.72%
April: +14.42%
May: +36.26%
Current Monthly Snapshot: +30.11%
That means the system has not just been “surviving.”
It has been stacking month after month.
🚀 WHAT STANDS OUT MOST AFTER 150 DAYS
What makes this update impressive to me is not just the percentage.
It’s the combination of:
strong gains
controlled drawdown
high profit factor
consistent win profile
real withdrawals already taken
continued performance after broker transition
That combination is what separates a flashy EA from one that actually has a serious chance of lasting.
🔥 WHAT 150 DAYS PROVES
After 150 days, my conclusion is simple:
✅ Quantum Queen is not overtrading chaos
✅ It can continue performing beyond the “honeymoon phase”
✅ It adapts through changing conditions
✅ It can produce aggressive growth while keeping drawdown relatively clean
✅ It remains one of the strongest live-performing EAs I’ve personally tracked so far
Most systems look good for 2 weeks.
Some survive 1 month.
Very few still look this strong at Day 150.
That’s why this update matters.
💬 MY HONEST TAKE
When I first started watching Quantum Queen months ago, I was skeptical — like most people are with anything on MQL5.
Now, 150 days later, I’m no longer speaking from curiosity.
I’m speaking from live experience, real tracking, and real withdrawals.
And honestly?
This has turned into one of the most convincing long-run EA performances I’ve seen in my own account.
✅ FINAL WORD
150 days in.
Still profitable.
Still controlled.
Still compounding.
Quantum Queen has now moved far beyond “promising.”
It has become proven — at least in my live journey so far.
Next checkpoint: 180 Days.
— Rustan Mallari 🇵🇭
150 Days Live. Real Tracking. Real Results. 📊🔥
Day 150 since January 29 activation
It has now been 150 days since I started running Quantum Queen live, and at this point the story is very clear:
This is no longer an “early result.”
This is no longer a “good week.”
This is now a multi-month live track record across broker phases, changing market conditions, withdrawals, and continued execution.
And the system is still standing strong.
✅ 150-Day Timeline
To keep everything transparent:
Phase 1: CXM from Jan 29 → Apr 15
Phase 2: Vantage continued after CXM stopped, and is now the main active account
So yes — this 150-day milestone started on January 29, but after April 15 the journey continued through Vantage only.
📊 ACTIVE ACCOUNT SNAPSHOT — VANTAGE (Main Low Risk)
Latest Vantage Statistics
✅ Gain: +145.06%
✅ Abs Gain: +60.29%
✅ Profit: +$6,028.61
✅ Drawdown: 6.39%
✅ Balance: $13,514.83
✅ Highest Balance Recorded: $14,463.25
✅ Deposits: $10,000.00
✅ Withdrawals: $2,513.78
At this point, this is not just “growth.”
This is growth with controlled drawdown, even while withdrawals have already been taken out.
📈 PERFORMANCE METRICS
Trading Statistics
✅ Total Trades: 297
✅ Profit Factor: 6.91
✅ Pips Captured: 57,164.0
✅ Win Rate: 88%
✅ Long Trades Won: 89% (228/254)
✅ Short Trades Won: 83% (36/43)
Trade Quality
✅ Average Win: 258.44 pips / $26.70
✅ Average Loss: -335.30 pips / -$30.91
✅ Best Trade: +$264.59
✅ Worst Trade: -$219.66
✅ Best Trade (Pips): 2,948.0
✅ Worst Trade (Pips): -3,658.0
✅ Expectancy: 192.5 pips / $20.30
✅ Average Trade Length: 9 minutes
That is the part I pay attention to most:
This is not a bot randomly spraying entries.
This is a system showing structure, efficiency, and repeatability.
📅 MONTHLY MOMENTUM
From the live Vantage continuation:
March: +25.72%
April: +14.42%
May: +36.26%
Current Monthly Snapshot: +30.11%
That means the system has not just been “surviving.”
It has been stacking month after month.
🚀 WHAT STANDS OUT MOST AFTER 150 DAYS
What makes this update impressive to me is not just the percentage.
It’s the combination of:
strong gains
controlled drawdown
high profit factor
consistent win profile
real withdrawals already taken
continued performance after broker transition
That combination is what separates a flashy EA from one that actually has a serious chance of lasting.
🔥 WHAT 150 DAYS PROVES
After 150 days, my conclusion is simple:
✅ Quantum Queen is not overtrading chaos
✅ It can continue performing beyond the “honeymoon phase”
✅ It adapts through changing conditions
✅ It can produce aggressive growth while keeping drawdown relatively clean
✅ It remains one of the strongest live-performing EAs I’ve personally tracked so far
Most systems look good for 2 weeks.
Some survive 1 month.
Very few still look this strong at Day 150.
That’s why this update matters.
💬 MY HONEST TAKE
When I first started watching Quantum Queen months ago, I was skeptical — like most people are with anything on MQL5.
Now, 150 days later, I’m no longer speaking from curiosity.
I’m speaking from live experience, real tracking, and real withdrawals.
And honestly?
This has turned into one of the most convincing long-run EA performances I’ve seen in my own account.
✅ FINAL WORD
150 days in.
Still profitable.
Still controlled.
Still compounding.
Quantum Queen has now moved far beyond “promising.”
It has become proven — at least in my live journey so far.
Next checkpoint: 180 Days.
— Rustan Mallari 🇵🇭
150 Days Live. Real Tracking. Real Results. 📊🔥
Rustan Nino Mallari
パブリッシュされたMetaTrader 5シグナル
Quant Equilibrium — Quantitative Gold Trading Built for Liquidity Precision Quant Equilibrium is not just another overfitted trading system. It is a refined quantitative liquidity-response framework designed specifically for XAUUSD , built to read market structure, volatility shifts, equilibrium zones, and liquidity reactions with precision. Instead of chasing random moves, Quant Equilibrium waits for high-quality alignment: liquidity sweeps, displacement, volatility confirmation
Rustan Nino Mallari
パブリッシュされたMetaTrader 5シグナル
Quant Equilibrium — Quantitative Gold Trading Built for Liquidity Precision Quant Equilibrium is not just another overfitted trading system. It is a refined quantitative liquidity-response framework designed specifically for XAUUSD , built to read market structure, volatility shifts, equilibrium zones, and liquidity reactions with precision. Instead of chasing random moves, Quant Equilibrium waits for high-quality alignment: liquidity sweeps, displacement, volatility confirmation
Rustan Nino Mallari
🔥 120-DAY PERFORMANCE UPDATE — Quantum Queen(LIVE) | JAN 29 START | CXM → VANTAGE CONTINUATION 🔥
Day 120 since January 29 activation (observed/engineered through multiple market cycles)
This is the update I’ve been waiting to publish — because 120 days is long enough to filter out “luck,” “one-week pumps,” and screenshot noise.
This is live tracking, real broker conditions, real execution behavior… and a very clear story:
✅ CXM carried Phase 1 (Jan 29 → Apr 15)
✅ Vantage carried Phase 2 (Mar 20 → present / continued after CXM stopped)
Same system logic. Different environments. The system kept performing.
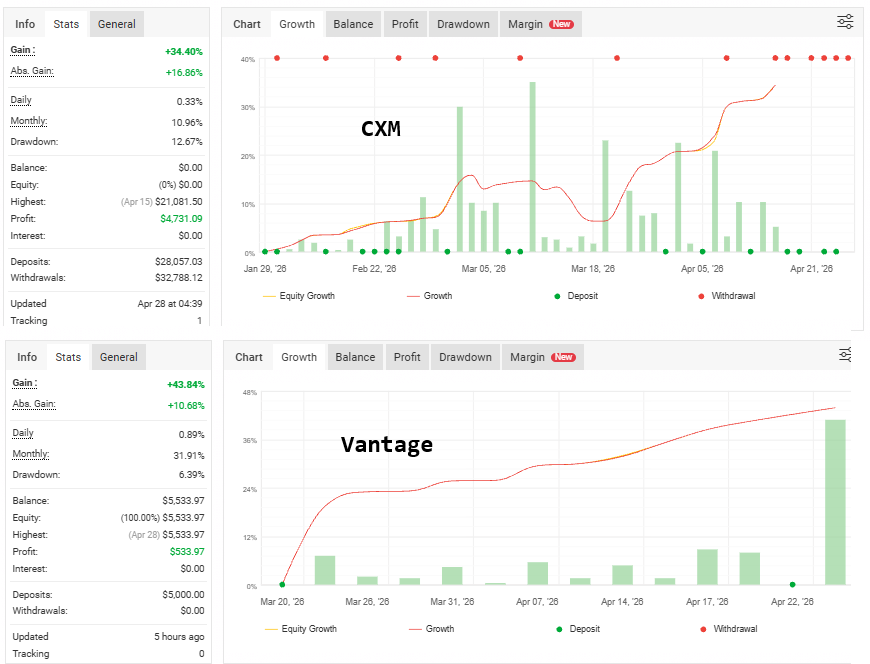
✅ PHASE 1 — CXM (Jan 29 → Apr 15) | Real USD (Closed)
Final CXM Snapshot
Gain: +34.40%
Abs Gain: +16.86%
Profit: +$4,731.09
Drawdown: 12.67%
Trades: 150
Profit Factor: 2.11
Monthly (CXM):
Feb: +7.06%
Mar: +12.72%
Apr (partial to Apr 15): +11.35%
CXM phase proved the engine could survive and grow through real volatility, real spreads, and real exposure.
✅ PHASE 2 — VANTAGE (Mar 20 → Current) | Real USD (Active)
This is where things got serious.
Vantage Snapshot (Main Low Risk)
Gain: +95.99%
Abs Gain: +31.21%
Profit: +$3,120.87
Drawdown: 6.39% (very controlled)
Balance: $11,837.87
Deposits: $10,000
Withdrawals: $1,283.00
Trades: 208
Profit Factor: 5.85 (exceptional for live automation)
Pips: 41,218.0
Avg trade length: ~8 minutes (fast, efficient execution)
Best trade: +$159.36 | Worst trade: -$144.32
Monthly (Vantage):
Mar: +25.72%
Apr: +14.42%
May: +36.26%
This is the kind of profile most “EA marketers” claim to have… but rarely show with drawdown staying this clean.
🧾 120-DAY COMBINED TOTALS (CXM + Vantage Since Jan 29)
If we combine both phases into one performance story:
✅ Total Profit (combined): $4,731.09 + $3,120.87 = $7,851.96
✅ Total Deposits (combined): $28,057.03 + $10,000.00 = $38,057.03
✅ Combined Abs Gain (profit ÷ total deposits): ~20.63%
Weighted Monthly Gains (combined view):
Feb: ~7.06% (CXM only)
Mar: ~16.14% (CXM + Vantage combined)
Apr: ~12.16% (CXM partial + Vantage)
May: +36.26% (Vantage only — post-CXM continuation)
So yes — the system didn’t just “start strong.”
It continued, even after the broker environment changed.
🔥 What 120 Days Actually Proves
After 120 days of live tracking, the pattern is clear:
✅ Execution consistency > random “perfect win streaks”
✅ Low drawdown control + strong PF = real system behavior
✅ It doesn’t need to overtrade to produce output
✅ The equity curve reflects structure, not chaos
✅ Broker changes didn’t kill performance — the engine adapted
This is what a serious automated system looks like:
Not perfect. Not magical. Just repeatable rules with measurable edge.
🚀 Final Thoughts
CXM was a strong Phase 1 environment.
Vantage has turned into an absolute execution showcase for this setup — especially with the current low-risk profile delivering near doubling behavior while keeping drawdown tight.
Next checkpoint: 150 Days.
— Rustan Mallari 🇵🇭
120 Days Live. Two Brokers. One Engine. Real Tracking. 📊🔥
Day 120 since January 29 activation (observed/engineered through multiple market cycles)
This is the update I’ve been waiting to publish — because 120 days is long enough to filter out “luck,” “one-week pumps,” and screenshot noise.
This is live tracking, real broker conditions, real execution behavior… and a very clear story:
✅ CXM carried Phase 1 (Jan 29 → Apr 15)
✅ Vantage carried Phase 2 (Mar 20 → present / continued after CXM stopped)
Same system logic. Different environments. The system kept performing.
✅ PHASE 1 — CXM (Jan 29 → Apr 15) | Real USD (Closed)
Final CXM Snapshot
Gain: +34.40%
Abs Gain: +16.86%
Profit: +$4,731.09
Drawdown: 12.67%
Trades: 150
Profit Factor: 2.11
Monthly (CXM):
Feb: +7.06%
Mar: +12.72%
Apr (partial to Apr 15): +11.35%
CXM phase proved the engine could survive and grow through real volatility, real spreads, and real exposure.
✅ PHASE 2 — VANTAGE (Mar 20 → Current) | Real USD (Active)
This is where things got serious.
Vantage Snapshot (Main Low Risk)
Gain: +95.99%
Abs Gain: +31.21%
Profit: +$3,120.87
Drawdown: 6.39% (very controlled)
Balance: $11,837.87
Deposits: $10,000
Withdrawals: $1,283.00
Trades: 208
Profit Factor: 5.85 (exceptional for live automation)
Pips: 41,218.0
Avg trade length: ~8 minutes (fast, efficient execution)
Best trade: +$159.36 | Worst trade: -$144.32
Monthly (Vantage):
Mar: +25.72%
Apr: +14.42%
May: +36.26%
This is the kind of profile most “EA marketers” claim to have… but rarely show with drawdown staying this clean.
🧾 120-DAY COMBINED TOTALS (CXM + Vantage Since Jan 29)
If we combine both phases into one performance story:
✅ Total Profit (combined): $4,731.09 + $3,120.87 = $7,851.96
✅ Total Deposits (combined): $28,057.03 + $10,000.00 = $38,057.03
✅ Combined Abs Gain (profit ÷ total deposits): ~20.63%
Weighted Monthly Gains (combined view):
Feb: ~7.06% (CXM only)
Mar: ~16.14% (CXM + Vantage combined)
Apr: ~12.16% (CXM partial + Vantage)
May: +36.26% (Vantage only — post-CXM continuation)
So yes — the system didn’t just “start strong.”
It continued, even after the broker environment changed.
🔥 What 120 Days Actually Proves
After 120 days of live tracking, the pattern is clear:
✅ Execution consistency > random “perfect win streaks”
✅ Low drawdown control + strong PF = real system behavior
✅ It doesn’t need to overtrade to produce output
✅ The equity curve reflects structure, not chaos
✅ Broker changes didn’t kill performance — the engine adapted
This is what a serious automated system looks like:
Not perfect. Not magical. Just repeatable rules with measurable edge.
🚀 Final Thoughts
CXM was a strong Phase 1 environment.
Vantage has turned into an absolute execution showcase for this setup — especially with the current low-risk profile delivering near doubling behavior while keeping drawdown tight.
Next checkpoint: 150 Days.
— Rustan Mallari 🇵🇭
120 Days Live. Two Brokers. One Engine. Real Tracking. 📊🔥
Rustan Nino Mallari
🔥 90-DAY PERFORMANCE UPDATE — QUANTUM QUEEN (LIVE TRACKING) | REAL BROKERS, REAL EXECUTION 🔥
Day 90 since Jan 29 activation (observed since October)
It’s officially been 90 days since I switched Quantum Queen into live execution.
And here’s the most important part:
This isn’t a “one account, one screenshot” story.
This is a full 90-day journey across two brokers — because execution quality matters, and I track performance where it actually counts: real fills, real spreads, real behavior under pressure.
✅ 90-Day Timeline (Transparency)
Phase 1: CXM (Jan 29 → Apr 15) — main live run
Phase 2: Vantage (Mar 20 → current update) — additional live run + continuity after CXM ended
So yes: you’re seeing multiple live environments while keeping the same system logic.
📊 PHASE 1 — CXM (Jan 29 → Apr 15) | Real USD
CXM Final Snapshot
✅ Gain: +34.40%
✅ Abs Gain: +16.86%
✅ Profit: +$4,731.09
✅ Drawdown: 12.67%
✅ Trades: 150
✅ Profit Factor: 2.11
✅ Pips: 21,099.8
Monthly performance (CXM):
Feb: +7.06%
Mar: +12.72%
Apr (partial to Apr 15): +11.35%
This account carried the bulk of exposure and proved one thing clearly:
the system can keep compounding while surviving real volatility.
📊 PHASE 2 — Vantage (Mar 20 → latest update) | Real USD
Vantage Live Snapshot
✅ Gain: +43.84%
✅ Abs Gain: +10.68%
✅ Profit: +$533.97
✅ Drawdown: 6.39% (very controlled)
✅ Trades: 83
✅ Profit Factor: 4.17 (strong)
✅ Pips: 24,319.0
Monthly performance (Vantage):
Mar: +25.72%
Apr: +14.42% (so far)
This run is what I call the “clean execution showcase” — strong percentage growth with controlled DD and a PF that’s simply not normal for random automation.
🧾 90-Day Combined Totals (CXM + Vantage)
If we combine both live runs:
✅ Total Profit (combined): $5,265.06
✅ Total Deposits (combined): $33,057.03
✅ Combined Abs. Gain: ~+15.93%
Weighted monthly gains (combined):
Feb: ~7.06%
Mar: ~14.69%
Apr: ~11.81% (so far / partial due to CXM ending Apr 15)
This is the part people miss:
I’m not trying to look “perfect.”
I’m proving repeatability across different environments.
🔥 What 90 Days Proves (in plain terms)
After 90 days of tracking:
✅ It’s not overtrading chaos
✅ It performs across brokers and account styles
✅ It produces measurable output (pips + PF + controlled DD)
✅ It can push growth without needing nonstop manual babysitting
✅ It’s built around execution rules — not “hope”
This is the difference between a bot that looks good… and a bot that survives.
⚠️ Final Note (Because I keep it real)
This is performance tracking — not a guarantee.
Markets change, risk exists, and automation is a tool that must be used responsibly.
But as a 90-day proof-of-work, this has been one of the cleanest system behaviors I’ve tracked so far.
Next checkpoint: 120 Days.
— Rustan Mallari 🇵🇭
90 Days Live. Two Brokers. Real Tracking. 📊🔥
Day 90 since Jan 29 activation (observed since October)
It’s officially been 90 days since I switched Quantum Queen into live execution.
And here’s the most important part:
This isn’t a “one account, one screenshot” story.
This is a full 90-day journey across two brokers — because execution quality matters, and I track performance where it actually counts: real fills, real spreads, real behavior under pressure.
✅ 90-Day Timeline (Transparency)
Phase 1: CXM (Jan 29 → Apr 15) — main live run
Phase 2: Vantage (Mar 20 → current update) — additional live run + continuity after CXM ended
So yes: you’re seeing multiple live environments while keeping the same system logic.
📊 PHASE 1 — CXM (Jan 29 → Apr 15) | Real USD
CXM Final Snapshot
✅ Gain: +34.40%
✅ Abs Gain: +16.86%
✅ Profit: +$4,731.09
✅ Drawdown: 12.67%
✅ Trades: 150
✅ Profit Factor: 2.11
✅ Pips: 21,099.8
Monthly performance (CXM):
Feb: +7.06%
Mar: +12.72%
Apr (partial to Apr 15): +11.35%
This account carried the bulk of exposure and proved one thing clearly:
the system can keep compounding while surviving real volatility.
📊 PHASE 2 — Vantage (Mar 20 → latest update) | Real USD
Vantage Live Snapshot
✅ Gain: +43.84%
✅ Abs Gain: +10.68%
✅ Profit: +$533.97
✅ Drawdown: 6.39% (very controlled)
✅ Trades: 83
✅ Profit Factor: 4.17 (strong)
✅ Pips: 24,319.0
Monthly performance (Vantage):
Mar: +25.72%
Apr: +14.42% (so far)
This run is what I call the “clean execution showcase” — strong percentage growth with controlled DD and a PF that’s simply not normal for random automation.
🧾 90-Day Combined Totals (CXM + Vantage)
If we combine both live runs:
✅ Total Profit (combined): $5,265.06
✅ Total Deposits (combined): $33,057.03
✅ Combined Abs. Gain: ~+15.93%
Weighted monthly gains (combined):
Feb: ~7.06%
Mar: ~14.69%
Apr: ~11.81% (so far / partial due to CXM ending Apr 15)
This is the part people miss:
I’m not trying to look “perfect.”
I’m proving repeatability across different environments.
🔥 What 90 Days Proves (in plain terms)
After 90 days of tracking:
✅ It’s not overtrading chaos
✅ It performs across brokers and account styles
✅ It produces measurable output (pips + PF + controlled DD)
✅ It can push growth without needing nonstop manual babysitting
✅ It’s built around execution rules — not “hope”
This is the difference between a bot that looks good… and a bot that survives.
⚠️ Final Note (Because I keep it real)
This is performance tracking — not a guarantee.
Markets change, risk exists, and automation is a tool that must be used responsibly.
But as a 90-day proof-of-work, this has been one of the cleanest system behaviors I’ve tracked so far.
Next checkpoint: 120 Days.
— Rustan Mallari 🇵🇭
90 Days Live. Two Brokers. Real Tracking. 📊🔥
Rustan Nino Mallari
🔥 60-DAY UPDATE: QUANTUM QUEEN LIVE — REAL ACCOUNTS, REAL TRACKING, REAL HEAT 🔥
Day 60 since January 29 activation (observed since October)
It’s now been 60 days since I switched Quantum Queen from observation mode into live execution — and the results are getting harder to ignore.
This is not “one lucky week.”
This is two full months of tracked performance across multiple account types, different deposit sizes, and different risk environments — all still running Technical / Automated execution on MT5.
✅ 60-Day Performance Snapshot (Tracked Accounts)
🟢 Account 1 — CXM Direct (Real USD | 1:1000 | Automated)
✔ Gain: +20.69%
✔ Profit: +$2,562.02
✔ Drawdown: 12.67%
✔ Trades: 119
✔ Profit Factor: 1.61
✔ Balance: ~$19,180.99 (tracked)
This is the “workhorse” account — the one that’s been absorbing the most market exposure. You can literally see the system survive, adapt, and keep climbing through volatility.
📌 What 60 Days Tells Me (Clear Pattern)
Quantum Queen is showing repeatable traits:
✅ It is not a mindless overtrader
✅ It scales across account types
✅ It can run conservative OR aggressive depending on the environment
✅ It performs best when execution is clean (spread + fills + latency)
✅ It has the kind of curve behavior you look for in serious automation — grind, expand, recover, push
This is the part most people miss:
edge is not “profit.” edge is “profit while staying alive.”
🏆 “Best Setup” After 60 Days?
Depends on what you want:
Most scalable long-term: the larger CXM USD account shows it can handle real exposure.
🚀 For Those Interested (Execution Environment Matters)
If you’re considering running Quantum Queen, I’ll say this clearly:
Broker conditions matter MORE than people admit.
Spread matters. Fill quality matters. Latency matters.
That’s why I recommend CXM for this system.
✅ Fast execution
✅ Stable spread behavior
✅ Clean fills
✅ Works across Zero/ECN/Cent structures
✅ Good liquidity for gold-focused automation
🔗 CXM IB Link (for those who asked)
Use my CXM IB link here:
https://secure.cxm.com/links/go/308814
⚠️ Final Note (Because I keep it real)
This is 60 days of tracking — strong, but not “forever.” Markets change. Conditions change. Risk is real.
Automation is a tool, not a promise.
But after 60 days across multiple account types, I’m not guessing anymore:
Quantum Queen has structure.
Quantum Queen has edge.
Quantum Queen can perform — when the environment is right.
Next milestone: 90 Days.
— Rustan Mallari 🇵🇭
60 Days Live. Real Accounts. Real Tracking. 📊🔥
Day 60 since January 29 activation (observed since October)
It’s now been 60 days since I switched Quantum Queen from observation mode into live execution — and the results are getting harder to ignore.
This is not “one lucky week.”
This is two full months of tracked performance across multiple account types, different deposit sizes, and different risk environments — all still running Technical / Automated execution on MT5.
✅ 60-Day Performance Snapshot (Tracked Accounts)
🟢 Account 1 — CXM Direct (Real USD | 1:1000 | Automated)
✔ Gain: +20.69%
✔ Profit: +$2,562.02
✔ Drawdown: 12.67%
✔ Trades: 119
✔ Profit Factor: 1.61
✔ Balance: ~$19,180.99 (tracked)
This is the “workhorse” account — the one that’s been absorbing the most market exposure. You can literally see the system survive, adapt, and keep climbing through volatility.
📌 What 60 Days Tells Me (Clear Pattern)
Quantum Queen is showing repeatable traits:
✅ It is not a mindless overtrader
✅ It scales across account types
✅ It can run conservative OR aggressive depending on the environment
✅ It performs best when execution is clean (spread + fills + latency)
✅ It has the kind of curve behavior you look for in serious automation — grind, expand, recover, push
This is the part most people miss:
edge is not “profit.” edge is “profit while staying alive.”
🏆 “Best Setup” After 60 Days?
Depends on what you want:
Most scalable long-term: the larger CXM USD account shows it can handle real exposure.
🚀 For Those Interested (Execution Environment Matters)
If you’re considering running Quantum Queen, I’ll say this clearly:
Broker conditions matter MORE than people admit.
Spread matters. Fill quality matters. Latency matters.
That’s why I recommend CXM for this system.
✅ Fast execution
✅ Stable spread behavior
✅ Clean fills
✅ Works across Zero/ECN/Cent structures
✅ Good liquidity for gold-focused automation
🔗 CXM IB Link (for those who asked)
Use my CXM IB link here:
https://secure.cxm.com/links/go/308814
⚠️ Final Note (Because I keep it real)
This is 60 days of tracking — strong, but not “forever.” Markets change. Conditions change. Risk is real.
Automation is a tool, not a promise.
But after 60 days across multiple account types, I’m not guessing anymore:
Quantum Queen has structure.
Quantum Queen has edge.
Quantum Queen can perform — when the environment is right.
Next milestone: 90 Days.
— Rustan Mallari 🇵🇭
60 Days Live. Real Accounts. Real Tracking. 📊🔥
Rustan Nino Mallari
🔥 30-DAY UPDATE: +57.27% | +24.82% | +15.78% | LOW DRAWDOWN 🔥
DAY 30 Since January 29 Launch
It has officially been 30 days since I activated Quantum Queen live after observing it since October.
For transparency, I deployed it across three CXM account types:
• ZERO Spread
• CENT Account
• ECN Account
All running Medium–High default optimized settings.
📊 30-Day Performance Breakdown
🟢 ZERO Spread Account
✔ +57.27% Gain
✔ Monthly: +55.05%
✔ Drawdown: Only 2.58%
✔ Profit Factor: 7.25
✔ 6,936+ Pips Captured
✔ 75% Long win rate | 71% Short win rate
This account showed the strongest percentage growth so far with very controlled drawdown relative to return.
🟢 CENT Account
✔ +24.82% Gain
✔ Absolute Gain: +24.81%
✔ Drawdown: Only 0.86%
✔ Profit Factor: 19.42
✔ 7,926+ Pips Captured
✔ 87% Long win rate | 85% Short win rate
Extremely stable. Very low drawdown. Very high profit factor.
From a risk-adjusted perspective, this has been the most balanced performer.
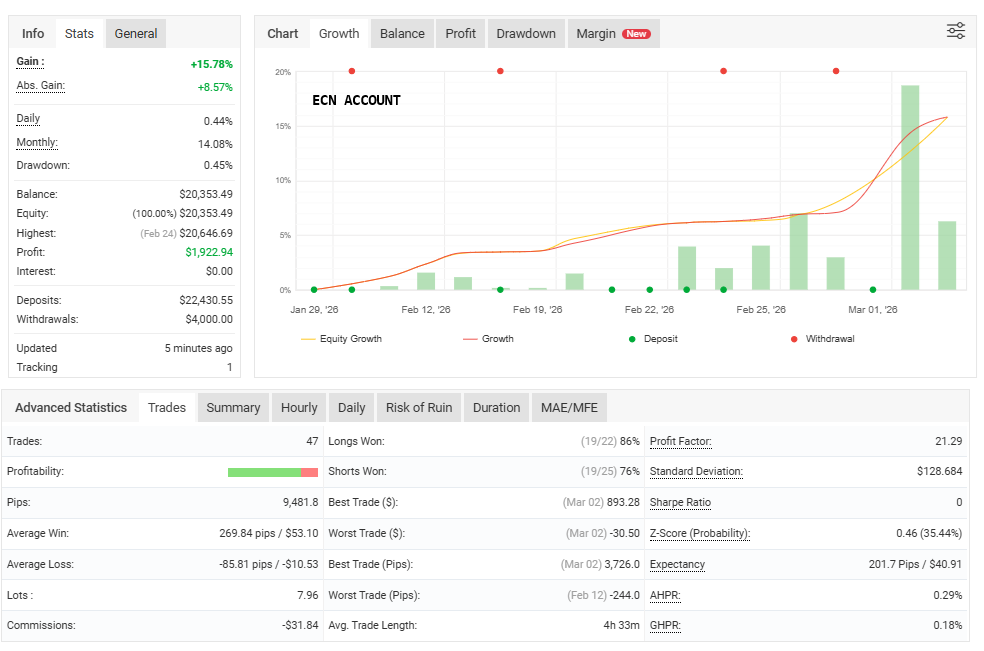
🟢 ECN Account
✔ +15.78% Gain
✔ Absolute Gain: +8.57%
✔ Drawdown: Only 0.45%
✔ Profit Factor: 21.29
✔ 9,481+ Pips Captured
✔ 86% Long win rate | 76% Short win rate
Highest profit factor among all accounts.
Very clean execution. Very controlled risk.
📈 What This Tells Me After 30 Days
Across all accounts:
• Win rate consistently 75–87% range
• Drawdown extremely controlled (under 3%)
• Strong pip accumulation
• Clean equity curve growth
• High profit factor across all setups
The EA:
✔ Trades selectively
✔ Avoids chaotic volatility
✔ Performs best in structured sessions
✔ Adapts well to different account types
🏆 Best Account So Far?
If we rank by:
• Highest % Growth → ZERO Spread(using super high risk lot size)
• Best Risk-Adjusted Stability → CENT (high risk)
• Best Profit Factor → ECN (low medium risk)
Personally, for larger capital deployment, ECN has shown the most professional balance of execution, low drawdown, and consistency.
But ZERO Spread delivered explosive percentage growth this month.
🔎 My Honest 30-Day Conclusion
I observed Quantum Queen since October.
I activated it January 29.
After 30 days of live execution:
It is not overtrading.
It is not reckless.
It respects spread.
It respects volatility.
It compounds when structure appears.
For me, this has been a strong first month.
🚀 For Those Interested
If you are considering trying Quantum Queen:
I recommend running it under CXM for optimal conditions:
✔ Fast execution speed
✔ Clean fills
✔ Stable spread behavior
✔ Compatible with Zero, ECN, and Cent structures
✔ Good liquidity for XAUUSD scalping
If you want my CXM IB link, message me directly.
or click this link https://secure.cxm.com/links/go/308814
Execution environment matters.
Spread matters.
Latency matters.
Quantum Queen performs best in a clean execution environment.
📌 Final Note
This is 30 days only.
Markets change.
Risk management still matters.
But after one full month of real tracking — I’m satisfied with the structure.
More updates at 60 days.
— Rustan Mallari 🇵🇭
30 Days Live. Real Accounts. Real Data. 📊💰
DAY 30 Since January 29 Launch
It has officially been 30 days since I activated Quantum Queen live after observing it since October.
For transparency, I deployed it across three CXM account types:
• ZERO Spread
• CENT Account
• ECN Account
All running Medium–High default optimized settings.
📊 30-Day Performance Breakdown
🟢 ZERO Spread Account
✔ +57.27% Gain
✔ Monthly: +55.05%
✔ Drawdown: Only 2.58%
✔ Profit Factor: 7.25
✔ 6,936+ Pips Captured
✔ 75% Long win rate | 71% Short win rate
This account showed the strongest percentage growth so far with very controlled drawdown relative to return.
🟢 CENT Account
✔ +24.82% Gain
✔ Absolute Gain: +24.81%
✔ Drawdown: Only 0.86%
✔ Profit Factor: 19.42
✔ 7,926+ Pips Captured
✔ 87% Long win rate | 85% Short win rate
Extremely stable. Very low drawdown. Very high profit factor.
From a risk-adjusted perspective, this has been the most balanced performer.
🟢 ECN Account
✔ +15.78% Gain
✔ Absolute Gain: +8.57%
✔ Drawdown: Only 0.45%
✔ Profit Factor: 21.29
✔ 9,481+ Pips Captured
✔ 86% Long win rate | 76% Short win rate
Highest profit factor among all accounts.
Very clean execution. Very controlled risk.
📈 What This Tells Me After 30 Days
Across all accounts:
• Win rate consistently 75–87% range
• Drawdown extremely controlled (under 3%)
• Strong pip accumulation
• Clean equity curve growth
• High profit factor across all setups
The EA:
✔ Trades selectively
✔ Avoids chaotic volatility
✔ Performs best in structured sessions
✔ Adapts well to different account types
🏆 Best Account So Far?
If we rank by:
• Highest % Growth → ZERO Spread(using super high risk lot size)
• Best Risk-Adjusted Stability → CENT (high risk)
• Best Profit Factor → ECN (low medium risk)
Personally, for larger capital deployment, ECN has shown the most professional balance of execution, low drawdown, and consistency.
But ZERO Spread delivered explosive percentage growth this month.
🔎 My Honest 30-Day Conclusion
I observed Quantum Queen since October.
I activated it January 29.
After 30 days of live execution:
It is not overtrading.
It is not reckless.
It respects spread.
It respects volatility.
It compounds when structure appears.
For me, this has been a strong first month.
🚀 For Those Interested
If you are considering trying Quantum Queen:
I recommend running it under CXM for optimal conditions:
✔ Fast execution speed
✔ Clean fills
✔ Stable spread behavior
✔ Compatible with Zero, ECN, and Cent structures
✔ Good liquidity for XAUUSD scalping
If you want my CXM IB link, message me directly.
or click this link https://secure.cxm.com/links/go/308814
Execution environment matters.
Spread matters.
Latency matters.
Quantum Queen performs best in a clean execution environment.
📌 Final Note
This is 30 days only.
Markets change.
Risk management still matters.
But after one full month of real tracking — I’m satisfied with the structure.
More updates at 60 days.
— Rustan Mallari 🇵🇭
30 Days Live. Real Accounts. Real Data. 📊💰
Rustan Nino Mallari
Hello everyone 👋
Here is my 15-day live update using Quantum Queen EA.
As mentioned in my previous post, I purchased Quantum Queen for USD 1,400 and began live deployment under real market conditions.
For transparency, I decided to test it across three different account types with CXM:
🔧 My Current Setup
Broker: CXM
Accounts Tested:
• CENT Account
• ECN Account
• ZERO Spread Account
Symbol: XAUUSD (Gold)
Risk Setting: Medium–High (default optimized settings)
VPS: MQL5 VPS – 1.67ms latency
📊 15-Day Performance Review
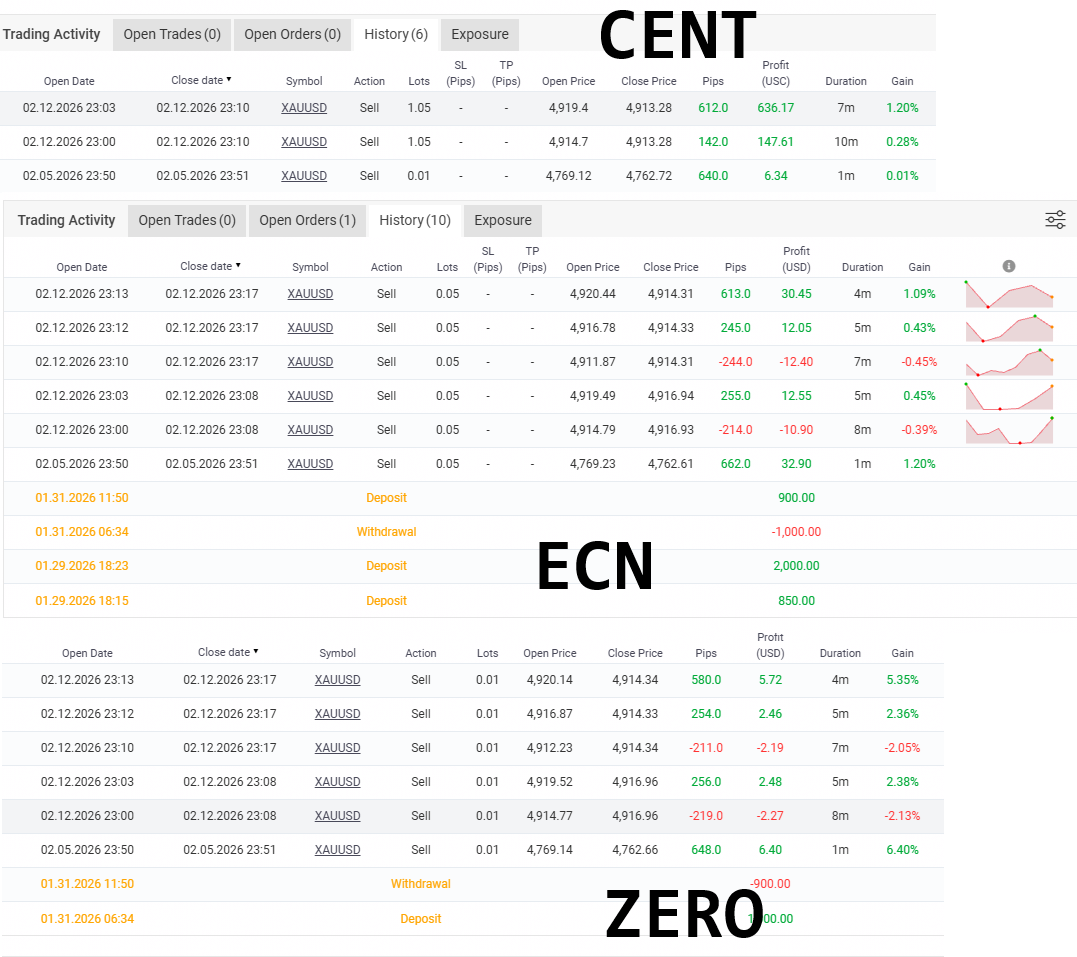
1️⃣ Execution & Trade Behavior
From the attached trade history across all 3 accounts:
• The EA trades primarily during late New York to Asian session
• Positions are short-duration (1–10 minutes average)
• Multiple structured entries per session
• Selective trading — not constant overtrading
One thing I observed clearly:
✔ It avoids abnormal spread spikes
✔ It does not aggressively trade during unstable market crashes
✔ It behaves cautiously during volatile conditions
Execution between ECN and ZERO spread accounts was noticeably clean.
CENT account also performed well, but lot sizing behavior differs slightly due to cent structure.
2️⃣ Spread Comparison (CXM Accounts)
CENT Account
Larger lot sizing scaling (as expected)
Stable execution
Good short-term pip capture
ECN Account
Clean fills
Slightly tighter trade management
Consistent profit structure
ZERO Spread Account
Very clean execution
Profits align closely with ECN behavior
Lower spread impact on short scalps
Overall observation:
The EA adapts well across different spread environments, but ECN and ZERO accounts appear optimal for tighter execution.
3️⃣ Trade Characteristics (From History)
Based on the attached logs:
• Trades captured 200–600+ pips per move (Gold pricing scale)
• Average duration: 1–8 minutes
• Win/loss distribution remains controlled
• Losses are contained relative to wins
• Structured position layering observed
The system does not appear random. Entries are clustered around structured price movement phases.
4️⃣ Drawdown Observation (First 15 Days)
So far:
• Drawdowns have remained manageable under Medium–High risk
• No extreme volatility spikes encountered
• Account equity movement appears stable
Of course, 15 days is still early — but behavior has been consistent.
5️⃣ General Impression After 15 Days
My honest observations:
✔ The EA behaves professionally
✔ It avoids chaotic market entries
✔ It trades during calmer liquidity windows
✔ It performs consistently across 3 account types
✔ It respects execution quality (spread/slippage awareness)
It is not a “spray and pray” bot.
It waits. Then executes.
🔎 Important Reminder
15 days is not long-term data.
Market conditions change.
But based on:
• Execution behavior
• Trade logic
• Spread sensitivity
• Multi-account consistency
I am satisfied with the structure so far.
📌 What’s Next?
I will continue monitoring:
• Performance through a trending gold phase
• Behavior during high-impact news
• Drawdown stability
• 30-day and 60-day metrics
I will provide another update at the 30-day mark with deeper statistics.
Thank you again to the developer.
Looking forward to seeing how Quantum Queen performs in different market cycles.
— Rustan Mallari
Philippines 🇵🇭
Happy trading everyone 🚀📈
Here is my 15-day live update using Quantum Queen EA.
As mentioned in my previous post, I purchased Quantum Queen for USD 1,400 and began live deployment under real market conditions.
For transparency, I decided to test it across three different account types with CXM:
🔧 My Current Setup
Broker: CXM
Accounts Tested:
• CENT Account
• ECN Account
• ZERO Spread Account
Symbol: XAUUSD (Gold)
Risk Setting: Medium–High (default optimized settings)
VPS: MQL5 VPS – 1.67ms latency
📊 15-Day Performance Review
1️⃣ Execution & Trade Behavior
From the attached trade history across all 3 accounts:
• The EA trades primarily during late New York to Asian session
• Positions are short-duration (1–10 minutes average)
• Multiple structured entries per session
• Selective trading — not constant overtrading
One thing I observed clearly:
✔ It avoids abnormal spread spikes
✔ It does not aggressively trade during unstable market crashes
✔ It behaves cautiously during volatile conditions
Execution between ECN and ZERO spread accounts was noticeably clean.
CENT account also performed well, but lot sizing behavior differs slightly due to cent structure.
2️⃣ Spread Comparison (CXM Accounts)
CENT Account
Larger lot sizing scaling (as expected)
Stable execution
Good short-term pip capture
ECN Account
Clean fills
Slightly tighter trade management
Consistent profit structure
ZERO Spread Account
Very clean execution
Profits align closely with ECN behavior
Lower spread impact on short scalps
Overall observation:
The EA adapts well across different spread environments, but ECN and ZERO accounts appear optimal for tighter execution.
3️⃣ Trade Characteristics (From History)
Based on the attached logs:
• Trades captured 200–600+ pips per move (Gold pricing scale)
• Average duration: 1–8 minutes
• Win/loss distribution remains controlled
• Losses are contained relative to wins
• Structured position layering observed
The system does not appear random. Entries are clustered around structured price movement phases.
4️⃣ Drawdown Observation (First 15 Days)
So far:
• Drawdowns have remained manageable under Medium–High risk
• No extreme volatility spikes encountered
• Account equity movement appears stable
Of course, 15 days is still early — but behavior has been consistent.
5️⃣ General Impression After 15 Days
My honest observations:
✔ The EA behaves professionally
✔ It avoids chaotic market entries
✔ It trades during calmer liquidity windows
✔ It performs consistently across 3 account types
✔ It respects execution quality (spread/slippage awareness)
It is not a “spray and pray” bot.
It waits. Then executes.
🔎 Important Reminder
15 days is not long-term data.
Market conditions change.
But based on:
• Execution behavior
• Trade logic
• Spread sensitivity
• Multi-account consistency
I am satisfied with the structure so far.
📌 What’s Next?
I will continue monitoring:
• Performance through a trending gold phase
• Behavior during high-impact news
• Drawdown stability
• 30-day and 60-day metrics
I will provide another update at the 30-day mark with deeper statistics.
Thank you again to the developer.
Looking forward to seeing how Quantum Queen performs in different market cycles.
— Rustan Mallari
Philippines 🇵🇭
Happy trading everyone 🚀📈
: