Dennis Hoinkis
Dennis Hoinkis
  • 情報
no
経験
6
製品
0
デモバージョン
0
ジョブ
1
シグナル
0
購読者
Developer of the GoldGridBot Expert Advisor for MT5 において Glomastco Ltd.
X
GoldGridBot – MetaTrader 5 用ゴールド・グリッドEA

私たちが開発する GoldGridBot は、ゴールド(XAUUSD)のみを、ルールに基づく固定グリッド方式で取引するエキスパートアドバイザーです。一方向への大きな賭けではなく、複数ポジションによるグリッドで運用し、合計の利益目標に達した時点で関連ポジションをまとめて決済します。

• EA に3つのリスクプロファイルを内蔵:LOW、MEDIUM、HIGH ― パラメータ画面で選択するだけ、セットファイルは不要
• HIGH(当社ライブ口座の設定)は明示的な確認が必要。未確認の場合、EA は自動的に MEDIUM で取引します
• VT Markets のリアル口座(セント口座)で稼働中、MyFxBook で公開検証済み ― ドローダウンも含めて公開
• ストラテジーテスターでバックテストできる無料デモ版
• 購入・アクティベーション・アップデートは MQL5 マーケット経由

必要資金の目安:0.01ロットごとに現在の金価格の1~1.5倍(LOW/MEDIUM)。セント口座なら40~60 USDから始められます。

当社ウェブサイトに登録すると、追加セット、バックテスト・ブローカー分析、ニュースレターを無料で入手できます(購入不要)。

リスク警告:グリッドシステムは含み損のポジションを意図的に保有します。強いトレンドではドローダウンが大きく拡大し、資金をすべて失う可能性があります。過去の実績は将来の成果を保証するものではありません。失っても問題のない資金でのみ取引してください。
友達 1
Dennis Hoinkis パブリッシュされたプロダクト

SMC Zones は確定足のみを使ってチャート上に Fair Value Gaps (FVG) と Order Blocks (OB) を表示し、初期設定では現在価格に最も近い未充足のゾーンだけを表示します。 主な機能 確定した3本のローソク足から FVG を検出し、ATR の倍数とポイントで最小サイズを絞り込めます。 Order block:FVG を生んだ値動きの直前にある最後の反対方向のローソク足です。 リペイントなし:一度表示されたゾーンは、価格に埋められた場合を除き、移動も消去もされません。 上位時間足のゾーンを破線の枠で追加表示できます。 チャート背景色と合成した半透明の塗り、細い枠線、任意の50%ラインと短いラベル。 3種類の充足ルール(Full、Half、Touch)。充足したゾーンは削除、淡色表示、そのまま保持から選べます。 新しいゾーンの出現と、表示中のゾーンへの価格進入をポップアップ、プッシュ通知、サウンドで通知します。 最も近い未充足の買い・売り FVG を持つ4つのバッファがあり、iCustom で EA から読み取れます。 見方 緑のゾーンは買いの

Dennis Hoinkis パブリッシュされたプロダクト

GoldGridBot Starter は、固定の保守的なプロファイルで XAUUSD のグリッド戦略を取引する MetaTrader 5 用の EA です。 主な機能 1注文あたり 0.01 ロットの固定ロット、1バスケットあたり最大 14 トレード。 注文間のグリッド間隔は 150 ポイント(1.50 USD)。 共通のバスケット利確:買いバスケットは平均価格の 100 ポイント(1.00 USD)上、売りバスケットは平均価格の 100 ポイント下。 最大 71 本の M1 足以内に 0.3% 以上のモメンタムの動きがあった後、上位時間足のトレンド方向(M15 MA50 と M5 MA20、バッファ 0.05%)にのみエントリー。 スピードブレーキ:バスケットが 5 分以内にレベル 5 に達した場合、決済します。 タイムブレーキ:3 日以上保有されたバスケットは決済します。 証拠金ガード:注文後の証拠金維持率が 200% を下回る場合、またはバスケットが 3% の価格ギャップに耐えられない場合は新規注文を出しません。証拠金維持率が 100% を下回ると、EA

Dennis Hoinkis パブリッシュされたプロダクト

Gold Grid Risk Simulator は、計画中の買いまたは売りのグリッドが口座に与える影響を計算します。ドローダウン、証拠金維持率、マージンコール価格、ストップアウト価格、グリッドに必要な残高を表示します。 主な機能 開始価格からグリッドを1段ずつシミュレーション:エントリー、ロット、累計ロット、平均価格、バスケット TP、含み損益、使用証拠金、有効証拠金、証拠金維持率。 グリッドの段の間で正確に求めたマージンコール価格とストップアウト価格を、開始価格からの距離(価格単位と %)とともに表示します。 すべての段が約定する前にストップアウトする場合の警告、耐えられる最大の逆行幅、ストップアウト時の損失。 推奨最低残高:グリッド全体に追加の逆行幅を加えてもストップアウト水準を上回る残高。 10、25、50、100 価格単位の逆行に対するシナリオ表と、OK、MARGIN CALL、STOPPED OUT のステータス。 コンパクトモード(初期設定でオン):段の表には 1、5、10、14 段目、最終段、マージンコールまたはストップアウトを下回る最初の行のみを表示し、1080p

Dennis Hoinkis パブリッシュされたプロダクト

MTF Dashboard RSI ADX Volume は、メインチャートウィンドウに表示されるコンパクトなパネルで、現在のシンボルの複数の時間足について RSI、ADX、相対ティックボリュームを同時に表示します。 主な機能 有効にした時間足ごとに1行:初期設定は M1、M5、M15、M30、H1、H4、D1 です。 列:TF、RSI、ADX、+DI、-DI、Trend、Vol %。 時間足の名前は方向に応じて色分けされます。+DI が -DI より上で RSI が 50 より上なら強気、-DI が +DI より上で RSI が 50 より下なら弱気、それ以外は中立です。 Trend 列:ADX がしきい値を上回ると「Strong Up」または「Strong Down」、それ以外は「Range」と表示します。 相対ボリューム:形成中のバーのティックボリュームを、直前の確定バーの平均に対するパーセントで表示します。 Bias 行は強気・弱気・中立の時間足の数を集計し、全体を Bullish、Bearish、Mixed のいずれかで表示します。

Dennis Hoinkis パブリッシュされたプロダクト

Volume Profile Sidebar はチャートの端に価格帯別出来高の横向きヒストグラムを描画し、Point of Control (POC) と Value Area を表示します。 主な機能 3つの範囲モード:表示範囲、直近 N 本、当日 / セッション。 POC の行、Value Area 内の行(初期値70%)、範囲外の行をそれぞれ別の色で表示。 POC、Value Area High (VAH)、Value Area Low (VAL) のラインと価格ラベルを任意で表示。 各足の出来高を高値から安値の範囲に配分します。M1 データがある場合はそれを使うため、上位時間足でもより細かいプロファイルが得られます。 初期設定はティックボリューム。利用可能な場合は実出来高も使えます。 表示範囲モードでは、チャートのスクロールや拡大縮小に合わせてプロファイルが自動で更新されます。 ヒストグラムは右側または左側に配置でき、チャートシフト領域内への配置や、ローソク足の背面・前面の切り替えも可能です。 見方

Dennis Hoinkis パブリッシュされたプロダクト

999.00 USD

GoldGridBot is a grid Expert Advisor for XAUUSD (gold) on MetaTrader 5. It waits for a strong momentum move, enters in the direction of the higher-timeframe trend and manages all positions as one basket with a common take profit. How it works Trend filter on M15 and M5 (moving averages) Entry after a momentum reversal on M1 Grid re-entries at a fixed distance when the price moves against the basket One take profit for the whole basket, measured from the average entry price Speed brake and time

Dennis Hoinkis
Dennis Hoinkis
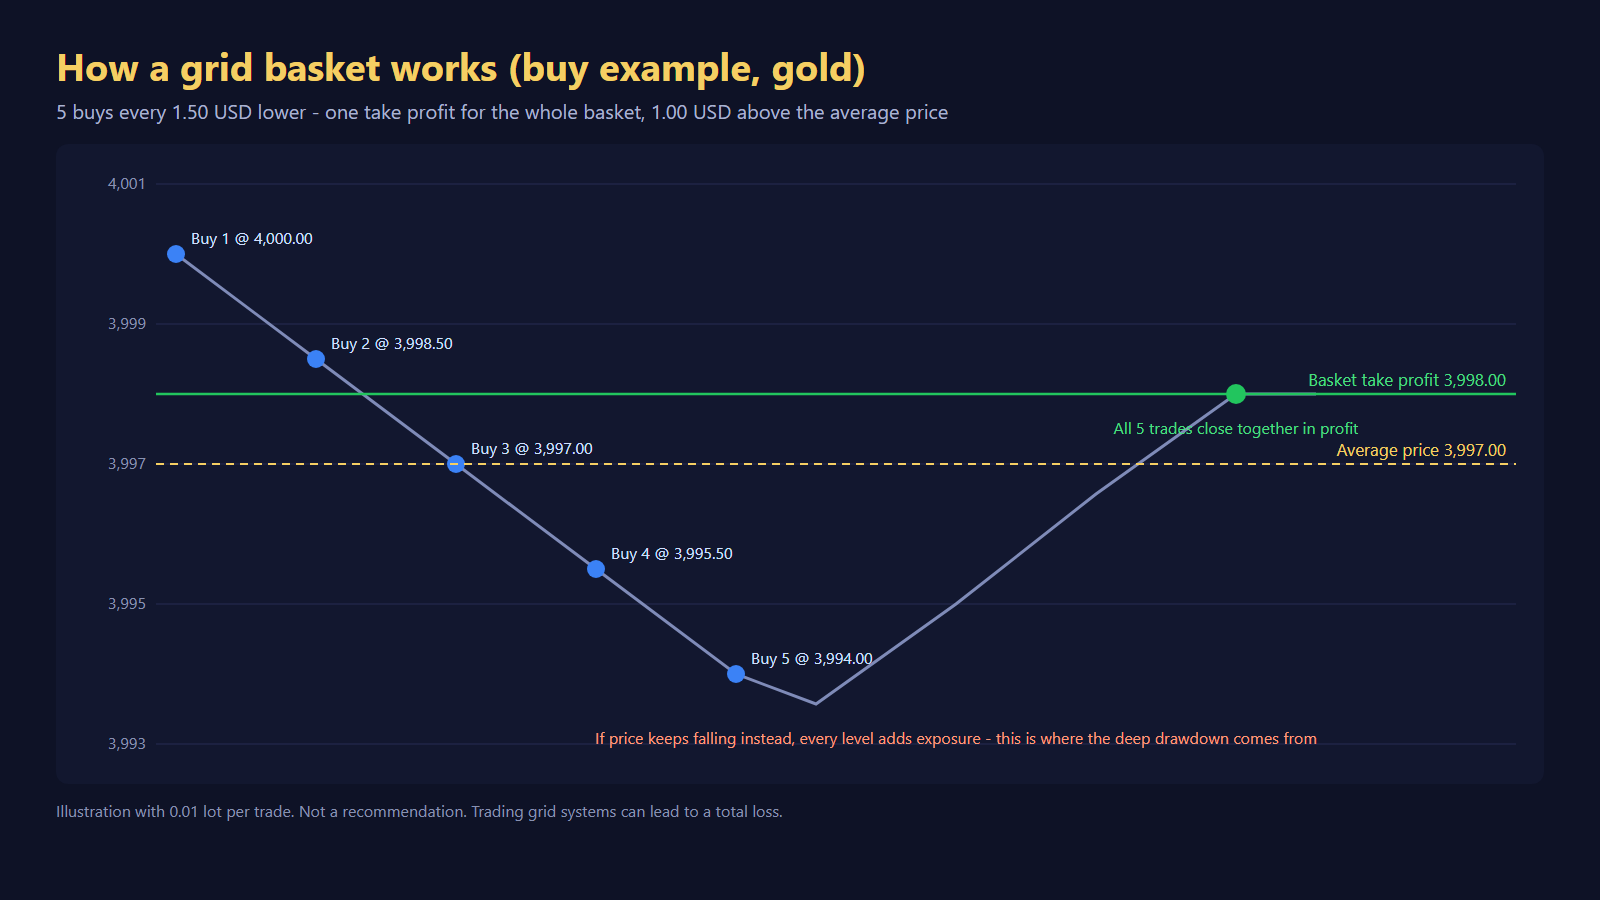
Worked example from my article "How a Gold Grid Works – and Why It Is Dangerous" (post below): five buys every 1.50 USD lower, one take profit for the whole basket 1.00 USD above the average price. A pullback to 3,998.00 closes all five trades together in profit. If price keeps falling instead, every level adds exposure – that is where the deep drawdown of a grid comes from.

Not investment advice. Trading grid systems can lead to a total loss.
Dennis Hoinkis
Dennis Hoinkis
How a Gold Grid Works – and Why It Is Dangerous

Grid Expert Advisors for gold are among the most popular bots on MetaTrader 5. Their equity curves often look impressive: up month after month, with a win rate well above 70%. That is exactly what makes them dangerous if you don't understand what is happening under the hood. In this article I explain step by step how a gold grid works, why it wins so often and why it can still wipe out an account at some point. As an example I use the logic of our own grid EA and its three settings (LOW, MEDIUM, HIGH), with real backtest numbers – including the bad ones.

WHAT IS A GRID EA?

A grid EA does not just open one position. When needed, it builds a whole basket of positions. If price moves against the first trade, the EA adds more trades at fixed distances. All positions belong together and are closed together. So the EA is not trying to get every single trade right. It is betting that price will eventually move back a little.

THE ENTRY: MOMENTUM AND TREND FILTER

Before a basket even starts, the market has to meet two conditions. The EA in this example trades XAUUSD (gold against the US dollar) only.

- Trend filter: a moving average (MA) 50 on M15 and an MA 20 on M5, plus a buffer of 0.05%. The EA only trades in the direction of the trend.
- Momentum: price must have moved at least 0.3% within no more than 71 M1 candles. Only then does the EA open the first trade.
- Pauses: after an entry there is a pause of 10 candles, after a closed basket it is 17 candles.

So the entry is not random. But even the best filter cannot predict whether price will keep going or turn around afterwards. And that is where the grid begins.

ADDING TRADES AT FIXED DISTANCES

If price moves against the basket, the EA adds another trade – every 150 points (1.50 USD in the gold price) on the LOW and MEDIUM settings, every 200 points on the HIGH setting. The number of levels is limited: at most 14 trades on LOW and at most 18 on MEDIUM and HIGH.

A WORKED EXAMPLE (see first image)

There is only one take profit for the entire basket: 100 points (1.00 USD) above the average price of all positions (below it for a sell basket). Let's say the EA buys gold at 4,000.00 USD with the same lot size on every level, and price falls:

Level - Buy price - Average price - Basket take profit
1 - 4,000.00 - 4,000.00 - 4,001.00
2 - 3,998.50 - 3,999.25 - 4,000.25
3 - 3,997.00 - 3,998.50 - 3,999.50
4 - 3,995.50 - 3,997.75 - 3,998.75
5 - 3,994.00 - 3,997.00 - 3,998.00

With every level the average price drops, and so does the target. After five levels price is at 3,994.00. For the whole basket to close in profit, gold only has to get back to 3,998.00 – a rise of 4 USD. The first trade at 4,000.00 even closes with a small loss, but the lower buys more than make up for it. The basket as a whole wins.

WHY THE WIN RATE IS SO HIGH

Gold moves constantly. A pullback of a few dollars almost always comes at some point. That is why most baskets close in profit. In our backtests (MT5 Strategy Tester, "every tick", XAUUSD, 01 Jan 2024 to 31 Oct 2026, starting with 3,000 USD, fixed 0.01 lot) it looks like this:

Setting - Final balance (backtest) - Max. equity drawdown - Profit factor - Trades / won
LOW - 17,767 USD - 52% - 1.54 - 13,488 / 77%
MEDIUM - 23,948 USD - 25% - 1.88 - 13,825 / 76%

76 to 77% winning trades sounds like an almost perfect system. But look at the column next to it: a maximum drawdown of 25% and 52% in the backtest. The high win rate is not a sign of safety. It is a consequence of how a grid is built.

WHY THE DRAWDOWN IS STRUCTURALLY HIGH

A grid does not take losses, it sits them out. Instead of closing a wrong trade with a stop loss, it adds more and waits. This has two consequences:

- Exposure grows with every level. At level 1 one position is open, at level 10 there are ten. Every further dollar against the basket now costs ten times as much.
- Profits are small, open losses can get large. A basket only earns 1 USD above its average price. A basket stuck deep in the red, on the other hand, puts heavy pressure on the account for as long as it stays open.

So the drawdown is not an accident, it is built in. Many small wins are paid for with rare but large hits.

WHEN ALL LEVELS ARE USED UP

It gets dangerous when price does not turn. On MEDIUM there are 17 gaps of 1.50 USD between the first and the 18th trade, which is 25.50 USD. On HIGH it is 17 x 2.00 = 34 USD. For gold, that is not an extreme move. Once the maximum number of trades is reached, the EA stops adding. If price keeps running, every open position loses with every dollar at the same time. The drawdown gets very deep. When the margin is no longer enough, the margin call comes, and finally the broker's stop-out. On aggressive settings that means losing the entire account.

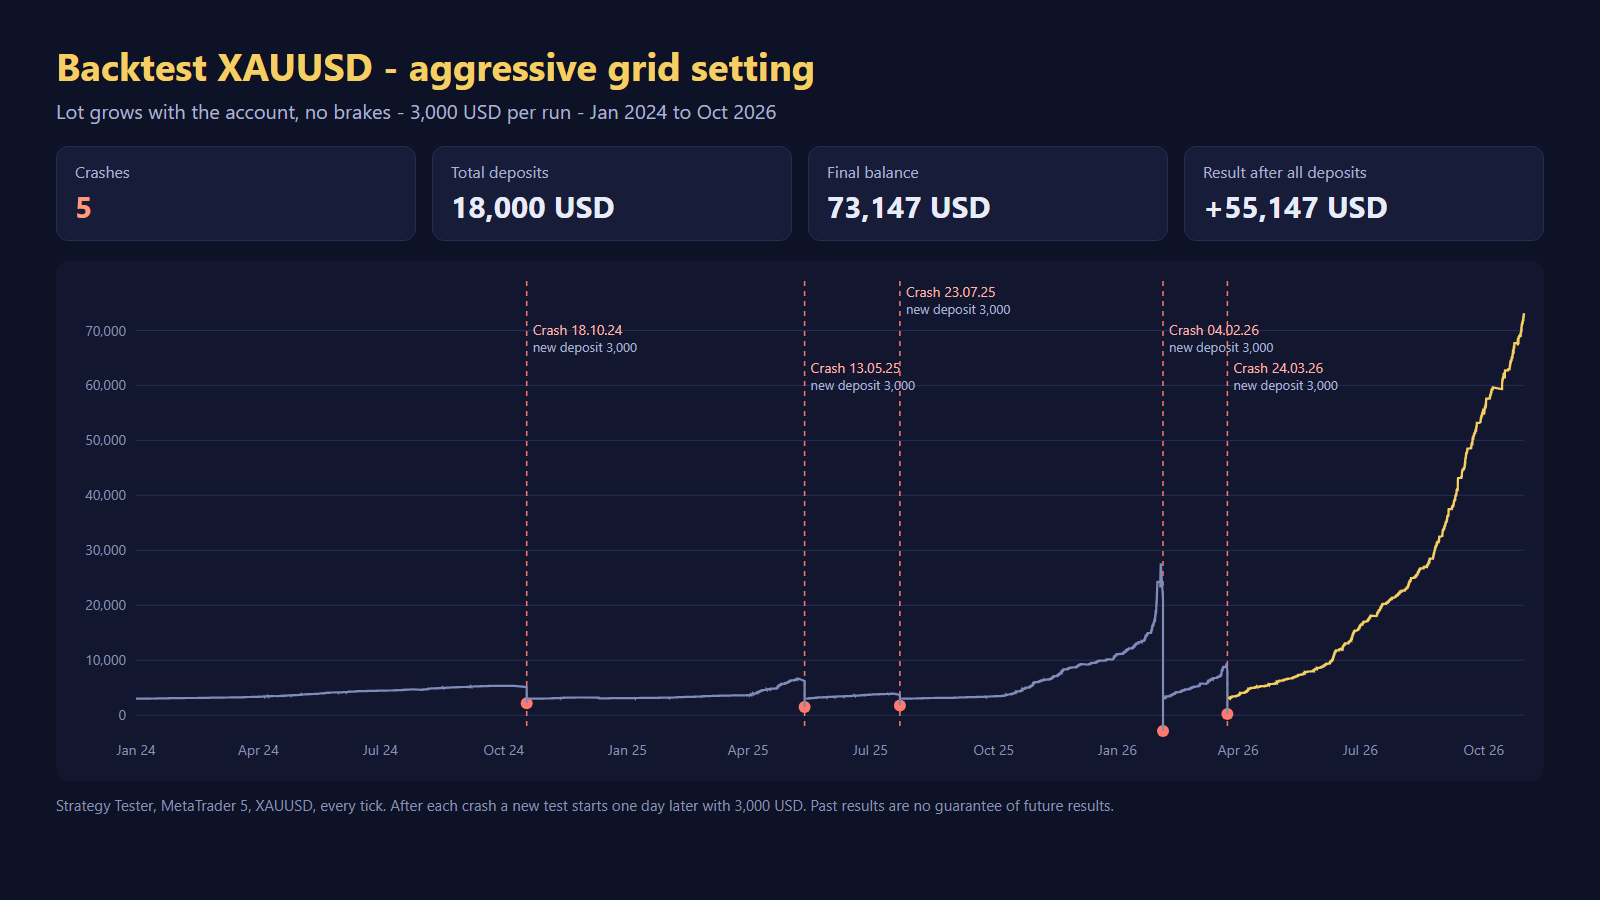
EXAMPLE: THE HIGH SETTING AS A BACKTEST CHAIN (see second image)

How often this can happen is shown by our backtest of the HIGH setting. HIGH grows the lot size with the account (11% risk per grid level) and has no brakes. We ran the backtest as a chain: after every crash, a new backtest starts one day later with 3,000 USD again.

- 5 crashes in the backtest between 2024 and 2026: 18 Oct 2024, 13 May 2025, 23 Jul 2025, 04 Feb 2026 and 24 Mar 2026.
- Deposited: 18,000 USD (six starts of 3,000 USD each).
- Final balance: 73,147 USD, a net result of +55,147 USD.
- The entire gain comes from the last backtest run from 25 Mar 2026: it grew from 3,000 to 73,147 USD. Until then all five runs had been lost; on 24 Mar 2026 the chain stood at -15,000 USD.

The end result is a profit. But only because fresh money was added after every total loss and the last run happened to fall into the boom from March 2026. Anyone who had stopped after the second or third crash would simply have lost money. And nobody knows in advance which run will be the good one.

WHAT PROTECTIONS EXIST

A grid is not completely defenceless. On LOW and MEDIUM, the EA uses several brakes:

- Max trades: 14 on LOW, 18 on MEDIUM. The basket does not grow forever.
- Speed brake: if a basket reaches level 5 within 5 minutes, it is closed immediately. Moves that fast can be the start of a strong breakout.
- Time brake: if a basket has been open for more than 3 days, it is closed.
- Margin guard: no new order if the margin level would fall below 200% after the order. The basket must also be able to survive a 3% price gap. If the margin level drops below 100%, the EA closes the basket itself – before the broker does.

These brakes close baskets at a loss. That hurts, but at best it prevents a total loss. The HIGH setting deliberately has none of these brakes and no margin guard, and it can only be activated after explicit confirmation in the EA. It is built for maximum growth – with the full crash risk.

WHAT YOU SHOULD TAKE AWAY

1. Enough capital: as a rule of thumb, plan 1 to 1.5 times the gold price as capital per 0.01 lot. With gold at 4,000 USD, that is 4,000 to 6,000 USD. With less, the risk rises significantly. A cent account is an alternative for getting to know a grid EA.
2. Only money you don't need: never use money you need for rent, bills or savings.
3. Expect the crash: on aggressive settings a total loss is not the exception but part of the plan. Plan for it instead of hoping it won't happen.
4. Don't be dazzled by the win rate: always look at the maximum drawdown and at what happens when all levels are used up.

Not investment advice. Trading with leverage and grid systems can lead to a total loss. Backtests and past results are no guarantee of future performance.
Dennis Hoinkis
MQL5.communityに登録されました