Dennis Hoinkis
Dennis Hoinkis
  • 정보
no
경험
6
제품
0
데모 버전
0
작업
1
거래 신호
0
구독자
Developer of the GoldGridBot Expert Advisor for MT5 에 Glomastco Ltd.
X
GoldGridBot – MetaTrader 5용 골드 그리드 EA

저희가 개발한 GoldGridBot은 금(XAUUSD)만을 고정된 규칙 기반 그리드 방식으로 거래하는 Expert Advisor입니다. 한 방향에 크게 베팅하는 대신 여러 포지션으로 구성된 그리드로 운용하며, 전체 수익 목표에 도달하면 관련 포지션을 한꺼번에 청산합니다.

• EA에 내장된 3가지 리스크 프로필: LOW, MEDIUM, HIGH – 입력 창에서 선택, 세트 파일 불필요
• HIGH(당사 실계좌 설정)는 별도의 명시적 확인이 필요하며, 확인하지 않으면 EA는 자동으로 MEDIUM으로 거래합니다
• VT Markets 실계좌(센트 계좌) 운용, MyFxBook에서 공개 검증 – 드로다운 포함
• 전략 테스터에서 백테스트할 수 있는 무료 데모 버전
• 구매, 활성화, 업데이트는 MQL5 마켓을 통해 진행

자본 기준: 0.01랏당 현재 금 가격의 1~1.5배 (LOW/MEDIUM). 센트 계좌에서는 40~60 USD로 시작할 수 있습니다.

웹사이트에 가입한 사용자는 추가 세트, 백테스트 및 브로커 분석 자료, 뉴스레터를 무료로 받을 수 있습니다 – 구매하지 않아도 됩니다.

위험 고지: 그리드 시스템은 손실 포지션을 의도적으로 유지합니다. 강한 추세에서는 드로다운이 크게 늘어나 원금 전액을 잃을 수도 있습니다. 과거 실적이 미래 수익을 보장하지 않습니다. 잃어도 감당할 수 있는 자금으로만 거래하세요.
친구 1
Dennis Hoinkis 출시돈 제품

SMC Zones는 마감된 봉만 사용하여 차트에 Fair Value Gaps (FVG)와 Order Blocks (OB)를 표시하며, 기본적으로 현재 가격에 가장 가까운 미충족 존만 보여 줍니다. 주요 기능 마감된 캔들 3개로 FVG를 감지하며, ATR 배수와 포인트 단위로 최소 크기를 필터링할 수 있습니다. Order block: FVG를 만든 움직임 직전의 마지막 반대 방향 캔들입니다. 리페인트 없음: 한 번 나타난 존은 가격이 채우는 경우를 제외하고 이동하거나 사라지지 않습니다. 상위 타임프레임의 존을 점선 테두리로 추가 표시할 수 있습니다. 차트 배경색과 혼합된 반투명 채우기, 얇은 테두리, 선택 가능한 50% 라인과 짧은 라벨. 세 가지 충족 규칙(Full, Half, Touch). 충족된 존은 삭제, 흐리게 표시 또는 그대로 유지할 수 있습니다. 새 존이 생기거나 가격이 표시된 존에 진입하면 팝업, 푸시 알림 또는 소리로 알려 줍니다. 가장 가까운 미충족 상승 및 하락

Dennis Hoinkis 출시돈 제품

GoldGridBot Starter는 고정된 보수적 프로필로 XAUUSD에서 그리드 전략을 거래하는 MetaTrader 5용 EA입니다. 주요 기능 주문당 0.01랏 고정, 바스켓당 최대 14개 거래. 주문 간 그리드 간격 150포인트(1.50 USD). 공통 바스켓 익절: 매수 바스켓은 평균가 위 100포인트(1.00 USD), 매도 바스켓은 평균가 아래 100포인트. 최대 71개의 M1 봉 안에서 0.3% 이상의 모멘텀 움직임이 나타난 후, 상위 타임프레임 추세 방향(M15 MA50 및 M5 MA20, 버퍼 0.05%)으로만 진입. 속도 브레이크: 바스켓이 5분 안에 5단계에 도달하면 청산합니다. 시간 브레이크: 3일 넘게 열려 있는 바스켓은 청산합니다. 마진 보호: 주문 후 마진 레벨이 200% 미만이 되거나 바스켓이 3%의 가격 갭을 견딜 수 없으면 새 주문을 내지 않습니다. 마진 레벨이 100% 미만이면 EA가 바스켓을 직접 청산합니다. 각 주문 전에 거래 세션, 마진

Dennis Hoinkis 출시돈 제품

Gold Grid Risk Simulator는 계획한 매수 또는 매도 그리드가 계좌에 미치는 영향을 계산합니다. 드로다운, 마진 레벨, 마진콜 가격, 스톱아웃 가격, 그리고 그리드에 필요한 잔고를 보여줍니다. 주요 기능 시작 가격부터 그리드를 단계별로 시뮬레이션: 진입가, 랏, 누적 랏, 평균 가격, 바스켓 TP, 평가 손익, 사용 증거금, 순자산, 마진 레벨. 그리드 단계 사이에서 정확히 계산한 마진콜 및 스톱아웃 가격과 시작 가격으로부터의 거리(가격 단위 및 %). 모든 단계가 체결되기 전에 스톱아웃이 발생하면 경고하며, 견딜 수 있는 최대 역방향 움직임과 스톱아웃 시 손실을 표시합니다. 권장 최소 잔고: 전체 그리드에 추가 역방향 움직임을 더해도 스톱아웃 수준 위에 머무는 잔고. 10, 25, 50, 100 가격 단위의 역방향 움직임에 대한 시나리오 표와 OK, MARGIN CALL, STOPPED OUT 상태. 컴팩트 모드(기본값 켜짐): 단계 표에 1, 5, 10

Dennis Hoinkis 출시돈 제품

MTF Dashboard RSI ADX Volume은 메인 차트 창에 표시되는 간결한 패널로, 현재 심볼의 여러 타임프레임에 대한 RSI, ADX, 상대 틱 거래량을 한 번에 보여줍니다. 주요 기능 활성화된 타임프레임마다 한 행: 기본값은 M1, M5, M15, M30, H1, H4, D1입니다. 열: TF, RSI, ADX, +DI, -DI, Trend, Vol %. 타임프레임 이름은 방향에 따라 색이 바뀝니다. +DI가 -DI보다 높고 RSI가 50보다 높으면 강세, -DI가 +DI보다 높고 RSI가 50보다 낮으면 약세, 그 외에는 중립입니다. Trend 열: ADX가 기준값보다 높으면 "Strong Up" 또는 "Strong Down", 그렇지 않으면 "Range"를 표시합니다. 상대 거래량: 형성 중인 바의 틱 거래량을 이전 마감된 바들의 평균 대비 백분율로 표시합니다. Bias 행은 강세, 약세, 중립 타임프레임의 수를 집계하고 전체 상황을 Bullish, Bearish

Dennis Hoinkis 출시돈 제품

Volume Profile Sidebar는 차트 측면에 가격대별 거래량을 수평 히스토그램으로 그리고 Point of Control (POC)와 Value Area를 표시합니다. 주요 기능 세 가지 범위 모드: 보이는 범위, 최근 N개 봉, 당일 / 세션. POC 행, Value Area 행(기본값 70%), 영역 밖 행을 각각 다른 색으로 표시. POC, Value Area High (VAH), Value Area Low (VAL)에 대한 선과 가격 라벨을 선택적으로 표시. 각 봉의 거래량을 고가-저가 범위에 분배합니다. M1 데이터가 있으면 이를 사용하므로 상위 타임프레임에서도 더 세밀한 프로파일을 얻을 수 있습니다. 기본값은 틱 거래량이며, 사용 가능한 경우 실제 거래량도 사용할 수 있습니다. 보이는 범위 모드에서는 스크롤과 확대/축소에 따라 프로파일이 자동으로 갱신됩니다. 히스토그램을 오른쪽 또는 왼쪽에 배치할 수 있고, 차트 시프트 영역 안에 두거나 캔들 뒤 또는 앞에 그릴

Dennis Hoinkis 출시돈 제품

999.00 USD

GoldGridBot is a grid Expert Advisor for XAUUSD (gold) on MetaTrader 5. It waits for a strong momentum move, enters in the direction of the higher-timeframe trend and manages all positions as one basket with a common take profit. How it works Trend filter on M15 and M5 (moving averages) Entry after a momentum reversal on M1 Grid re-entries at a fixed distance when the price moves against the basket One take profit for the whole basket, measured from the average entry price Speed brake and time

Dennis Hoinkis
Dennis Hoinkis
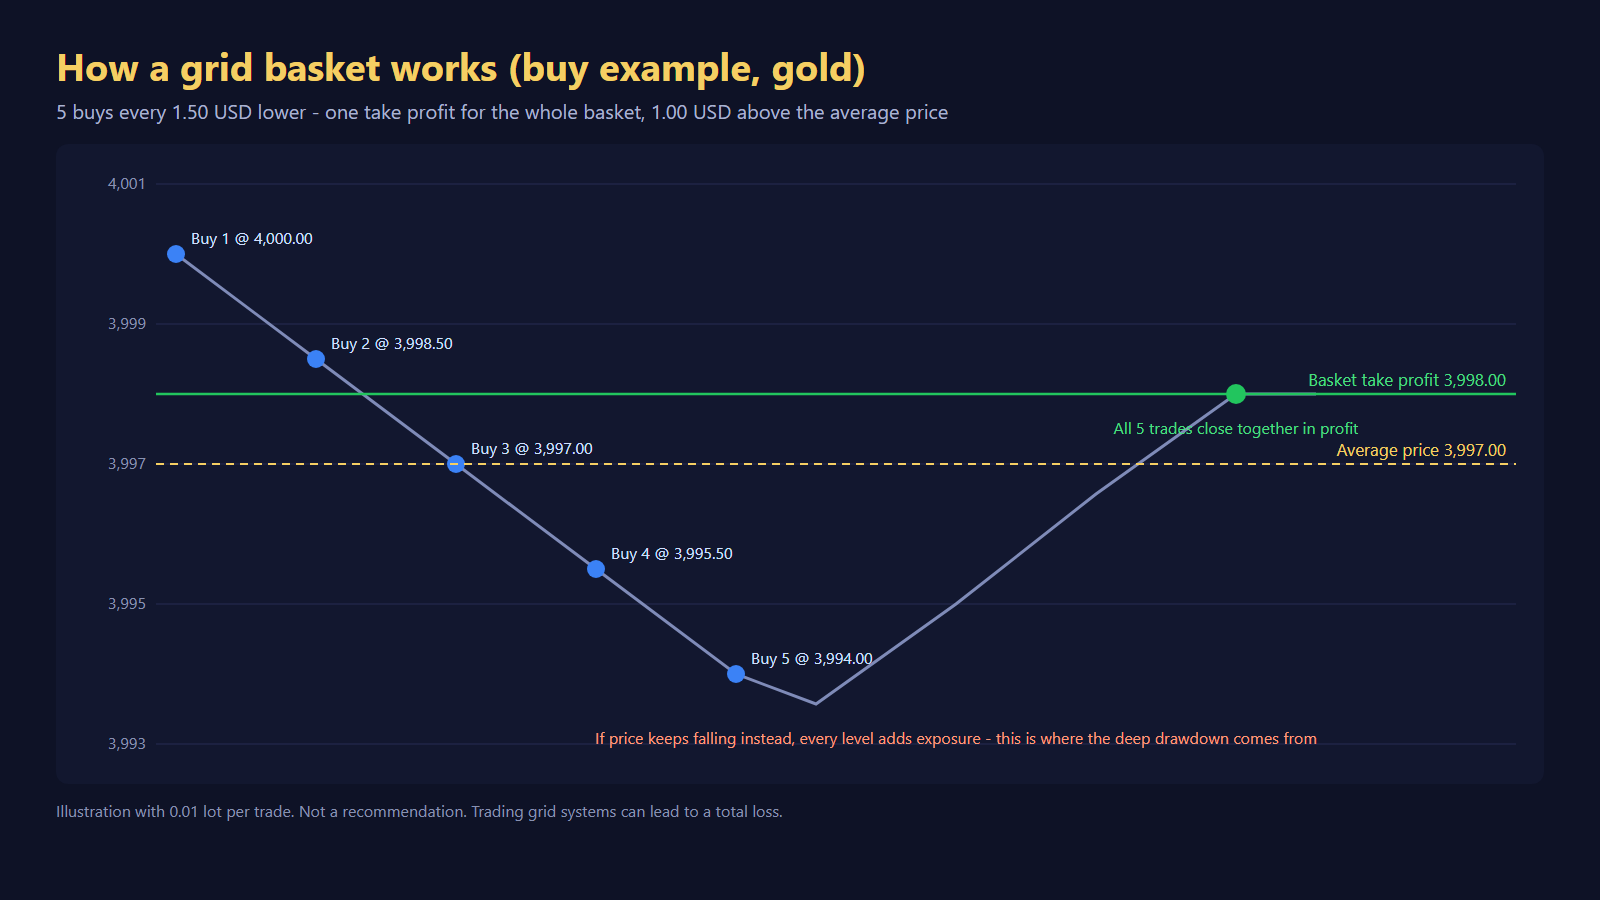
Worked example from my article "How a Gold Grid Works – and Why It Is Dangerous" (post below): five buys every 1.50 USD lower, one take profit for the whole basket 1.00 USD above the average price. A pullback to 3,998.00 closes all five trades together in profit. If price keeps falling instead, every level adds exposure – that is where the deep drawdown of a grid comes from.

Not investment advice. Trading grid systems can lead to a total loss.
Dennis Hoinkis
Dennis Hoinkis
How a Gold Grid Works – and Why It Is Dangerous

Grid Expert Advisors for gold are among the most popular bots on MetaTrader 5. Their equity curves often look impressive: up month after month, with a win rate well above 70%. That is exactly what makes them dangerous if you don't understand what is happening under the hood. In this article I explain step by step how a gold grid works, why it wins so often and why it can still wipe out an account at some point. As an example I use the logic of our own grid EA and its three settings (LOW, MEDIUM, HIGH), with real backtest numbers – including the bad ones.

WHAT IS A GRID EA?

A grid EA does not just open one position. When needed, it builds a whole basket of positions. If price moves against the first trade, the EA adds more trades at fixed distances. All positions belong together and are closed together. So the EA is not trying to get every single trade right. It is betting that price will eventually move back a little.

THE ENTRY: MOMENTUM AND TREND FILTER

Before a basket even starts, the market has to meet two conditions. The EA in this example trades XAUUSD (gold against the US dollar) only.

- Trend filter: a moving average (MA) 50 on M15 and an MA 20 on M5, plus a buffer of 0.05%. The EA only trades in the direction of the trend.
- Momentum: price must have moved at least 0.3% within no more than 71 M1 candles. Only then does the EA open the first trade.
- Pauses: after an entry there is a pause of 10 candles, after a closed basket it is 17 candles.

So the entry is not random. But even the best filter cannot predict whether price will keep going or turn around afterwards. And that is where the grid begins.

ADDING TRADES AT FIXED DISTANCES

If price moves against the basket, the EA adds another trade – every 150 points (1.50 USD in the gold price) on the LOW and MEDIUM settings, every 200 points on the HIGH setting. The number of levels is limited: at most 14 trades on LOW and at most 18 on MEDIUM and HIGH.

A WORKED EXAMPLE (see first image)

There is only one take profit for the entire basket: 100 points (1.00 USD) above the average price of all positions (below it for a sell basket). Let's say the EA buys gold at 4,000.00 USD with the same lot size on every level, and price falls:

Level - Buy price - Average price - Basket take profit
1 - 4,000.00 - 4,000.00 - 4,001.00
2 - 3,998.50 - 3,999.25 - 4,000.25
3 - 3,997.00 - 3,998.50 - 3,999.50
4 - 3,995.50 - 3,997.75 - 3,998.75
5 - 3,994.00 - 3,997.00 - 3,998.00

With every level the average price drops, and so does the target. After five levels price is at 3,994.00. For the whole basket to close in profit, gold only has to get back to 3,998.00 – a rise of 4 USD. The first trade at 4,000.00 even closes with a small loss, but the lower buys more than make up for it. The basket as a whole wins.

WHY THE WIN RATE IS SO HIGH

Gold moves constantly. A pullback of a few dollars almost always comes at some point. That is why most baskets close in profit. In our backtests (MT5 Strategy Tester, "every tick", XAUUSD, 01 Jan 2024 to 31 Oct 2026, starting with 3,000 USD, fixed 0.01 lot) it looks like this:

Setting - Final balance (backtest) - Max. equity drawdown - Profit factor - Trades / won
LOW - 17,767 USD - 52% - 1.54 - 13,488 / 77%
MEDIUM - 23,948 USD - 25% - 1.88 - 13,825 / 76%

76 to 77% winning trades sounds like an almost perfect system. But look at the column next to it: a maximum drawdown of 25% and 52% in the backtest. The high win rate is not a sign of safety. It is a consequence of how a grid is built.

WHY THE DRAWDOWN IS STRUCTURALLY HIGH

A grid does not take losses, it sits them out. Instead of closing a wrong trade with a stop loss, it adds more and waits. This has two consequences:

- Exposure grows with every level. At level 1 one position is open, at level 10 there are ten. Every further dollar against the basket now costs ten times as much.
- Profits are small, open losses can get large. A basket only earns 1 USD above its average price. A basket stuck deep in the red, on the other hand, puts heavy pressure on the account for as long as it stays open.

So the drawdown is not an accident, it is built in. Many small wins are paid for with rare but large hits.

WHEN ALL LEVELS ARE USED UP

It gets dangerous when price does not turn. On MEDIUM there are 17 gaps of 1.50 USD between the first and the 18th trade, which is 25.50 USD. On HIGH it is 17 x 2.00 = 34 USD. For gold, that is not an extreme move. Once the maximum number of trades is reached, the EA stops adding. If price keeps running, every open position loses with every dollar at the same time. The drawdown gets very deep. When the margin is no longer enough, the margin call comes, and finally the broker's stop-out. On aggressive settings that means losing the entire account.

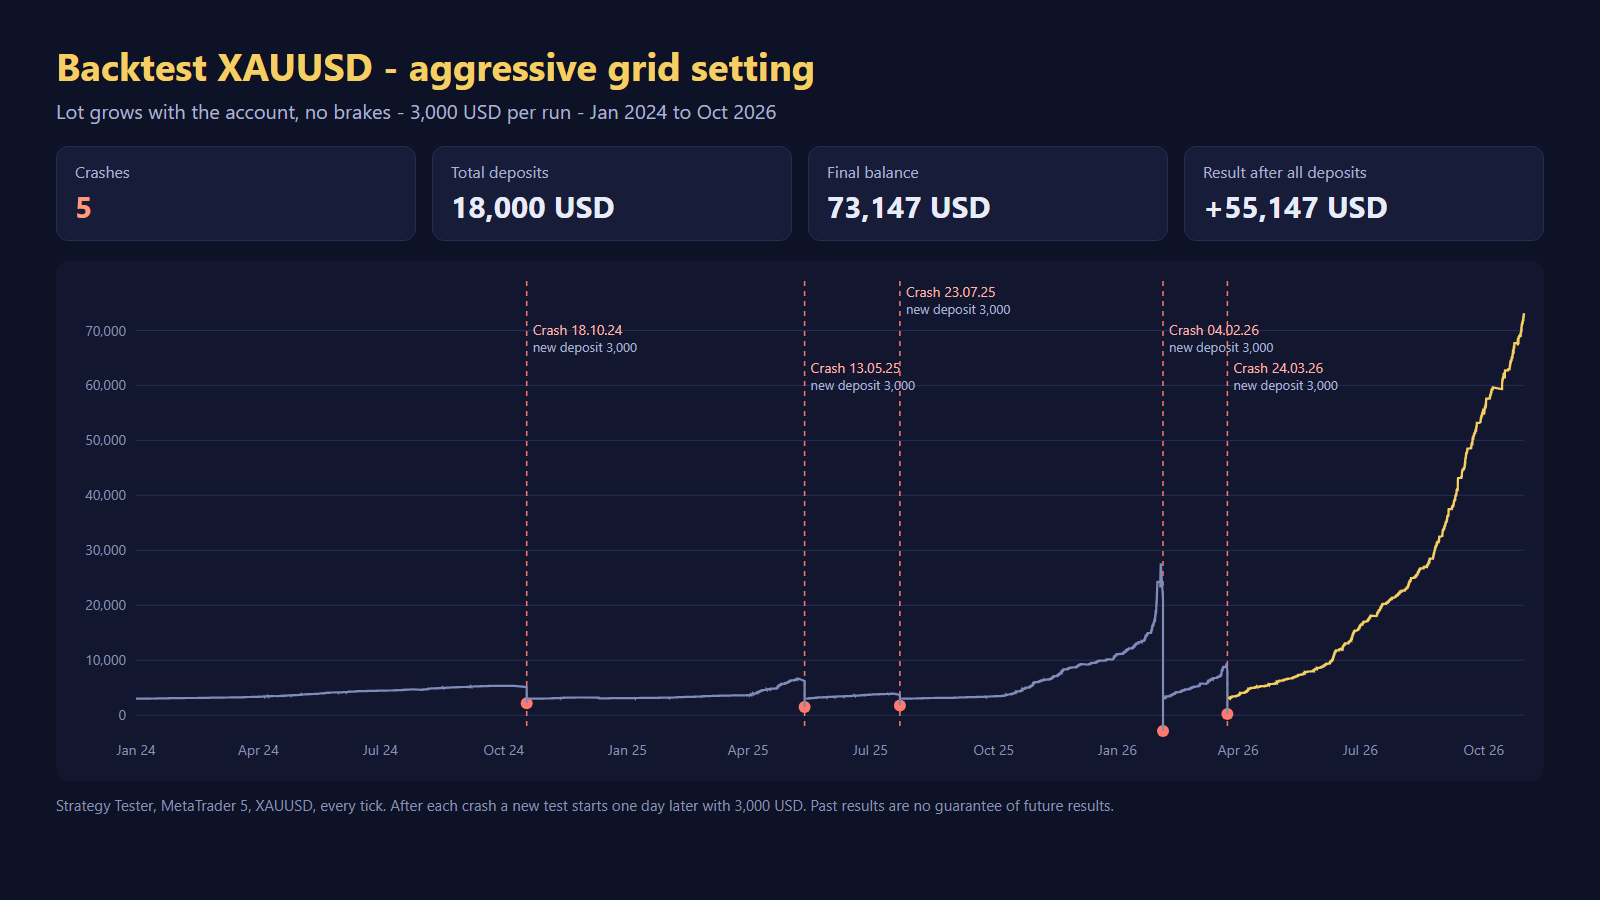
EXAMPLE: THE HIGH SETTING AS A BACKTEST CHAIN (see second image)

How often this can happen is shown by our backtest of the HIGH setting. HIGH grows the lot size with the account (11% risk per grid level) and has no brakes. We ran the backtest as a chain: after every crash, a new backtest starts one day later with 3,000 USD again.

- 5 crashes in the backtest between 2024 and 2026: 18 Oct 2024, 13 May 2025, 23 Jul 2025, 04 Feb 2026 and 24 Mar 2026.
- Deposited: 18,000 USD (six starts of 3,000 USD each).
- Final balance: 73,147 USD, a net result of +55,147 USD.
- The entire gain comes from the last backtest run from 25 Mar 2026: it grew from 3,000 to 73,147 USD. Until then all five runs had been lost; on 24 Mar 2026 the chain stood at -15,000 USD.

The end result is a profit. But only because fresh money was added after every total loss and the last run happened to fall into the boom from March 2026. Anyone who had stopped after the second or third crash would simply have lost money. And nobody knows in advance which run will be the good one.

WHAT PROTECTIONS EXIST

A grid is not completely defenceless. On LOW and MEDIUM, the EA uses several brakes:

- Max trades: 14 on LOW, 18 on MEDIUM. The basket does not grow forever.
- Speed brake: if a basket reaches level 5 within 5 minutes, it is closed immediately. Moves that fast can be the start of a strong breakout.
- Time brake: if a basket has been open for more than 3 days, it is closed.
- Margin guard: no new order if the margin level would fall below 200% after the order. The basket must also be able to survive a 3% price gap. If the margin level drops below 100%, the EA closes the basket itself – before the broker does.

These brakes close baskets at a loss. That hurts, but at best it prevents a total loss. The HIGH setting deliberately has none of these brakes and no margin guard, and it can only be activated after explicit confirmation in the EA. It is built for maximum growth – with the full crash risk.

WHAT YOU SHOULD TAKE AWAY

1. Enough capital: as a rule of thumb, plan 1 to 1.5 times the gold price as capital per 0.01 lot. With gold at 4,000 USD, that is 4,000 to 6,000 USD. With less, the risk rises significantly. A cent account is an alternative for getting to know a grid EA.
2. Only money you don't need: never use money you need for rent, bills or savings.
3. Expect the crash: on aggressive settings a total loss is not the exception but part of the plan. Plan for it instead of hoping it won't happen.
4. Don't be dazzled by the win rate: always look at the maximum drawdown and at what happens when all levels are used up.

Not investment advice. Trading with leverage and grid systems can lead to a total loss. Backtests and past results are no guarantee of future performance.
Dennis Hoinkis
MQL5.커뮤니티에 등록됨