Dennis Hoinkis
Dennis Hoinkis
  • 信息
不
经验
6
产品
0
演示版
0
工作
1
信号
0
订阅者
Developer of the GoldGridBot Expert Advisor for MT5 在 Glomastco Ltd.
X
GoldGridBot – 适用于 MetaTrader 5 的黄金网格 EA

我们开发了 GoldGridBot,这是一款仅交易黄金(XAUUSD)的智能交易系统(EA),采用固定的、基于规则的网格机制。它不进行单一的大额方向性押注,而是以多个仓位组成的网格运作,一旦达到整体盈利目标,便将所有相关仓位一并平仓。

• EA 内置三种风险配置:LOW、MEDIUM 和 HIGH——在输入参数窗口中选择,无需加载 set 文件
• HIGH(我们实盘账户的设置)需要额外明确确认,否则 EA 将自动以 MEDIUM 交易
• VT Markets 真实资金实盘账户(美分账户),在 MyFxBook 上公开验证——包括回撤
• 提供免费演示版,可在策略测试器中进行回测
• 通过 MQL5 市场购买、激活和更新

资金经验法则:每 0.01 手对应当前金价的 1 至 1.5 倍(LOW/MEDIUM)。使用美分账户时,40–60 美元即可起步。

在我们网站注册的用户可免费获得更多参数集、回测与经纪商分析报告以及我们的新闻通讯——即使不购买也可获得。

风险提示:网格系统会有意持有亏损仓位。在强劲趋势中,回撤可能大幅上升,甚至导致全部本金亏损。过往业绩不代表未来收益。请仅使用您能够承受损失的资金进行交易。
好友 1
Dennis Hoinkis 已发布产品

SMC Zones 仅根据已收盘的K线在图表上标记 Fair Value Gaps (FVG) 和 Order Blocks (OB),默认只显示距离当前价格最近的未回补区域。 主要功能 基于三根已收盘K线识别 FVG,并可按 ATR 倍数和点数设置最小尺寸过滤。 Order blocks:形成 FVG 的那段走势之前最后一根反向K线。 不重绘:区域一旦出现便不会移动或消失,除非被价格回补。 可选显示更高时间周期的区域,以虚线边框绘制。 与图表背景色混合的透明填充、细边框,可选 50% 中线和简短标签。 三种回补规则(Full、Half、Touch);已回补区域可删除、淡化或保留。 新区域出现及价格进入可见区域时提醒,支持弹窗、推送通知或声音。 四个缓冲区提供最近的未回补看涨和看跌 FVG,可在EA中通过 iCustom 读取。 如何解读 绿色区域为看涨 FVG,红色为看跌 FVG,青色为看涨 order block,橙色为看跌 order

Dennis Hoinkis 已发布产品

GoldGridBot Starter 是一款适用于 MetaTrader 5 的 EA,以固定的保守参数在 XAUUSD 上执行网格策略。 主要功能 每笔订单固定 0.01 手,每个篮子最多 14 笔交易。 订单之间的网格间距为 150 点(1.50 USD)。 统一的篮子止盈:买入篮子在平均价格上方 100 点(1.00 USD),卖出篮子在平均价格下方 100 点。 在最多 71 根 M1 K线内出现至少 0.3% 的动量波动后入场,且仅顺应更高时间周期的趋势方向(M15 MA50 和 M5 MA20,缓冲 0.05%)。 速度制动:如果篮子在 5 分钟内达到第 5 层,将被平仓。 时间制动:持仓超过 3 天的篮子将被平仓。 保证金保护:如果下单后的保证金水平低于 200%,或篮子无法承受 3% 的价格跳空,则不开新单。保证金水平低于 100% 时,EA 会自行平掉篮子。 每笔订单前检查交易时段、保证金、止损水平和成交模式(filling mode)。 使用方法 将 EA 加载到 XAUUSD 图表上。需要对冲(hedging)账户,建议使用 VPS

Dennis Hoinkis 已发布产品

Gold Grid Risk Simulator 计算计划中的买入或卖出网格对账户的影响:回撤、保证金水平、追加保证金(margin call)价格、强制平仓(stop out)价格以及网格所需的资金。 主要功能 从起始价格开始逐级模拟网格:入场价、手数、累计手数、平均价格、篮子止盈(basket TP)、浮动盈亏、已用保证金、净值和保证金水平。 在网格层级之间精确求解 margin call 和 stop out 价格,并以价格单位和百分比显示与起始价格的距离。 当 stop out 在所有层级成交之前发生时给出警告,并显示可承受的最大不利波动和 stop out 时的亏损。 建议最低余额:使完整网格加上额外不利波动后仍高于 stop out 水平所需的余额。 情景表:针对 10、25、50 和 100 价格单位的不利波动,显示状态 OK、MARGIN CALL 或 STOPPED OUT。 紧凑模式(默认开启):层级表只显示第 1、5、10、14 级、最后一级以及首次低于 margin call 或 stop out 的行,使面板适合 1080p 图表。

Dennis Hoinkis 已发布产品

MTF Dashboard RSI ADX Volume 是主图窗口中的一个紧凑面板,可同时显示当前交易品种多个时间周期的 RSI、ADX 和相对 tick 成交量。 主要功能 每个启用的时间周期一行:默认为 M1、M5、M15、M30、H1、H4 和 D1。 列:TF、RSI、ADX、+DI、-DI、Trend 和 Vol %。 时间周期名称按方向着色:+DI 高于 -DI 且 RSI 高于 50 时为看涨,-DI 高于 +DI 且 RSI 低于 50 时为看跌,其余为中性。 Trend 列:ADX 高于阈值时显示“Strong Up”或“Strong Down”,否则显示“Range”。 相对成交量:当前形成中K线的 tick 成交量占此前已收盘K线平均值的百分比。 Bias 行统计看涨、看跌和中性的时间周期数量,并将整体情况标记为 Bullish、Bearish 或 Mixed。 通过定时器刷新,即使没有新的 tick,数值也保持最新。 如何解读 该面板用于概览,而不是信号生成器。当大多数行看涨且较高周期显示“Strong Up”时,市场处于单一方向的运动中。“Range”行与

Dennis Hoinkis 已发布产品

Volume Profile Sidebar 在图表一侧绘制水平的价格成交量直方图,并标出 Point of Control (POC) 和 Value Area。 主要功能 三种范围模式:可见范围、最近 N 根K线、当日 / 交易时段。 POC 行、Value Area 内的行(默认 70%)和区域外的行以不同颜色显示。 可选的 POC、Value Area High (VAH) 和 Value Area Low (VAL) 水平线及价格标签。 每根K线的成交量均匀分布在其最高价到最低价的范围内;有 M1 数据时使用 M1 数据,可在较高时间周期上得到更精细的分布。 默认使用 tick 成交量;在可用时也可使用真实成交量。 在可见范围模式下,分布图会随图表滚动和缩放自动更新。 直方图可放在右侧或左侧,可选放在图表右移区域内,并可绘制在K线后方或前方。 如何解读 每一行显示所选范围内在该价格区间成交的量。较长的行是高成交量节点,市场在此活跃时间较长;较短的行是低成交量节点,价格快速穿过。POC 是成交量最高的行。Value Area 从 POC

Dennis Hoinkis 已发布产品

999.00 USD

GoldGridBot is a grid Expert Advisor for XAUUSD (gold) on MetaTrader 5. It waits for a strong momentum move, enters in the direction of the higher-timeframe trend and manages all positions as one basket with a common take profit. How it works Trend filter on M15 and M5 (moving averages) Entry after a momentum reversal on M1 Grid re-entries at a fixed distance when the price moves against the basket One take profit for the whole basket, measured from the average entry price Speed brake and time

Dennis Hoinkis
Dennis Hoinkis
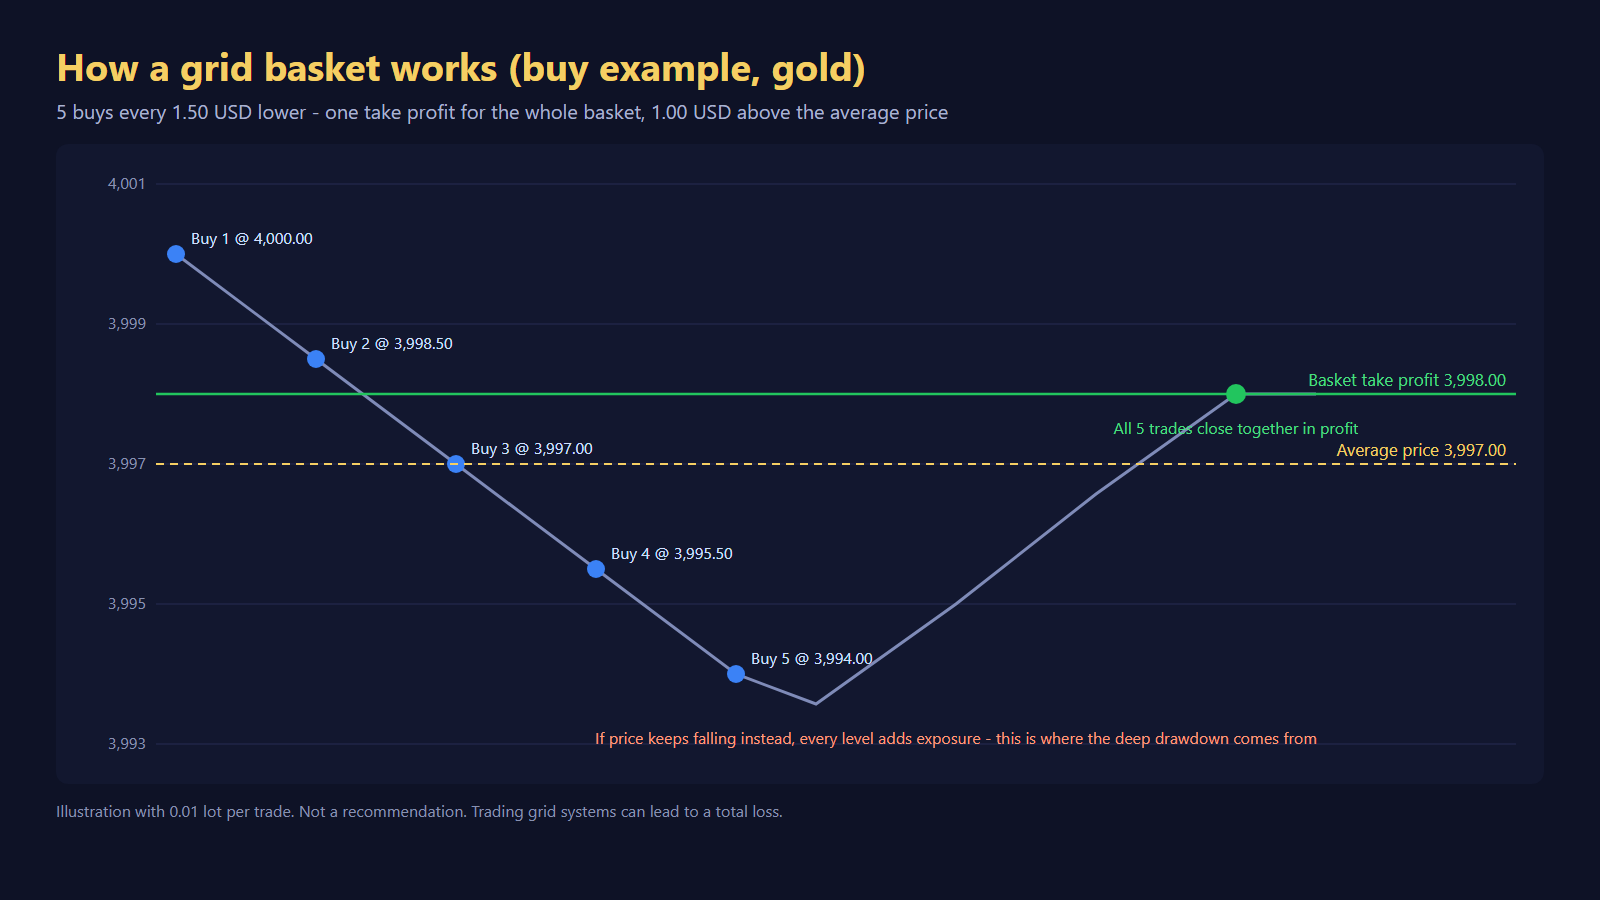
Worked example from my article "How a Gold Grid Works – and Why It Is Dangerous" (post below): five buys every 1.50 USD lower, one take profit for the whole basket 1.00 USD above the average price. A pullback to 3,998.00 closes all five trades together in profit. If price keeps falling instead, every level adds exposure – that is where the deep drawdown of a grid comes from.

Not investment advice. Trading grid systems can lead to a total loss.
Dennis Hoinkis
Dennis Hoinkis
How a Gold Grid Works – and Why It Is Dangerous

Grid Expert Advisors for gold are among the most popular bots on MetaTrader 5. Their equity curves often look impressive: up month after month, with a win rate well above 70%. That is exactly what makes them dangerous if you don't understand what is happening under the hood. In this article I explain step by step how a gold grid works, why it wins so often and why it can still wipe out an account at some point. As an example I use the logic of our own grid EA and its three settings (LOW, MEDIUM, HIGH), with real backtest numbers – including the bad ones.

WHAT IS A GRID EA?

A grid EA does not just open one position. When needed, it builds a whole basket of positions. If price moves against the first trade, the EA adds more trades at fixed distances. All positions belong together and are closed together. So the EA is not trying to get every single trade right. It is betting that price will eventually move back a little.

THE ENTRY: MOMENTUM AND TREND FILTER

Before a basket even starts, the market has to meet two conditions. The EA in this example trades XAUUSD (gold against the US dollar) only.

- Trend filter: a moving average (MA) 50 on M15 and an MA 20 on M5, plus a buffer of 0.05%. The EA only trades in the direction of the trend.
- Momentum: price must have moved at least 0.3% within no more than 71 M1 candles. Only then does the EA open the first trade.
- Pauses: after an entry there is a pause of 10 candles, after a closed basket it is 17 candles.

So the entry is not random. But even the best filter cannot predict whether price will keep going or turn around afterwards. And that is where the grid begins.

ADDING TRADES AT FIXED DISTANCES

If price moves against the basket, the EA adds another trade – every 150 points (1.50 USD in the gold price) on the LOW and MEDIUM settings, every 200 points on the HIGH setting. The number of levels is limited: at most 14 trades on LOW and at most 18 on MEDIUM and HIGH.

A WORKED EXAMPLE (see first image)

There is only one take profit for the entire basket: 100 points (1.00 USD) above the average price of all positions (below it for a sell basket). Let's say the EA buys gold at 4,000.00 USD with the same lot size on every level, and price falls:

Level - Buy price - Average price - Basket take profit
1 - 4,000.00 - 4,000.00 - 4,001.00
2 - 3,998.50 - 3,999.25 - 4,000.25
3 - 3,997.00 - 3,998.50 - 3,999.50
4 - 3,995.50 - 3,997.75 - 3,998.75
5 - 3,994.00 - 3,997.00 - 3,998.00

With every level the average price drops, and so does the target. After five levels price is at 3,994.00. For the whole basket to close in profit, gold only has to get back to 3,998.00 – a rise of 4 USD. The first trade at 4,000.00 even closes with a small loss, but the lower buys more than make up for it. The basket as a whole wins.

WHY THE WIN RATE IS SO HIGH

Gold moves constantly. A pullback of a few dollars almost always comes at some point. That is why most baskets close in profit. In our backtests (MT5 Strategy Tester, "every tick", XAUUSD, 01 Jan 2024 to 31 Oct 2026, starting with 3,000 USD, fixed 0.01 lot) it looks like this:

Setting - Final balance (backtest) - Max. equity drawdown - Profit factor - Trades / won
LOW - 17,767 USD - 52% - 1.54 - 13,488 / 77%
MEDIUM - 23,948 USD - 25% - 1.88 - 13,825 / 76%

76 to 77% winning trades sounds like an almost perfect system. But look at the column next to it: a maximum drawdown of 25% and 52% in the backtest. The high win rate is not a sign of safety. It is a consequence of how a grid is built.

WHY THE DRAWDOWN IS STRUCTURALLY HIGH

A grid does not take losses, it sits them out. Instead of closing a wrong trade with a stop loss, it adds more and waits. This has two consequences:

- Exposure grows with every level. At level 1 one position is open, at level 10 there are ten. Every further dollar against the basket now costs ten times as much.
- Profits are small, open losses can get large. A basket only earns 1 USD above its average price. A basket stuck deep in the red, on the other hand, puts heavy pressure on the account for as long as it stays open.

So the drawdown is not an accident, it is built in. Many small wins are paid for with rare but large hits.

WHEN ALL LEVELS ARE USED UP

It gets dangerous when price does not turn. On MEDIUM there are 17 gaps of 1.50 USD between the first and the 18th trade, which is 25.50 USD. On HIGH it is 17 x 2.00 = 34 USD. For gold, that is not an extreme move. Once the maximum number of trades is reached, the EA stops adding. If price keeps running, every open position loses with every dollar at the same time. The drawdown gets very deep. When the margin is no longer enough, the margin call comes, and finally the broker's stop-out. On aggressive settings that means losing the entire account.

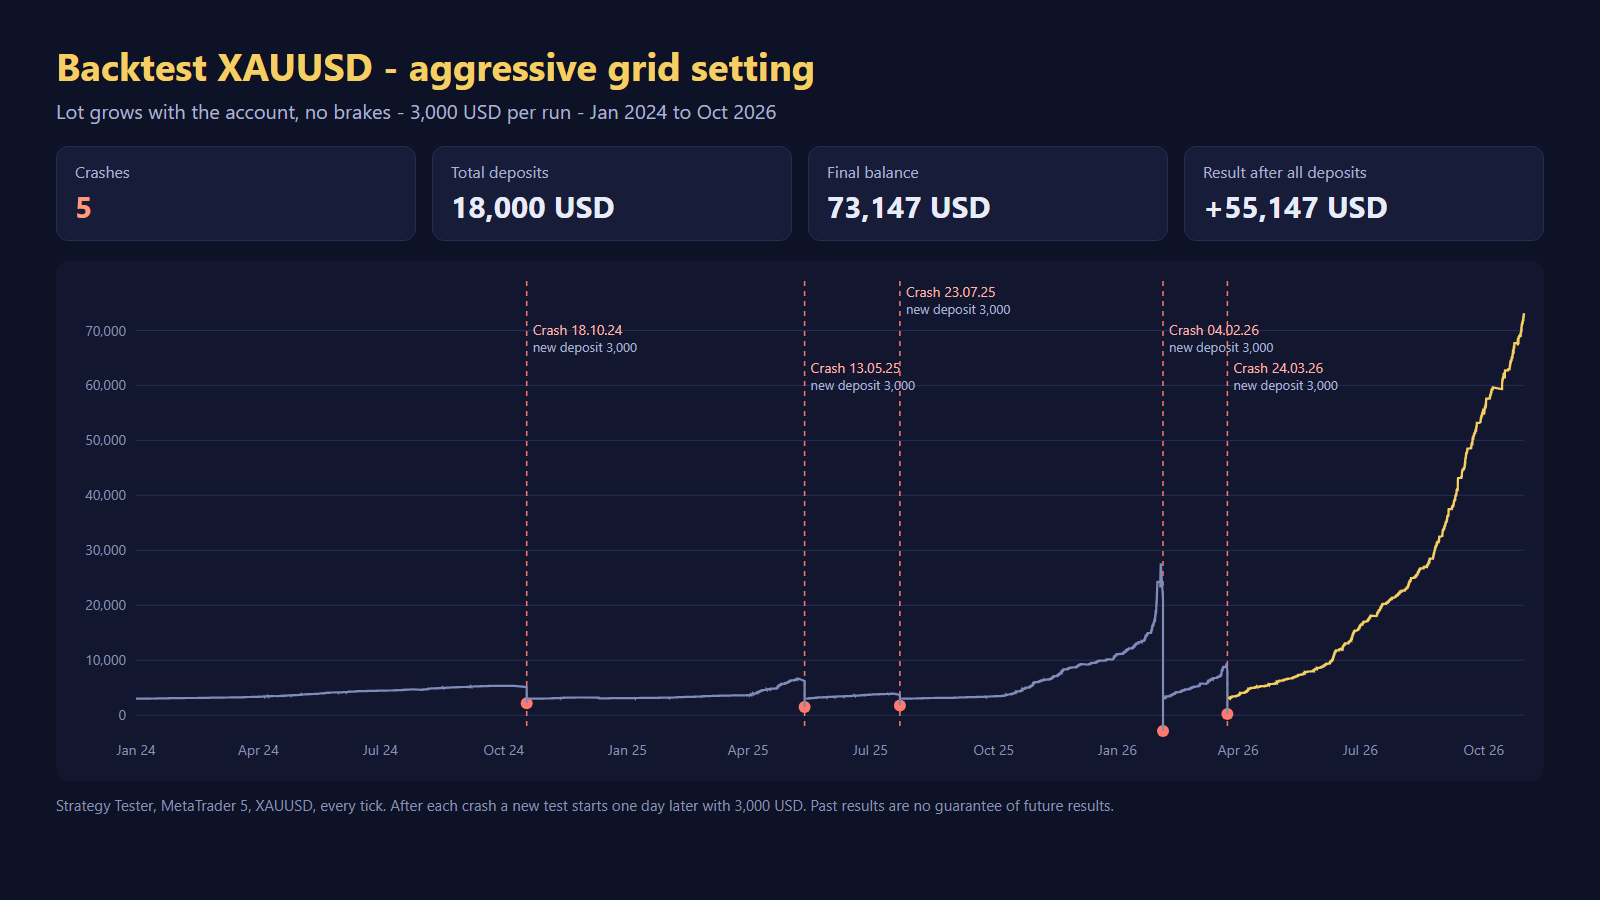
EXAMPLE: THE HIGH SETTING AS A BACKTEST CHAIN (see second image)

How often this can happen is shown by our backtest of the HIGH setting. HIGH grows the lot size with the account (11% risk per grid level) and has no brakes. We ran the backtest as a chain: after every crash, a new backtest starts one day later with 3,000 USD again.

- 5 crashes in the backtest between 2024 and 2026: 18 Oct 2024, 13 May 2025, 23 Jul 2025, 04 Feb 2026 and 24 Mar 2026.
- Deposited: 18,000 USD (six starts of 3,000 USD each).
- Final balance: 73,147 USD, a net result of +55,147 USD.
- The entire gain comes from the last backtest run from 25 Mar 2026: it grew from 3,000 to 73,147 USD. Until then all five runs had been lost; on 24 Mar 2026 the chain stood at -15,000 USD.

The end result is a profit. But only because fresh money was added after every total loss and the last run happened to fall into the boom from March 2026. Anyone who had stopped after the second or third crash would simply have lost money. And nobody knows in advance which run will be the good one.

WHAT PROTECTIONS EXIST

A grid is not completely defenceless. On LOW and MEDIUM, the EA uses several brakes:

- Max trades: 14 on LOW, 18 on MEDIUM. The basket does not grow forever.
- Speed brake: if a basket reaches level 5 within 5 minutes, it is closed immediately. Moves that fast can be the start of a strong breakout.
- Time brake: if a basket has been open for more than 3 days, it is closed.
- Margin guard: no new order if the margin level would fall below 200% after the order. The basket must also be able to survive a 3% price gap. If the margin level drops below 100%, the EA closes the basket itself – before the broker does.

These brakes close baskets at a loss. That hurts, but at best it prevents a total loss. The HIGH setting deliberately has none of these brakes and no margin guard, and it can only be activated after explicit confirmation in the EA. It is built for maximum growth – with the full crash risk.

WHAT YOU SHOULD TAKE AWAY

1. Enough capital: as a rule of thumb, plan 1 to 1.5 times the gold price as capital per 0.01 lot. With gold at 4,000 USD, that is 4,000 to 6,000 USD. With less, the risk rises significantly. A cent account is an alternative for getting to know a grid EA.
2. Only money you don't need: never use money you need for rent, bills or savings.
3. Expect the crash: on aggressive settings a total loss is not the exception but part of the plan. Plan for it instead of hoping it won't happen.
4. Don't be dazzled by the win rate: always look at the maximum drawdown and at what happens when all levels are used up.

Not investment advice. Trading with leverage and grid systems can lead to a total loss. Backtests and past results are no guarantee of future performance.
Dennis Hoinkis
已在MQL5.community注册