Evren Caglar / ニュースフィード
- 情報
|
2 年
経験
|
2
製品
|
451
デモバージョン
|
|
0
ジョブ
|
1
シグナル
|
0
購読者
|
私のトレード歴は、高校生だった 1997 年まで遡ります。長年にわたり、テクノロジーとツールのアクセシビリティは大幅に向上しましたが、トレード哲学、つまり勝利への姿勢はほとんど変わっていません。
私は長年手動でトレードしてきましたが、2013 年に計算金融の博士号を取得しているので、アルゴリズム トレードについてまったく知らなかったわけではありません。
手動トレードは、この世で最も退屈な仕事の 1 つです。適切なトレード設定をキャッチするために、何時間も画面の前で待つ必要があるからです。その後、自分には自由時間がたくさんあることに気づきました...
「なぜトレード設定をコーディングしないのか」と考えました。MQL5 での私の登場は、この単純なアイデアから始まります。
私は、手動トレードの行動特性を模倣する数学モデルの開発を開始しました。そのため、私のページでそれらをご覧いただけます。
試してみてください。きっと素晴らしいと感じられるでしょう。
私のプロフィールをご覧いただき、ありがとうございます。近いうちにまたお話しできると思います。
どうぞよろしくお願いいたします。
Evren Caglar
is a multi-timeframe visual matrix that tracks the relative linear progression (log-return strength) of the eight major currencies — EUR, GBP, AUD, NZD, USD, CAD, CHF, and JPY — across selected timeframes in a single responsive panel. Motive Traders often struggle to quickly see which currencies are gaining or losing strength relative to one another across multiple timeframes. This indicator condenses that information into color-coded progression lines so you can immediately identify strong
designed to help traders monitor the long and short swap rates of available trading instruments through a clear, organized on-chart table. Its primary purpose is to make overnight financing costs and potential swap credits easier to observe across multiple symbols without repeatedly opening individual instrument specifications. By presenting swap information in a centralized display, the application helps traders incorporate holding costs into their market analysis and trade planning. Key
UPDATED BOTH MT5 AND MT4 of Eye of Providence:
Why free? I'm from a country known as the "Land of the free and the home of the brave."
https://www.mql5.com/en/market/product/200617?source=Site+Profile+Seller
https://www.mql5.com/en/market/product/153676?source=Site+Profile+Seller
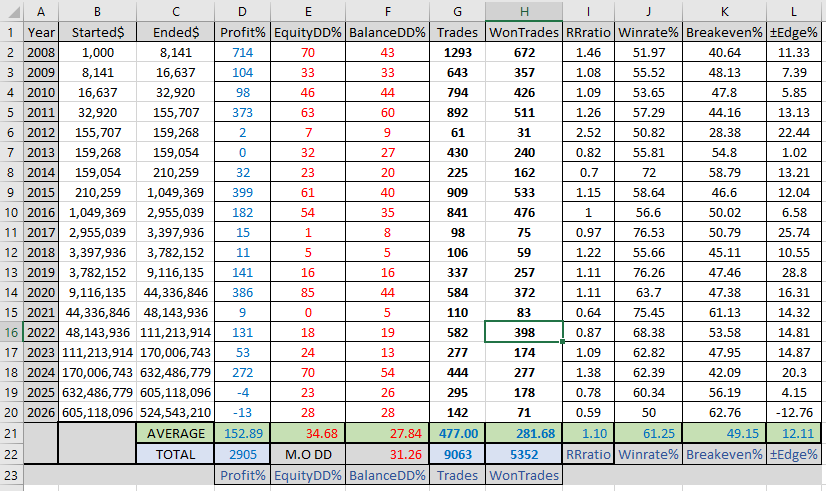
In the 2008–2026 results, the overall Win Rate is 61.25% on a Risk Reward Ratio 1.10, which is +12.11 percentage points higher than breakeven
Fibonacci Trading EA – Scalping Strategy with Fibonacci Envelopes Fibonacci Trading EA is an automated trading robot based on Fibonacci Envelopes, combining technical filters with configurable risk management features. It includes daily and maximum loss protection to help traders manage risk when trading under Prop Firm rules. Limited-Time Launch Price: $50 Download the recommended set files here: [Click here] Strategy Overview The EA calculates Fibonacci Envelopes around a moving average using
KT Support Resistance EA trades bounces only from the support and resistance levels where price has reversed its direction many times in the past. Every level carries a Reversal Chance: out of all the times price reached that level, the share of times it reversed instead of breaking through. The EA trades a bounce only when the Reversal Chance is high. Each trade opens with a stop loss beyond the zone and a take profit at the next opposing level. Five tested settings built in Choose JP225 M30
https://www.mql5.com/ru/market/product/193863?source=Site +Market+MT5+Expert+Rating006
KT Ichimoku Cross EA trades one complete Ichimoku system for you: the Tenkan-sen and Kijun-sen cross, confirmed by the cloud, with a stop loss and a take profit on every trade from the moment it opens. No strategy menu and no guesswork. It installs with the exact settings that were tested on five years of USDJPY history. Tested on five years of USDJPY The default settings were tested on five years of USDJPY on the 1 hour chart in one continuous run, at 1% risk per trade, with the broker's
This indicator builds a live correlation matrix from the symbols currently selected in Market Watch . It calculates Pearson correlation on simple returns over a user-defined lookback and displays the results in a clean, auto-sized grid. Positive correlations appear in green, negative in red, and near-zero values stay neutral. An optional automatic timeframe scanner cycles through only the timeframes you enable (M1, M5, M15, M30, H1, H4, D1, W1, MN1), updating the entire matrix at a set interval