Philani Mthembu
|
2 年
経験
|
5
製品
|
68
デモバージョン
|
|
0
ジョブ
|
0
シグナル
|
0
購読者
|
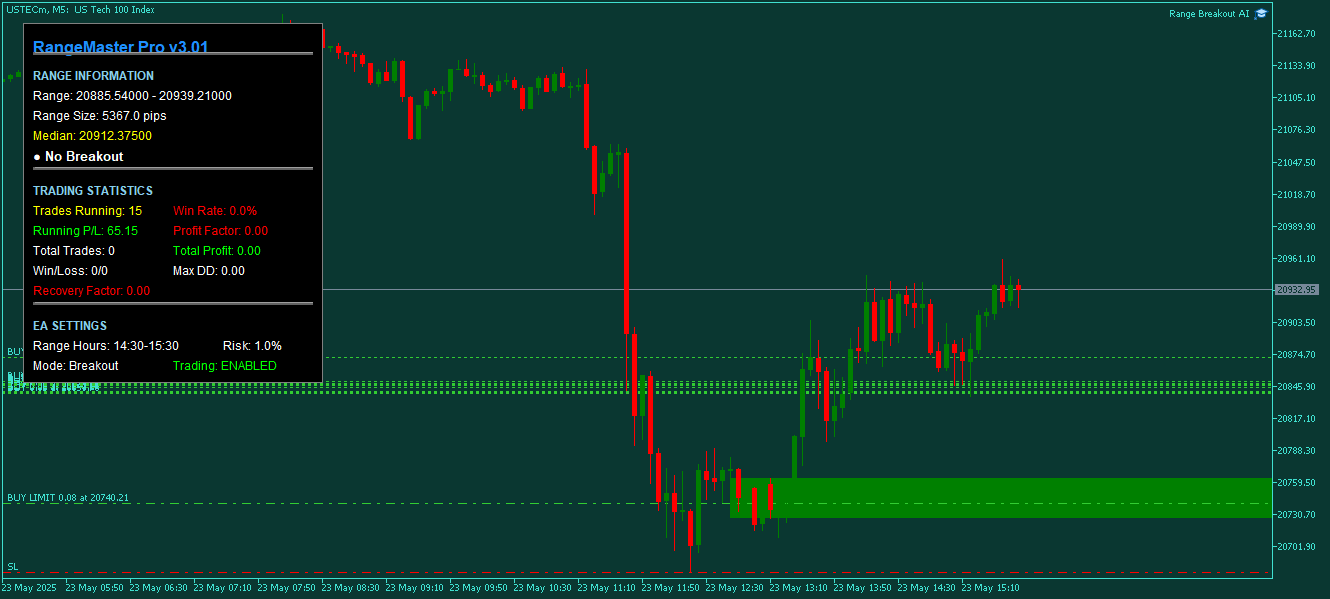
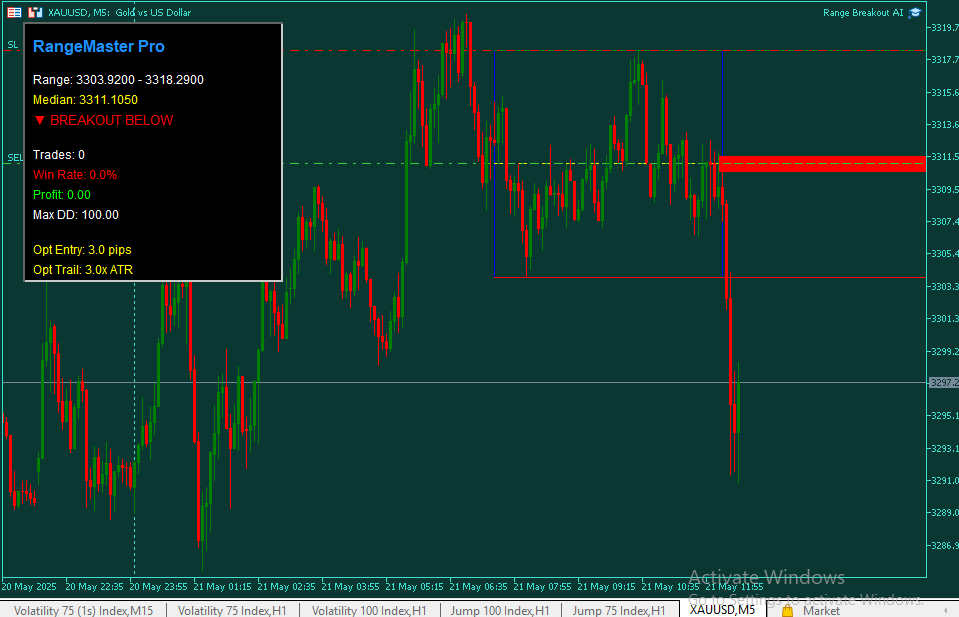
Trader, developer with 2 years experience.