Philani Mthembu
|
3 年
经验
|
5
产品
|
69
演示版
|
|
0
工作
|
0
信号
|
0
订阅者
|
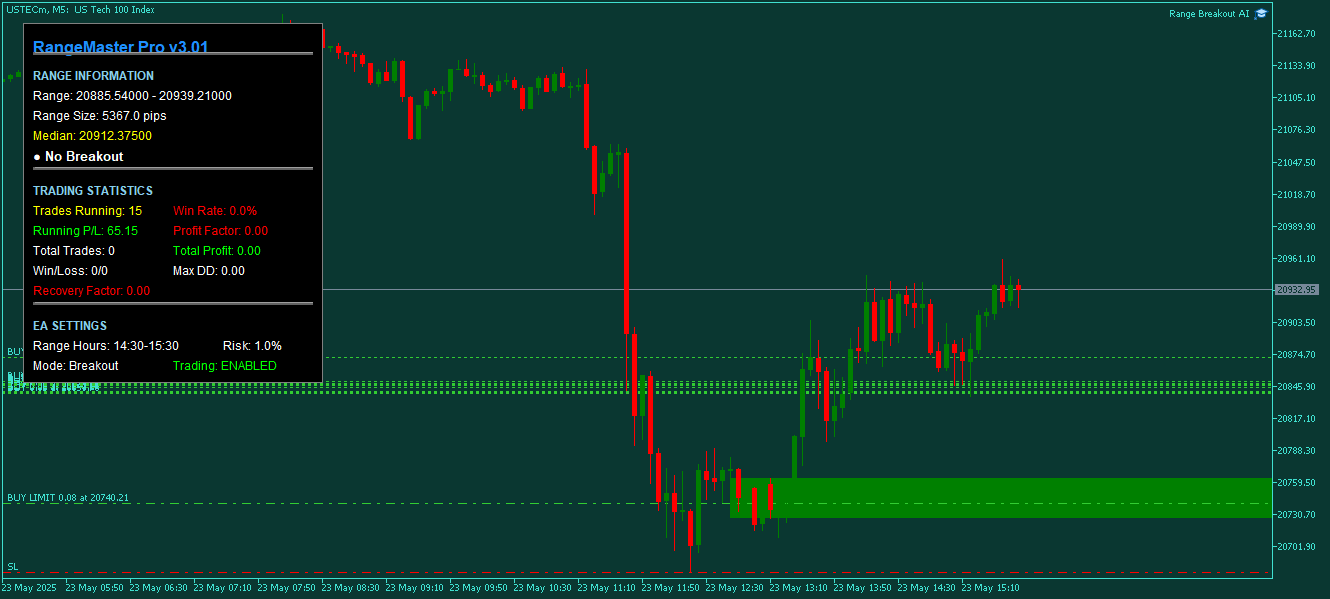
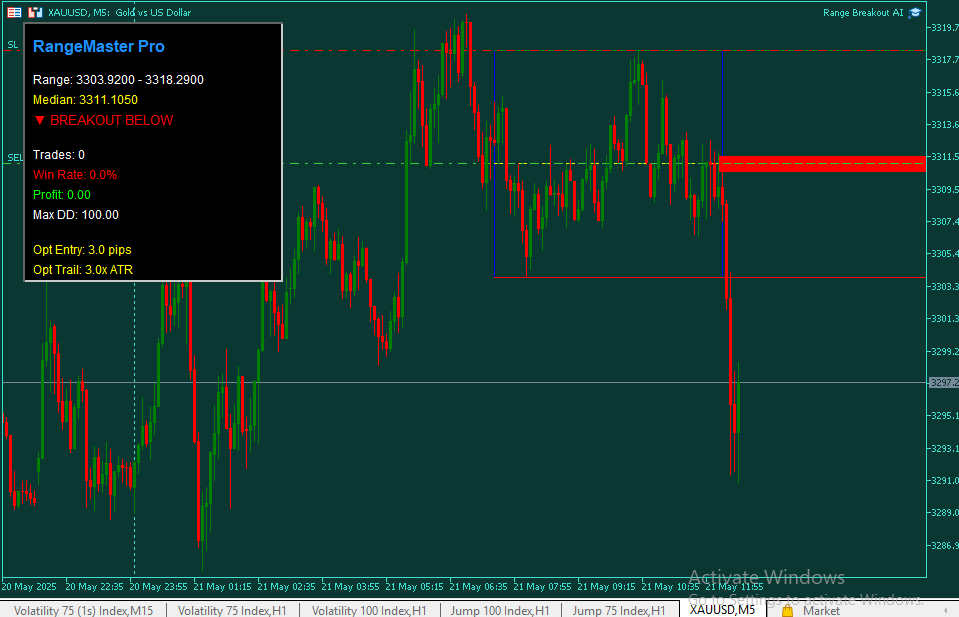
Trader, developer with 2 years experience.