ZZA Super Trade Assistant
- インディケータ
- Onyekachi Franklin Agbo
- バージョン: 1.1
- アクティベーション: 10
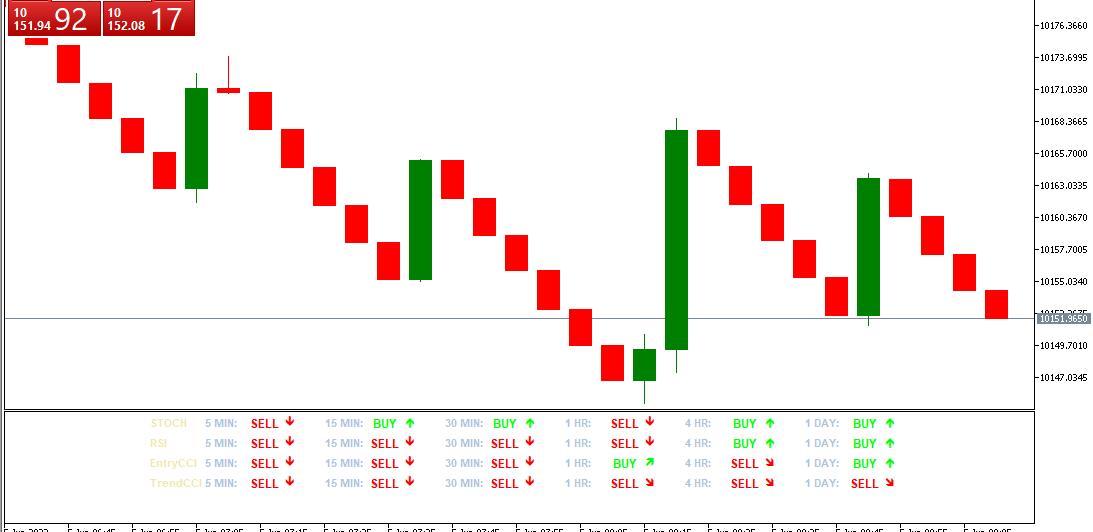
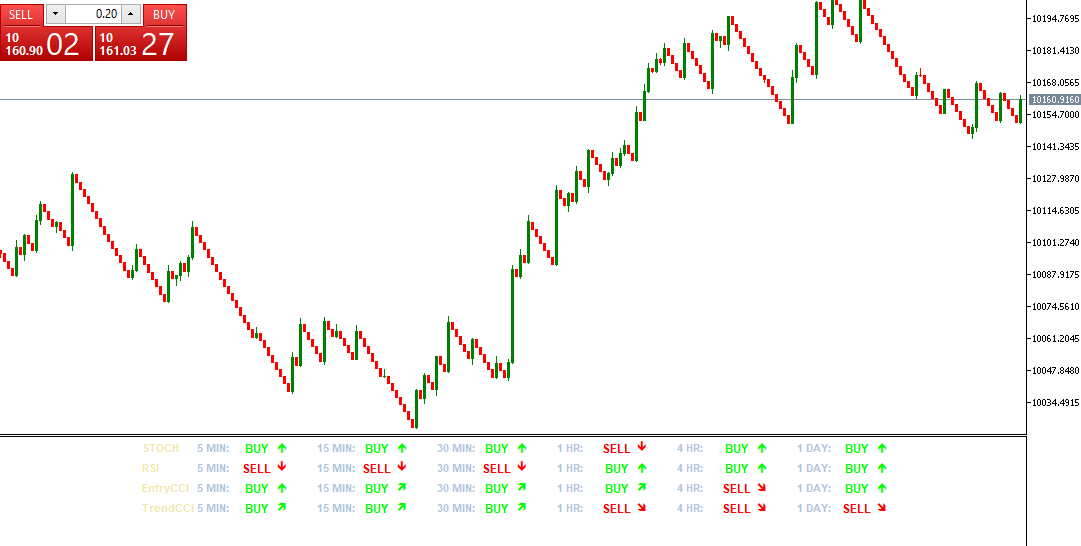
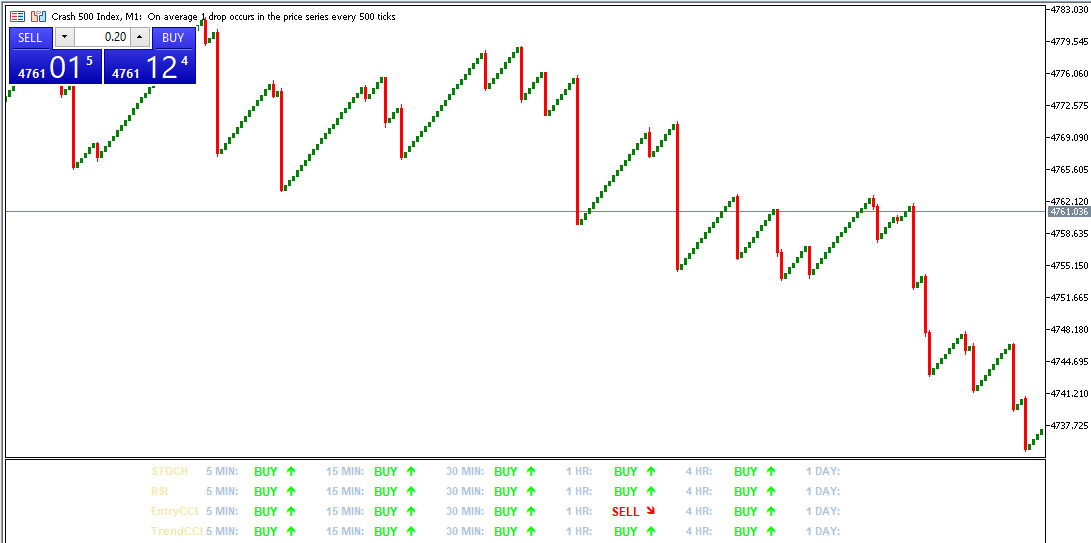
ZZA TRADE ASSISTANT
This ZAA trade assistant indicator is very powerful. Here you can use this as your trading assistant . So while applying this use money management . This indicator can be use on 5 minutes timeframe, 15 minutes timeframe, 1 hour minutes timeframe and above . Try practice this on your demo account before using on real account . This indicator should apply on meta trader 5 .