Trading Session ICT KillZone
- インディケータ
- Han Qin Lin
- バージョン: 6.1
- アップデート済み: 13 12月 2023
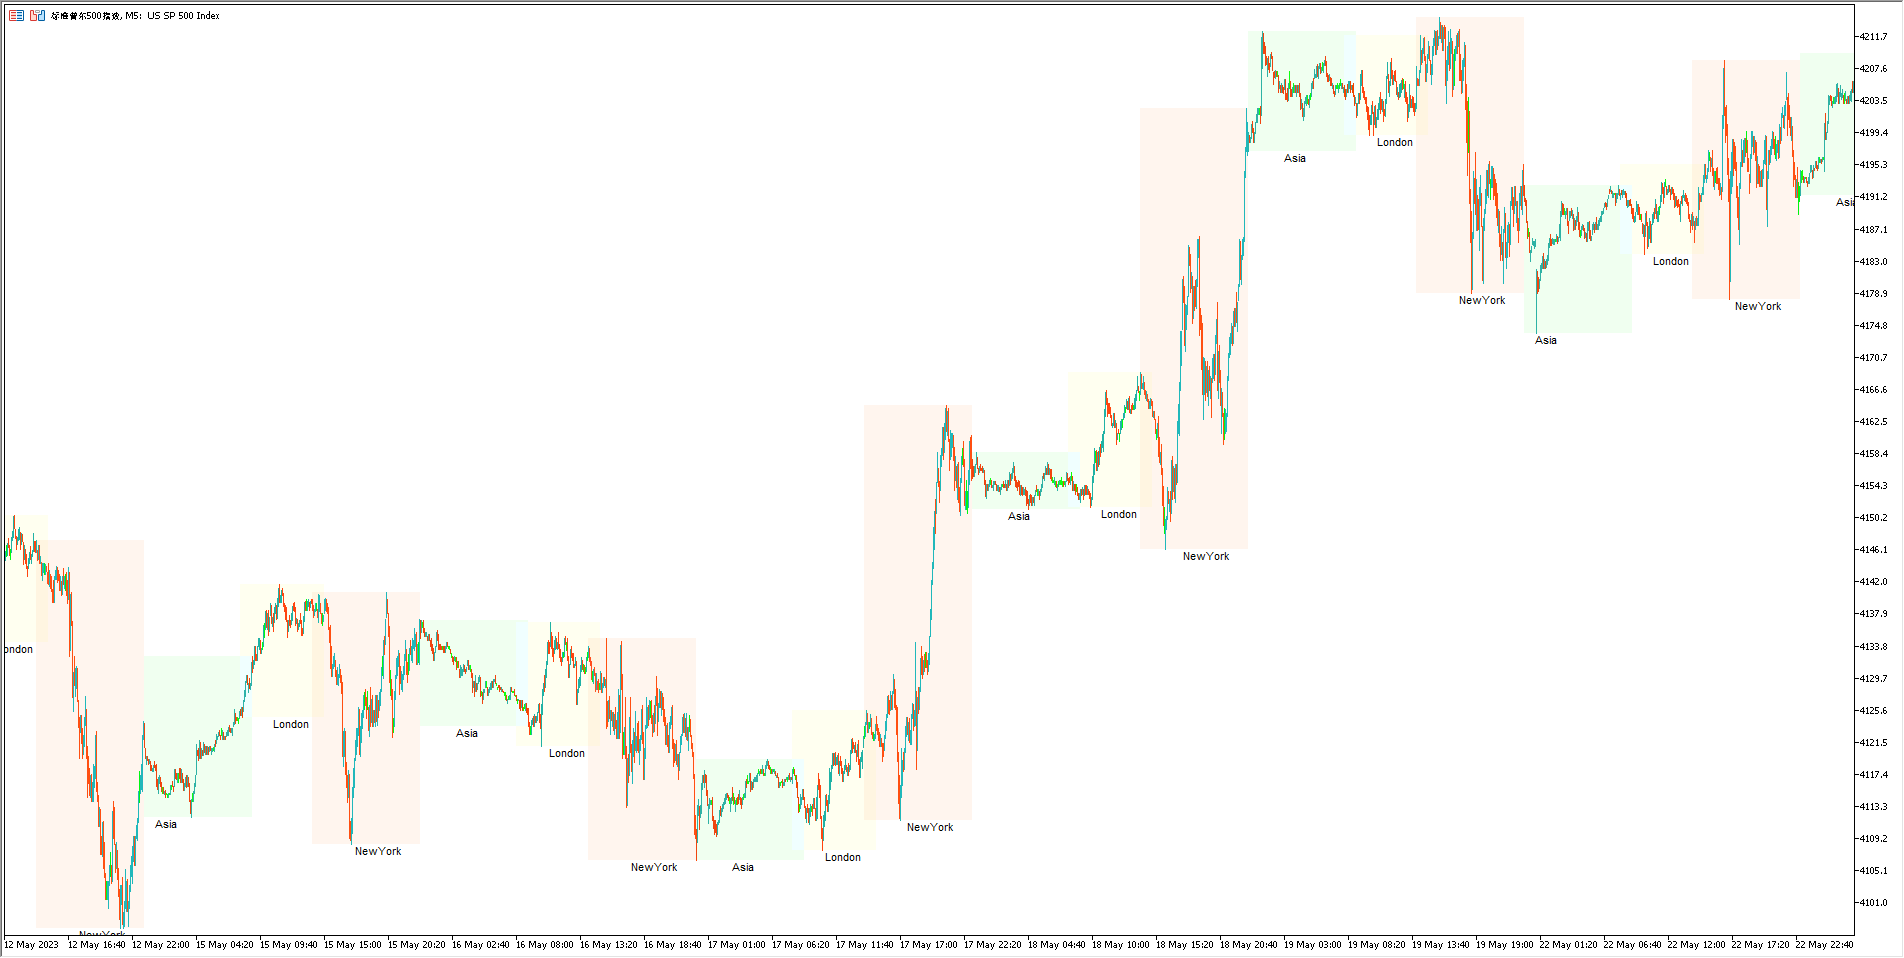
トレーダーは、異なる市場活動時間や取引量が通貨ペアのボラティリティや取引機会に直接影響するため、取引時間帯の影響に注意を払う必要があります。市場状況を包括的に把握し、より良い取引戦略を立てるために、当社では取引セッションインジケータを開発しました。
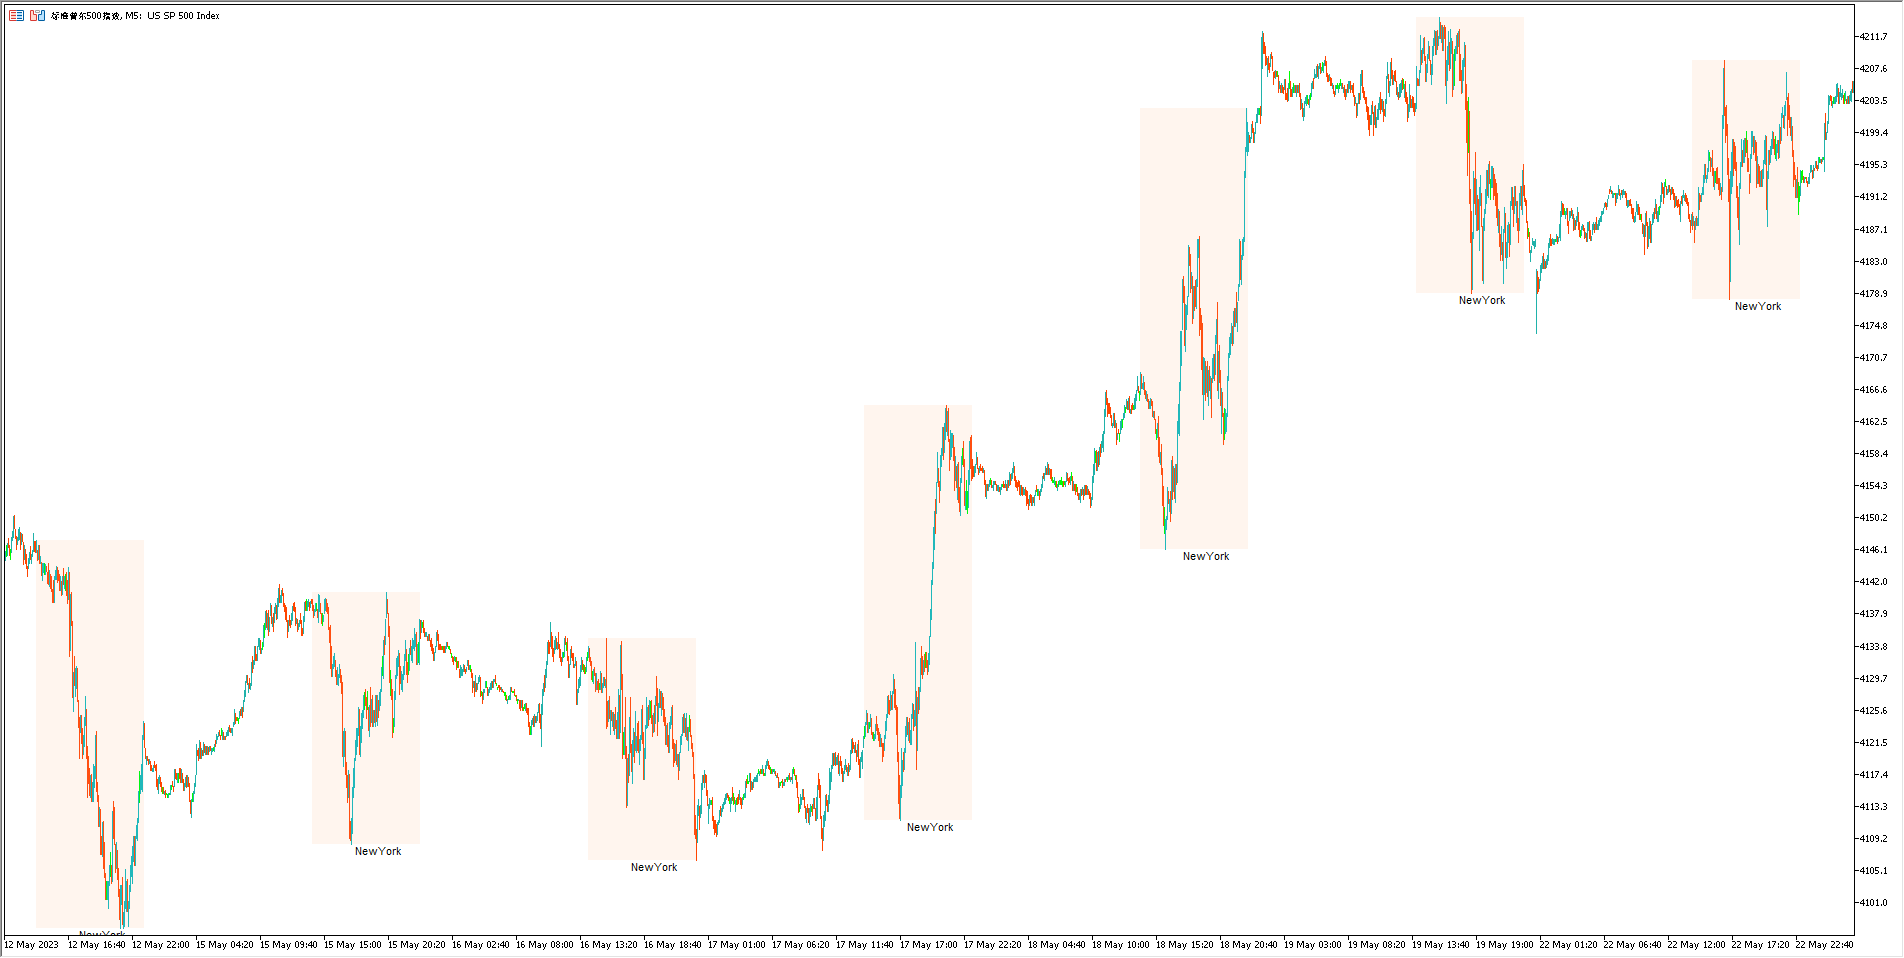
このインジケータは、アジア、ロンドン、ニューヨーク市場の取引時間を表示します。ユーザーは、より便利な使用のために異なる取引時間帯を表示または非表示に設定できます。さらに、設定に基づいて取引セッションの名前を表示または非表示にすることができ、最大表示数を制限することもできます。
実際の使用プロセスは非常に簡単です。インジケータを購入したら、MetaTrader 5プラットフォームのインジケータフォルダにインジケータファイルをコピーし、MetaTrader 5プラットフォームで適用したいチャートを開き、インジケータリストからインジケータを選択し、チャートにドラッグアンドドロップします。
インジケータが正常に適用されると、アジア、ロンドン、ニューヨーク市場の取引時間が表示される表が表示されます。個人設定に基づいて異なる取引時間帯を表示または非表示にすることができ、市場状況をより良く理解することができます。同時に、個人設定に基づいて取引セッションの名前を表示または非表示にすることもでき、最大表示数を制限することができます。
インジケータには、必要に応じて複数のカスタマイズ可能なオプションが用意されています。複数の取引時間帯を表すために異なる色を選択したり、取引セッションの名前を表示するかどうかを選択したりすることができます。さらに、最大表示数を制限して、チャートをより管理しやすくすることもできます。
したがって、この取引セッションインジケータは、トレーダーが市場状況を包括的に把握し、より良い取引戦略を立てるのに役立つ非常に実用的なツールです。もしトレーダーであれば、このインジケータを試して、取引戦略に適用して、より良い取引結果を実現することを強くお勧めします。
この指標に興味があれば、私が提供するより高度な指標に興味を持つかもしれません。
MT5 Version: Click here.
MT4 Version: Click here.


good job