RSI Robex
- インディケータ
- Robert Sadamon
- バージョン: 1.0
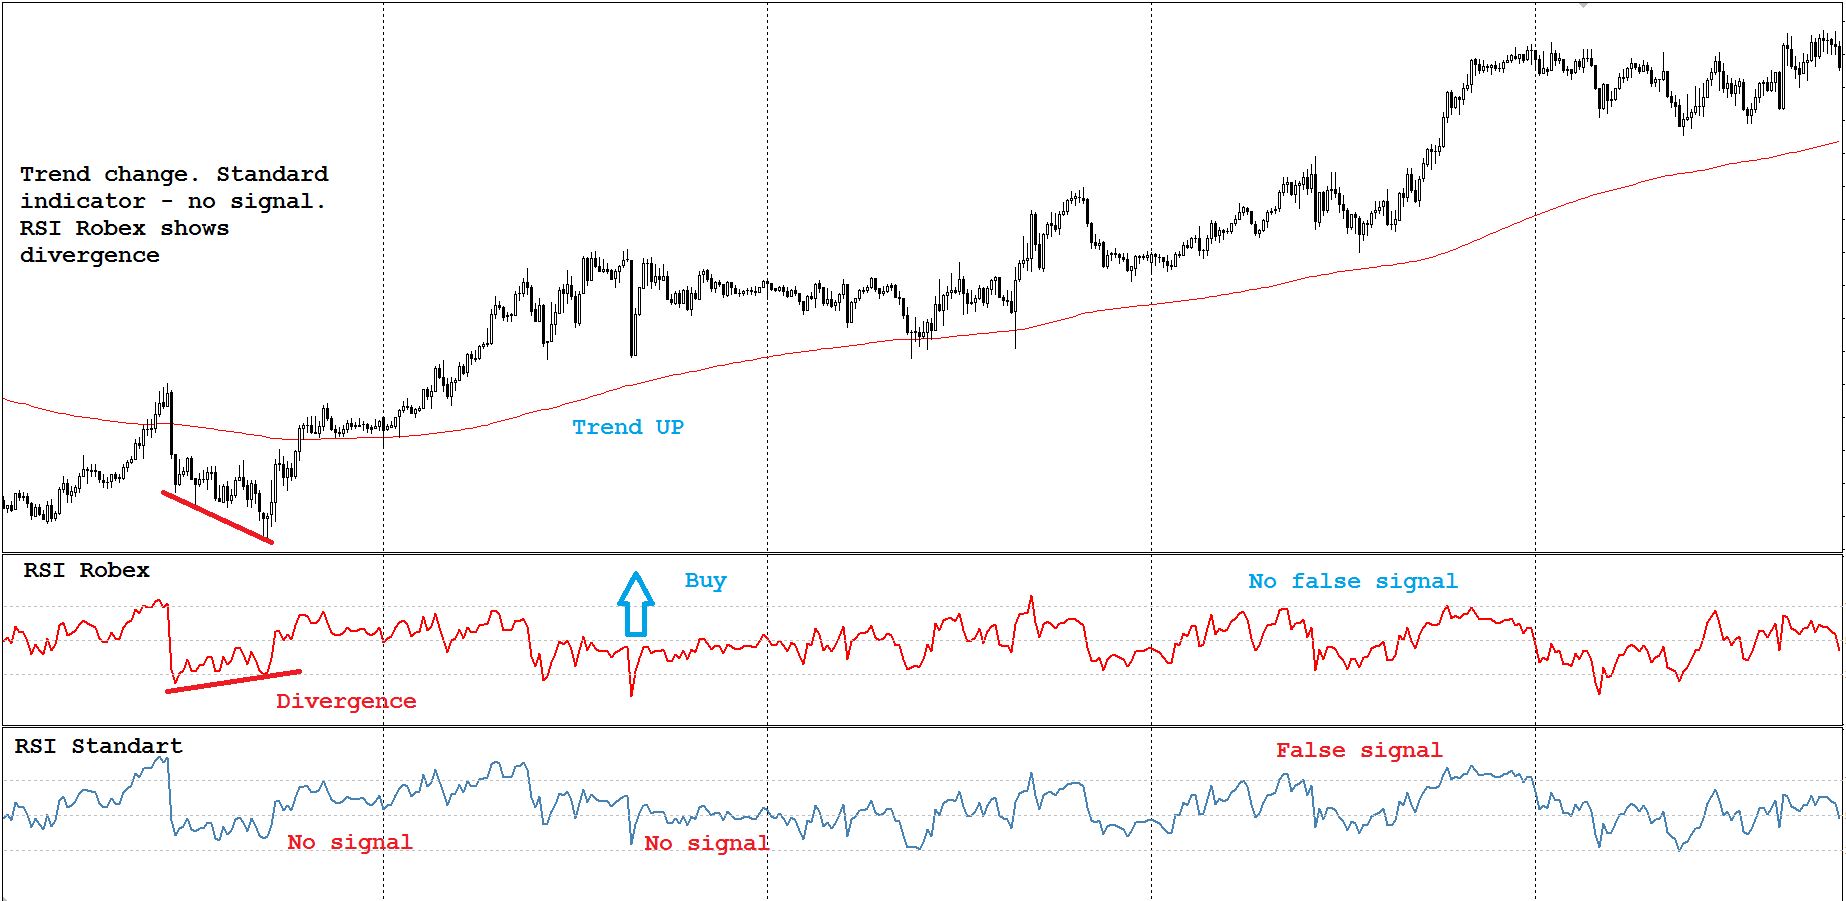
The standard RSI indicator is very helpful in identifying overbought or oversold areas during a flat, but gives a lot of false signals when the market is trending. For example: during an uptrend, the standard indicator often enters the "oversold" zone and extremely rarely (most often, when the trend has already ended) enters the "overbought" zone. This indicator takes into account the trend movement and, with the selected settings, can enter the zone opposite to the trend direction, giving a signal when the price rolls back. This indicator can be a good helper, both during a flat and during a trend.