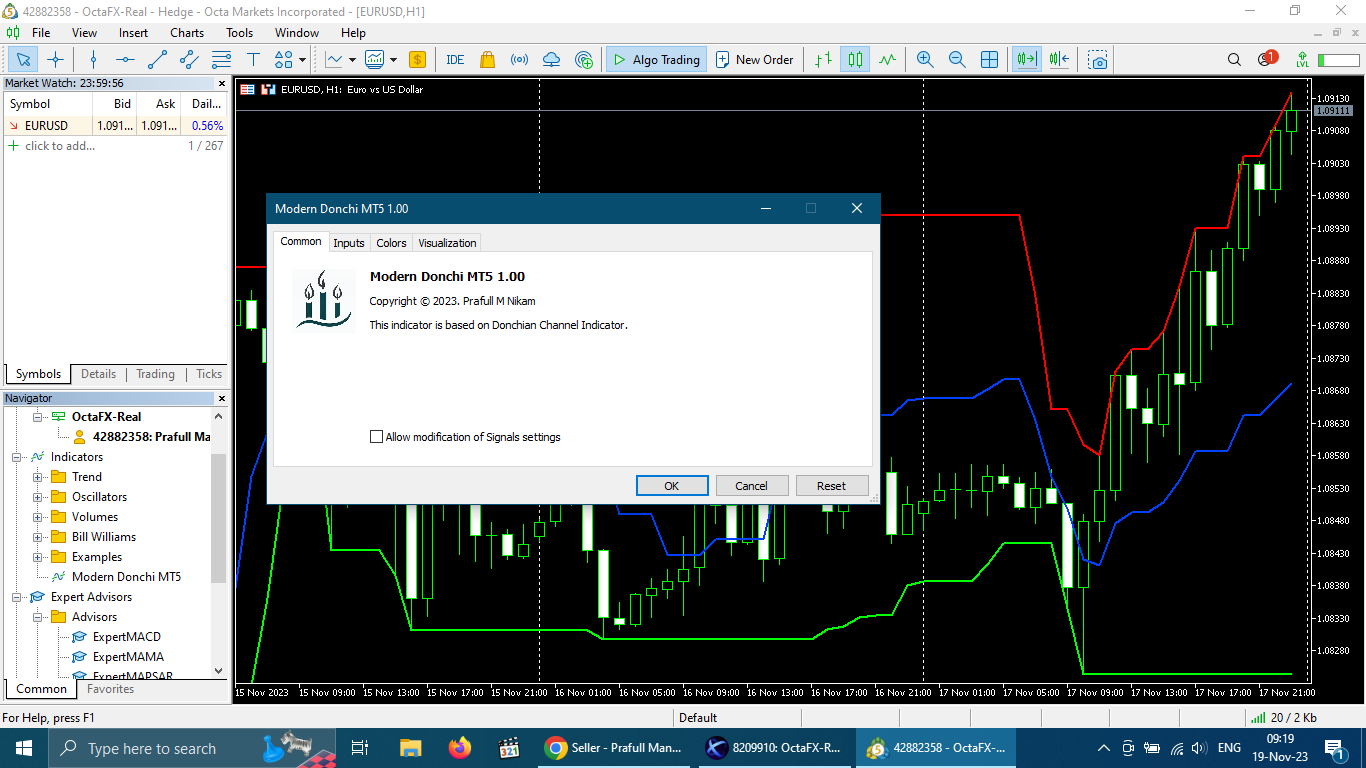
Modern Donchi MT5
- インディケータ
- Prafull Manohar Nikam
- バージョン: 1.0
The indicator is based on the concept of price channels, which are formed by plotting the highest high and lowest low prices over a specified period of time.
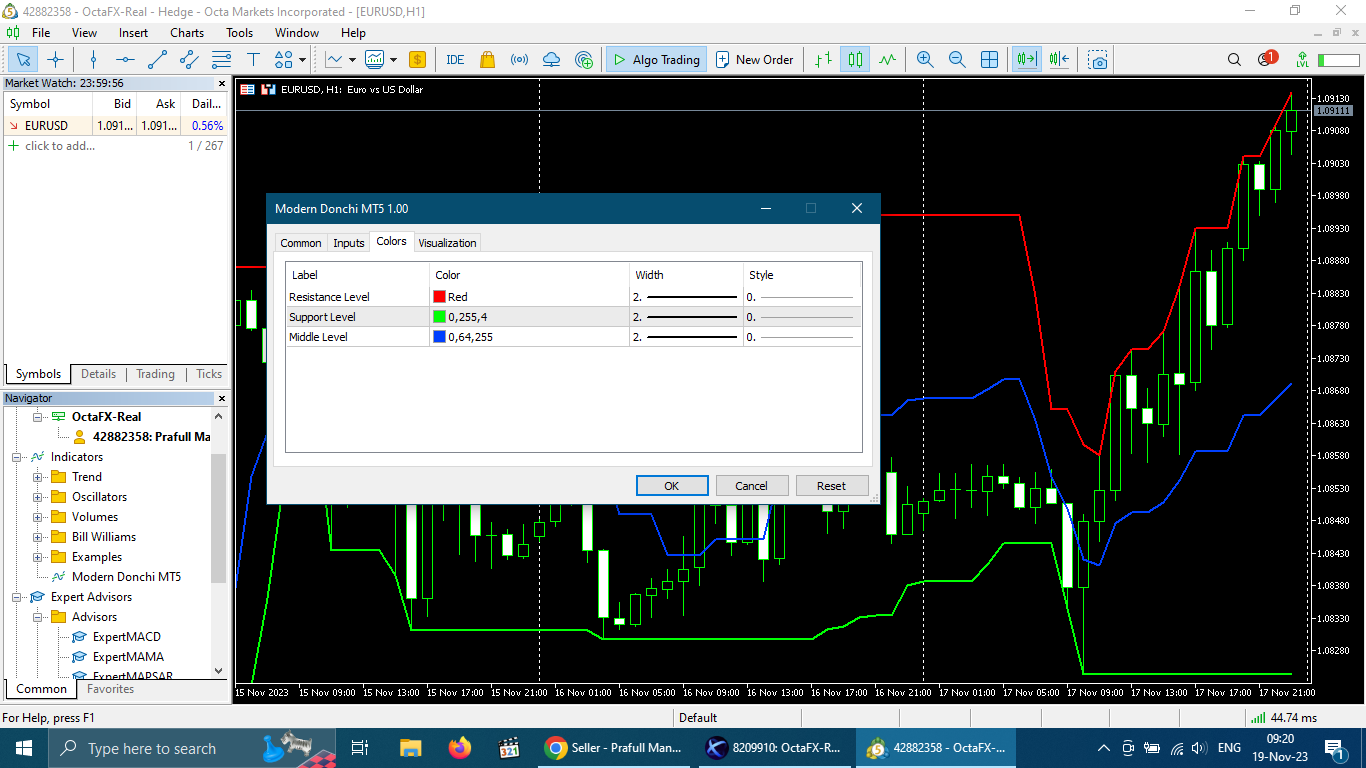
The Donchian Channel Indicator consists of three lines: an upper channel line, a lower channel line, and a middle channel line. The upper channel line represents the highest high over a specified period, while the lower channel line represents the lowest low. The middle channel line is the average of the two and can be used as a reference for determining whether the price is trending upwards or downwards.
Traders can use the Donchian Channel Indicator to identify trends, support and resistance levels, and potential breakouts. When the price breaks above the upper channel line, it is considered a bullish signal, while a break below the lower channel line is a bearish signal. The indicator can be adjusted to different timeframes depending on the trader's preference and trading style.
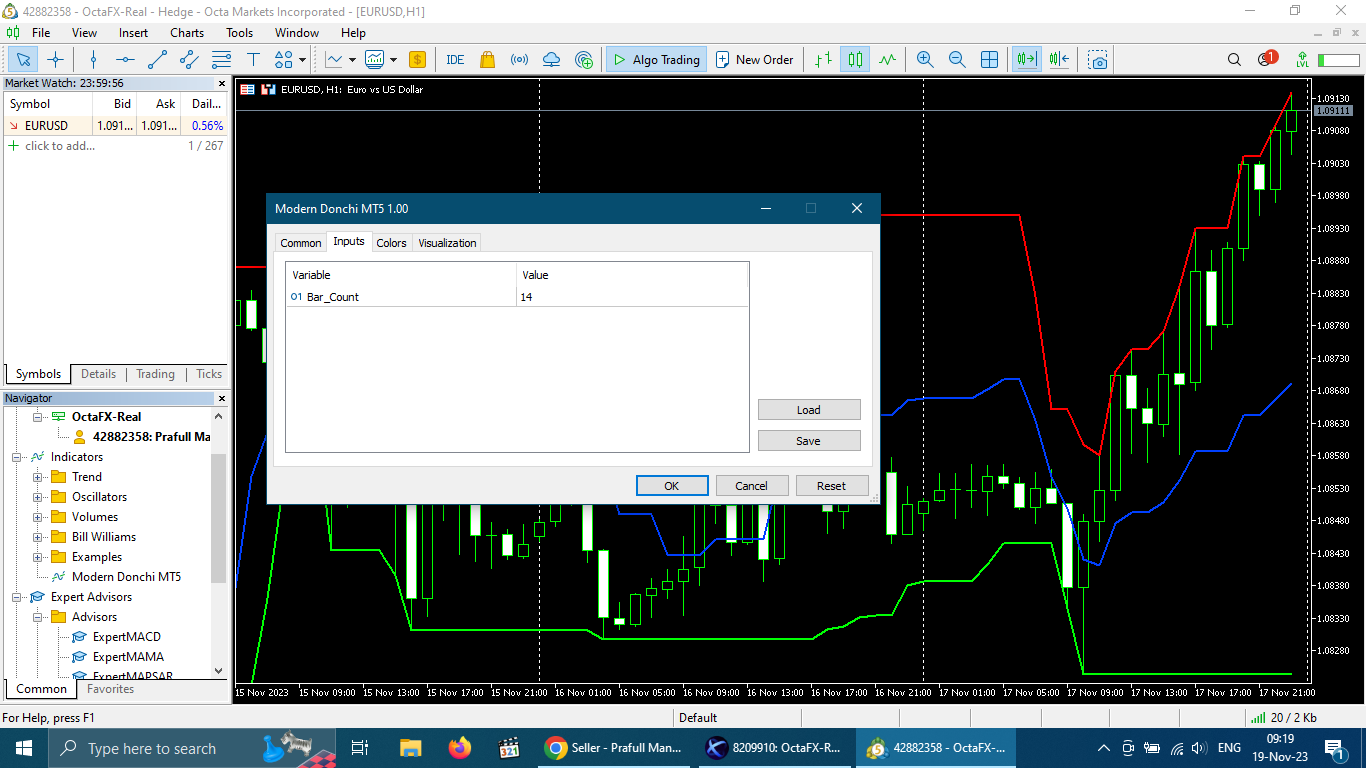
Input Explained:
1. Bar Count - No. of previous bars/candles from the current bar/candle. This is the period on which indicator will plot support and resistance levels.