StudentK Sync Chart Simple
- インディケータ
- Chui Yu Lui
- バージョン: 1.11
--- StudentK Sync Chart ---
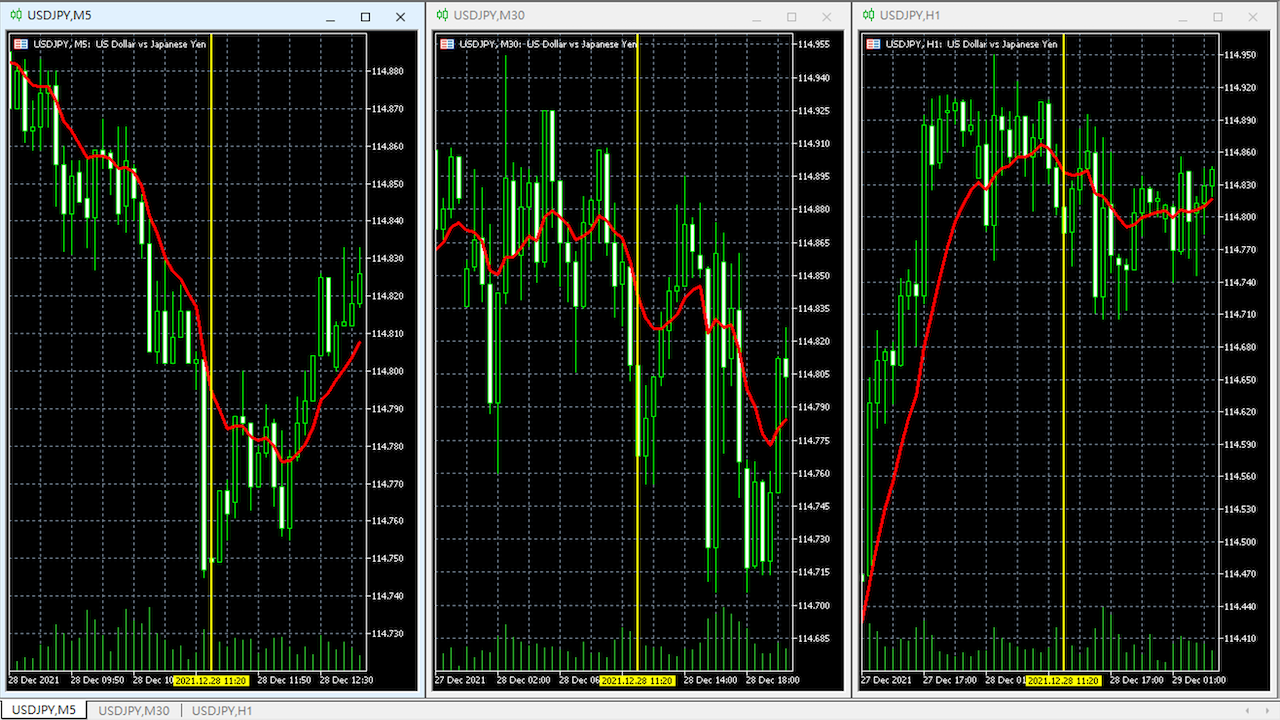
1. Move charts at the same time
2. Cross check among different Symbols and Timeframes
3. Plan your own trading strategies
=== Simple (Free) Version ===
1. Allow USDJPY only
2. Support M5 and M15
3. * Contact StudentK for unlocking all timeframes *
--- Context ---
StudentK is not indicated as a master or K Sir for knowledgeable person who claims for winning all the time. (But lots of traders should know the fact that it is rarely truth, especially in fluctuated period of time)
StudentK is a group of years-experienced traders who want to share amazing tools in Free and Paid versions. Aiming helping people getting out of "The Rat Race" by using Free version while providing unlocked features (like Symbol/Timeframe) in Paid version.
--- Private Telegram Group ---
There is Private Telegram Group for communications (for investors who used Paid StudentK's products only).
ユーザーは評価に対して何もコメントを残しませんでした