Fork 5
- インディケータ
- Francisco De A Vilar Enriquez
- バージョン: 1.0
- アクティベーション: 5
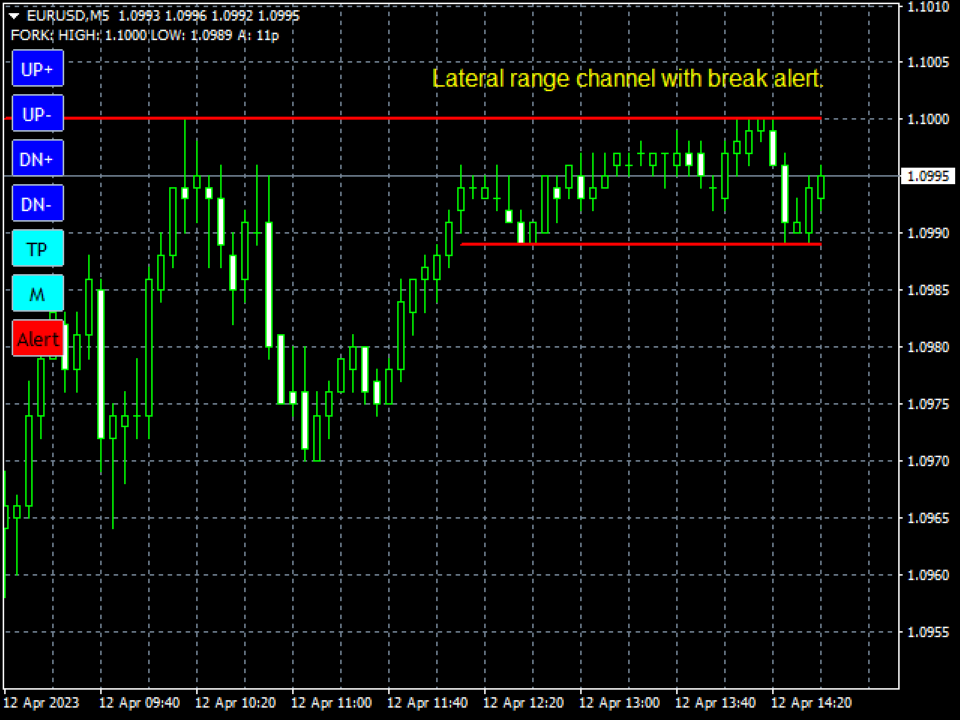
The best instrument for scalping. It allows you to always be correctly positioned in the price. It's a simple and extraordinarily powerful visual reference. Very suitable for price action. It consists of four components.
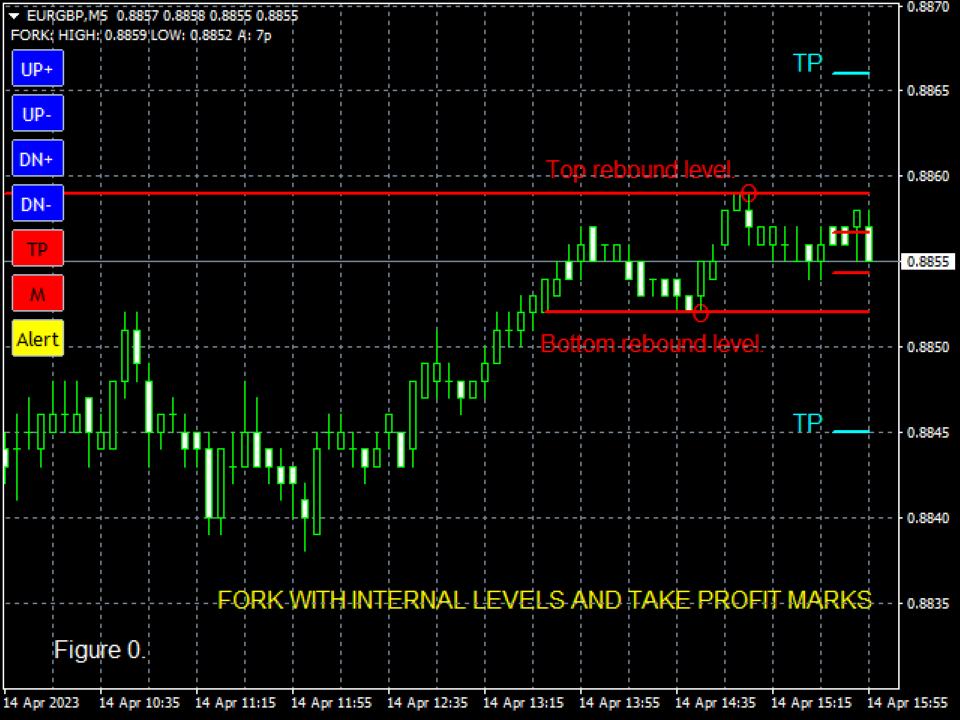
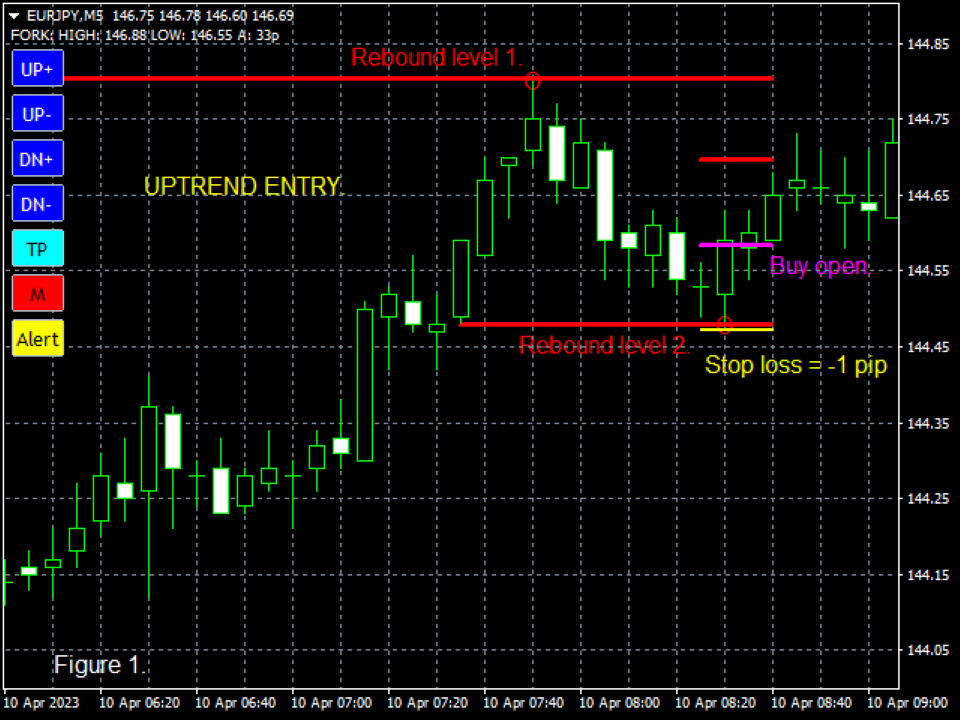
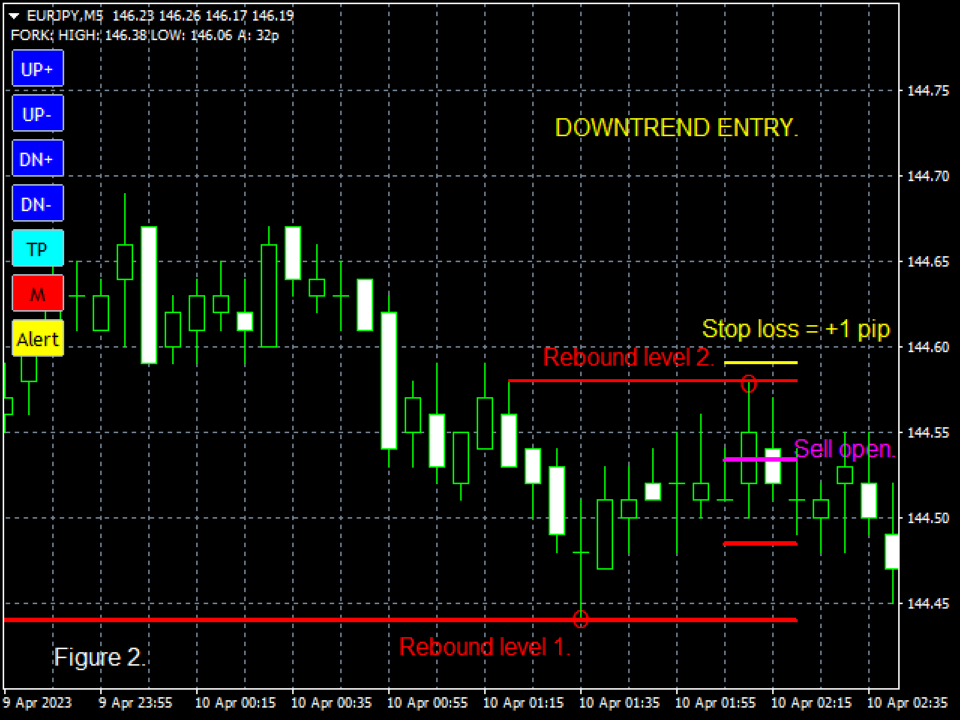
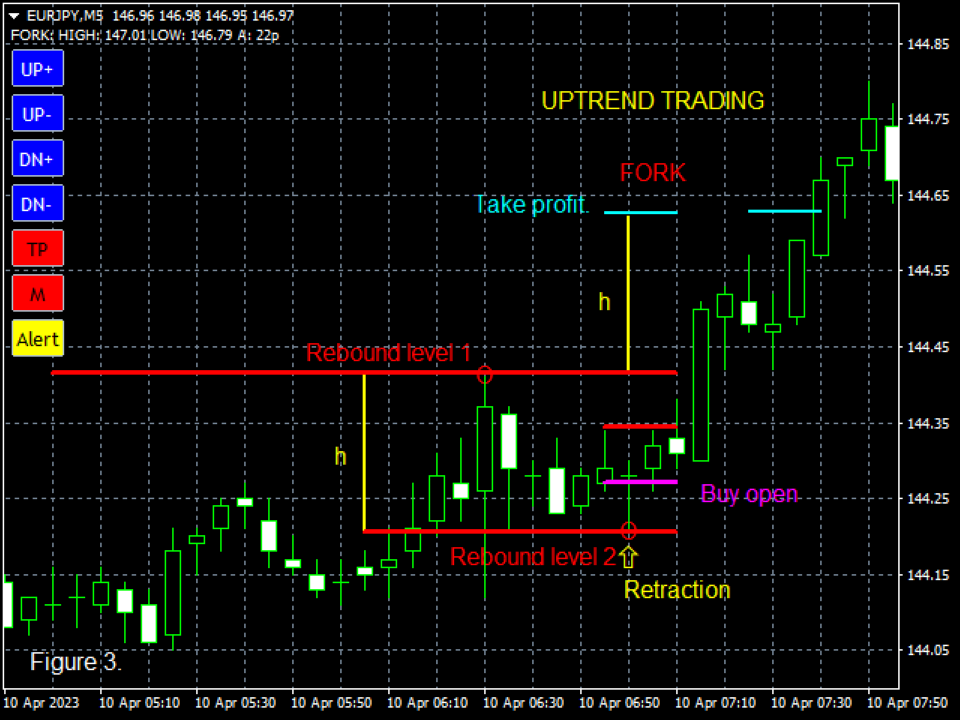
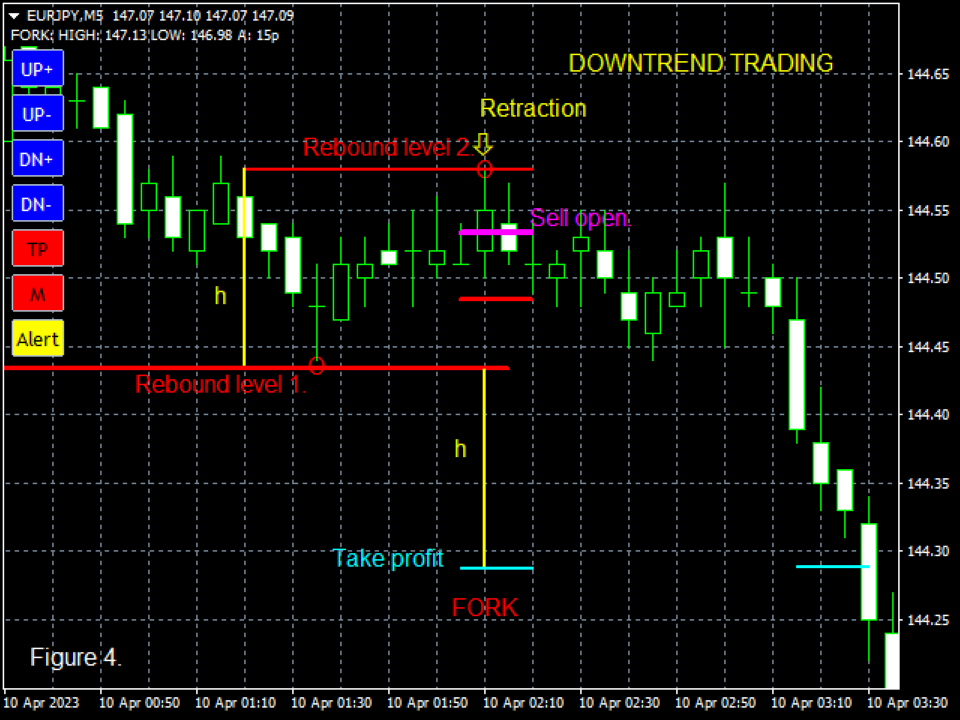
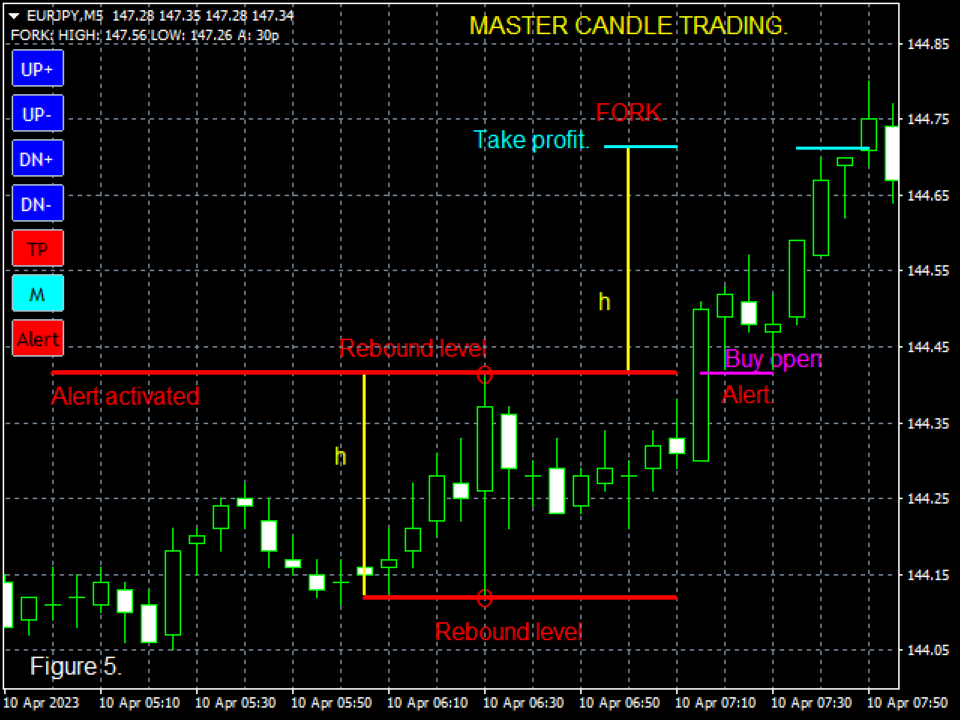
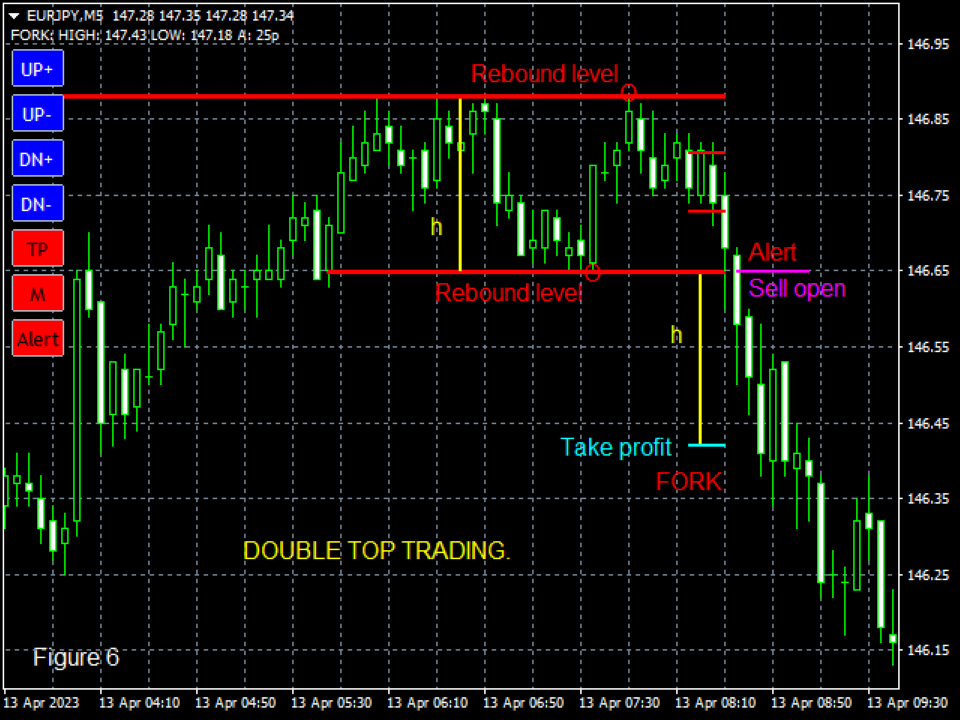
1. Fork.
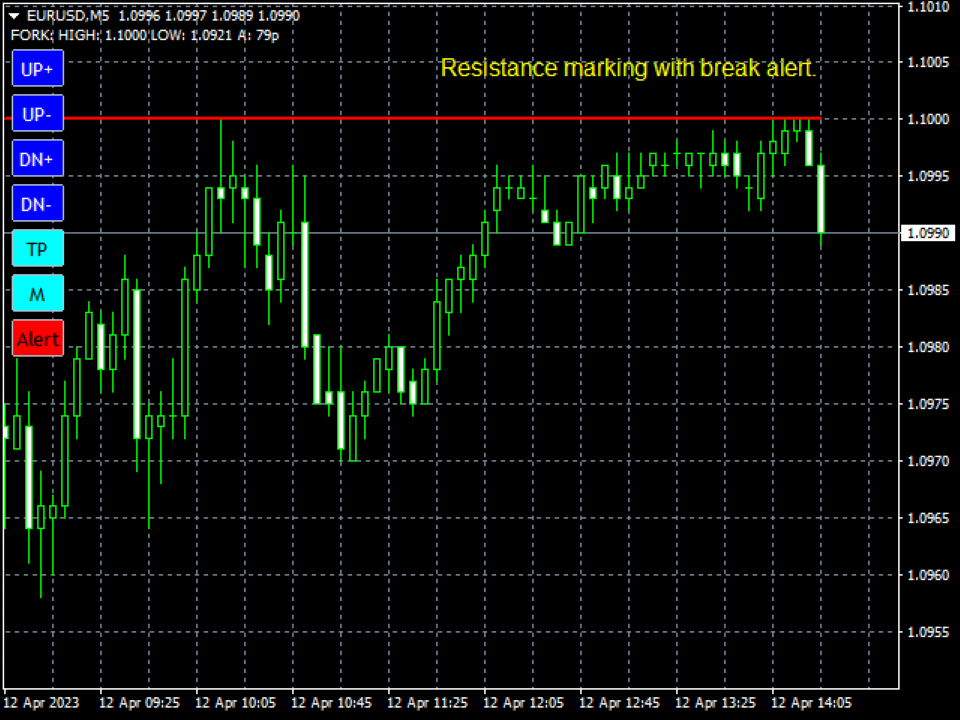
There are two levels that surround the price and mark the rebound points. They can be varied independently with 4 associated controls, two for each level. Its amplitude is indicated in pips in the indicator data. The minimum fork is updated with each tick. It has break alert.
2. Internal Levels.
They are two marks that divide the fork into 3 equal zones. They can be activated/deactivated with an associated control.
3. Take profit marks.
Two marks at a distance equal to the width of the fork. They can be activated/deactivated with an associated control. Once these marks are activated they remain fixed, being independent of the fork; this allows more ductility of the indicator.
4. Associated controls.
UP+,UP-: change top rebound level.
DN+,DN-: change bottom rebound level.
TP: take profit marks.
M: mark internal levels.
Alert: locks the fork and activates the break alert.
(The last three turn red when activated).
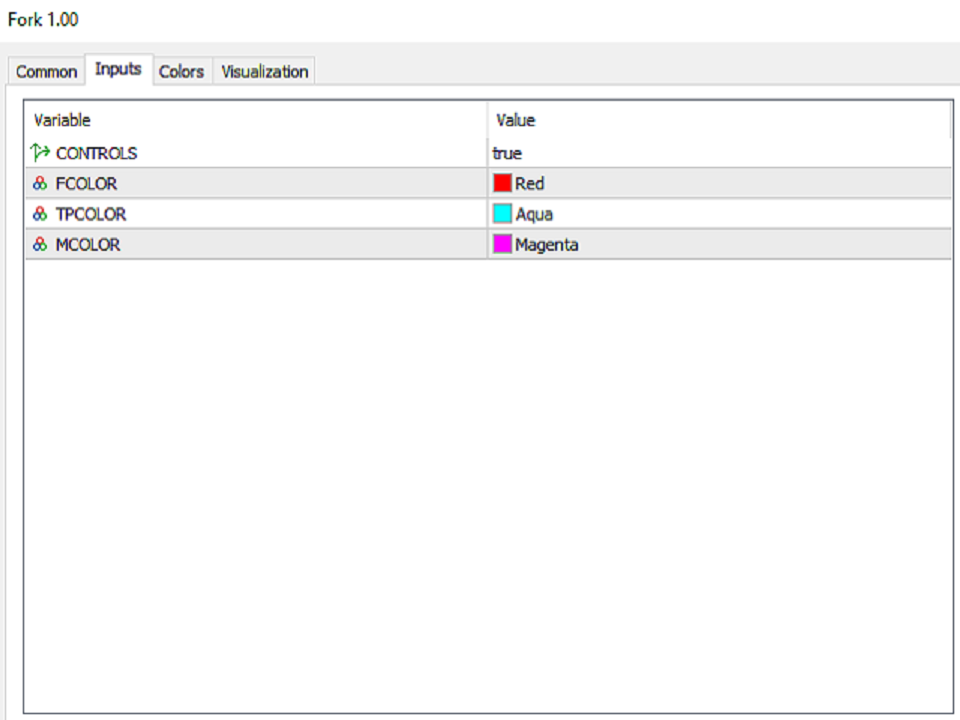
Options:
-Disable controls: then only the smallest fork is shown.
-Colors.
Contact email: fve2022@hotmail.com
ユーザーは評価に対して何もコメントを残しませんでした