BreakOut Consult mt5
- インディケータ
- Daniel Opoku
- バージョン: 3.0
- アップデート済み: 24 4月 2023
- アクティベーション: 5
Breakout Consult mt5
Introducing the BreakOut Consult, the revolutionary tool that will take your trading to the next level! Our state-of-the-art algorithm combines multiple trend and oscillators to generate accurate buy and sell signals, making it a powerful tool for any trader.
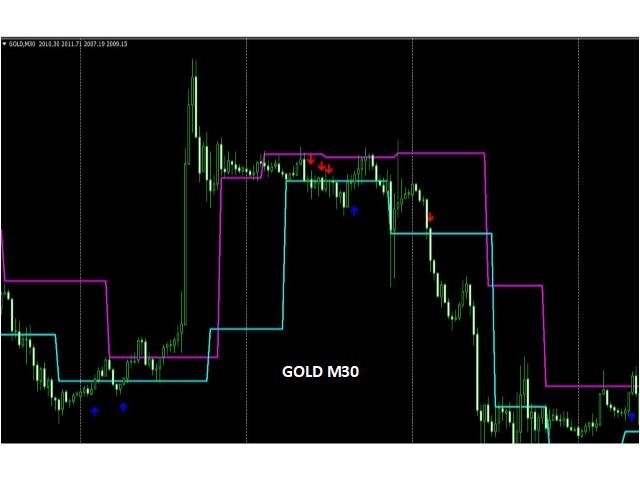
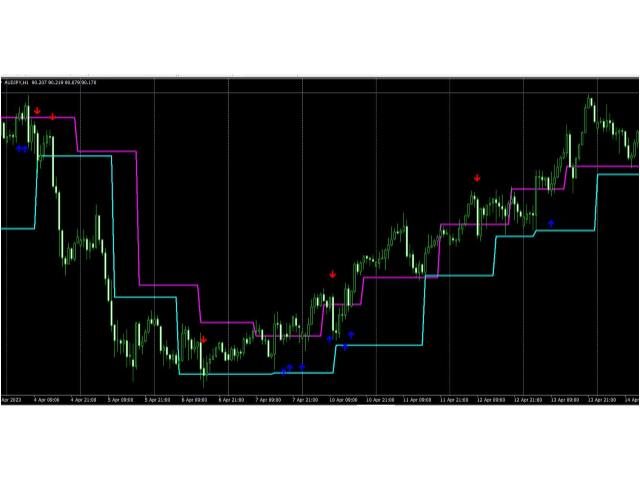
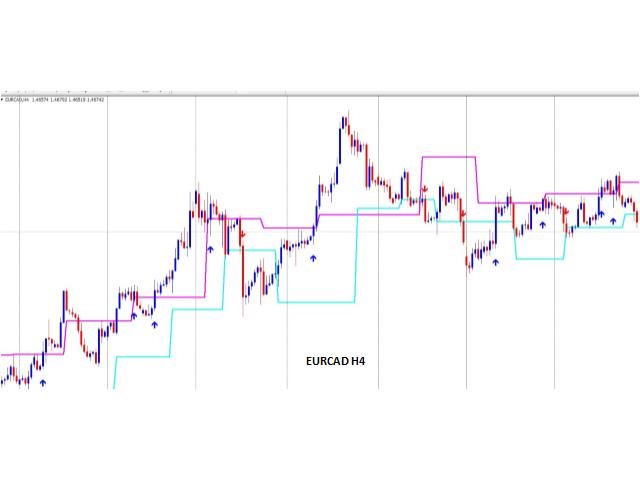
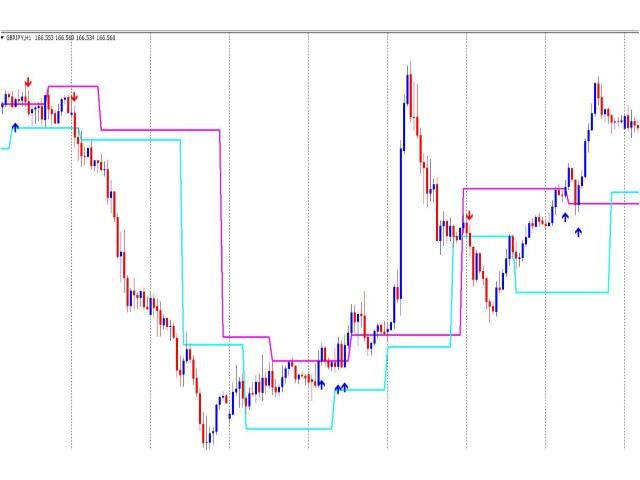
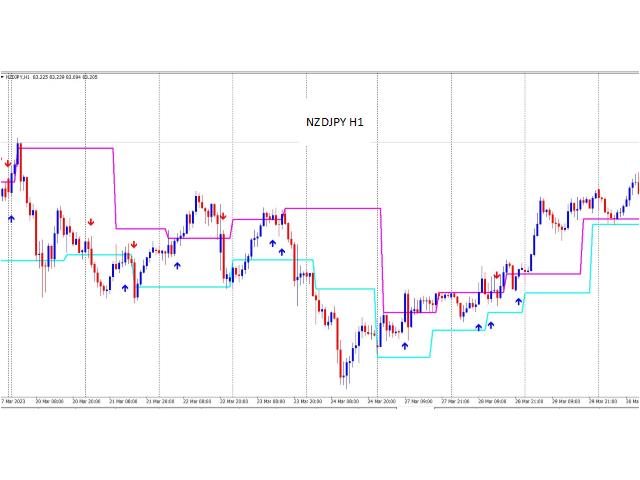
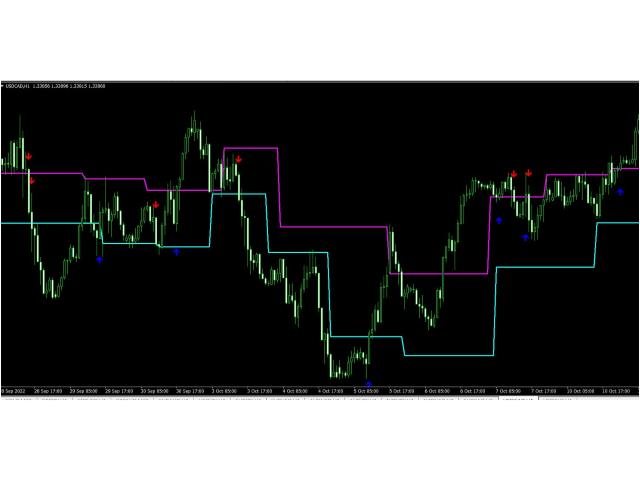
With BreakOut Consult, you can easily identify breakouts in the market with the help of our dynamic channel, which uses resistant and support levels to detect breakouts. Our algorithm detects two types of breakouts, ensuring you never miss a golden opportunity.
- Breakout of the RESISTANT from the ABOVE and breakout of the SUPPORT from the BELOW.
- Breakout of the RESISTANT from the BELOW and breakout of the SUPPORT from the ABOVE.
When a buy breakout occurs, an UP arrow appears, and when a sell breakout occurs, a DOWN arrow appears - it's that simple!
Our algorithm has been designed to work across all markets, including forex, commodity, stocks, and crypto. No matter what type of trader you are, whether you're a scalper, swing trader, or position trader, BreakOut Consult can help you detect breakouts on any time frame.
We understand that false breakouts can be a real problem, which is why our algorithm uses sophisticated filters to reduce false breakouts, making BreakOut Consult even more reliable and effective.
Pros and Cons
Once the signal arrow is displayed on the chart after a close of a candle, it never disappears, so you can be confident in your trading decisions.
While BreakOut Consult is capable of identifying high-quality breakouts that lead to strong trends, there are occasional missed opportunities due to algorithmic constraints.
BreakOut Consult can certainly help you increase your profits, however, it's important to remember that it's not a holy grail indicator.
Don't miss out on the next big breakout - try BreakOut Consult today and take your trading to the next level!