WamekTrendConsult
- インディケータ
- Daniel Opoku
- バージョン: 2.0
- アップデート済み: 20 1月 2024
- アクティベーション: 5
Elevate Your Trading Experience with Wamek Trend Consult!
Unlock the power of precise market entry with our advanced trading tool designed to identify early and continuation trends. Wamek Trend Consult empowers traders to enter the market at the perfect moment, utilizing potent filters that reduce fake signals, enhancing trade accuracy, and ultimately increasing profitability.
Key Features:
1. Accurate Trend Identification: The Trend Consult indicator employs advanced algorithms and unparalleled accuracy to filter out false signals, providing traders with a clear advantage.
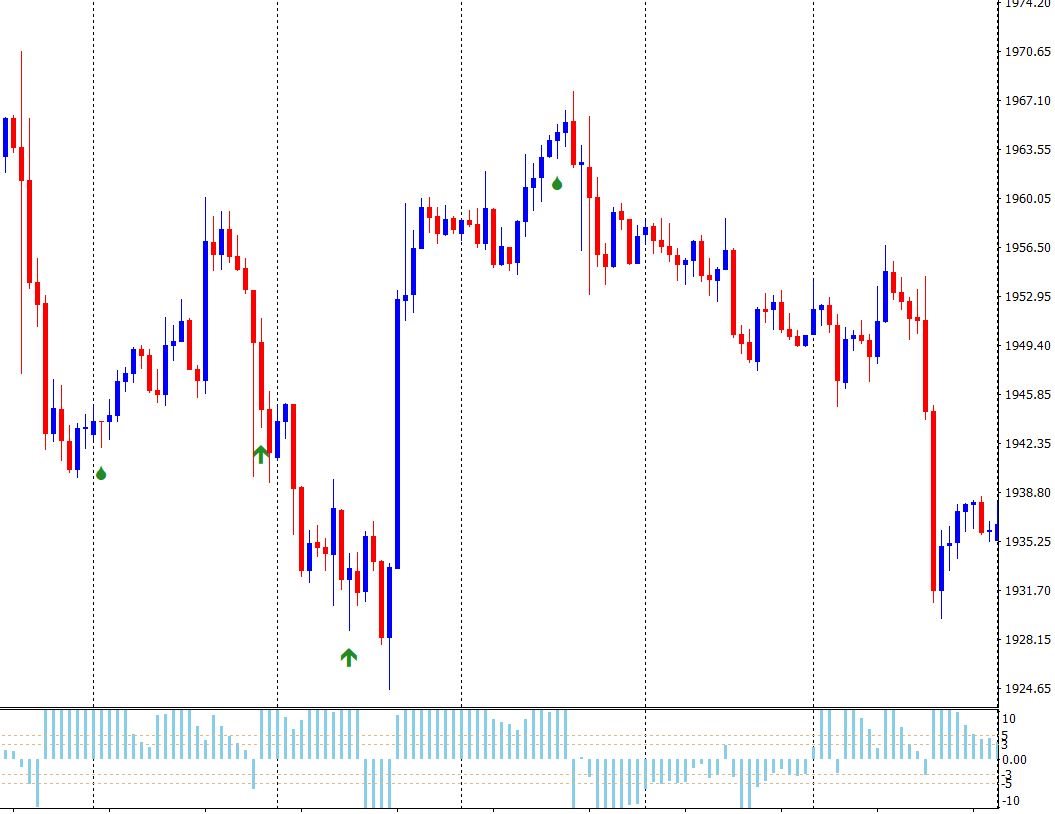
2. Customizable Filters: The latest release allows users to redefine filter boundaries specific to each instrument, adding an extra layer of sophistication to trend analysis. Additionally, it detects pinbar and inverted pinbar formations for insights into potential reversals or trend continuations.
3. Versatility for All Traders: Whether you're into scalping, swing trading, or position trading, Trend Consult caters to all trading styles. Its user-friendly interface and intuitive design make it accessible for beginners, while providing a top-notch advantage for professionals.
4. Limited Time Promotion: Wamek Trend Consult is currently available at a discounted price of $155, presenting a unique opportunity to acquire this highly effective forex indicator at an exceptionally low cost. Seize this chance to optimize your trading strategy and elevate your game!
How to Use Wamek Trend Consult:
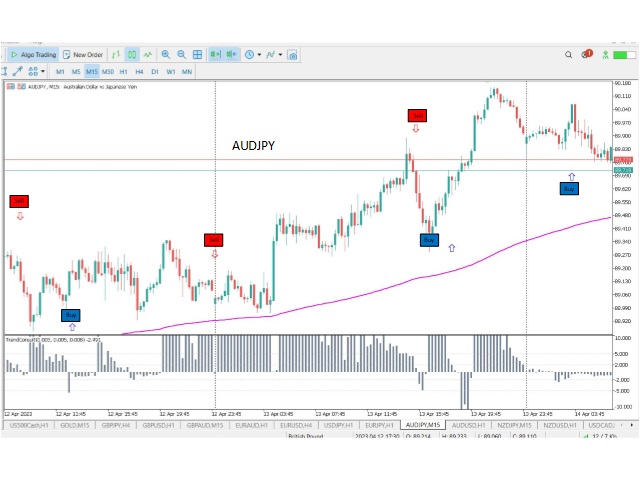
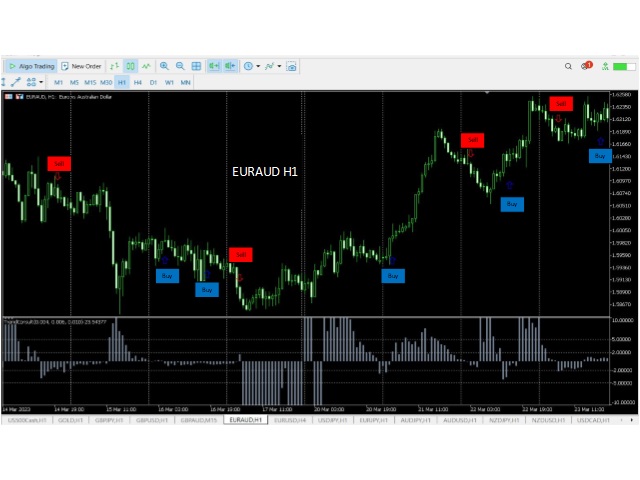
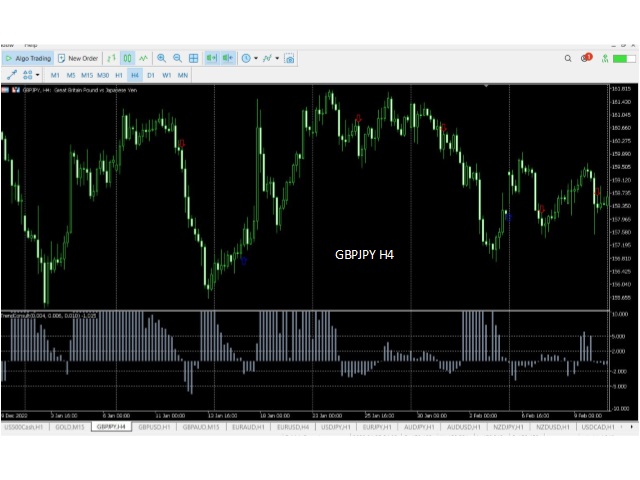
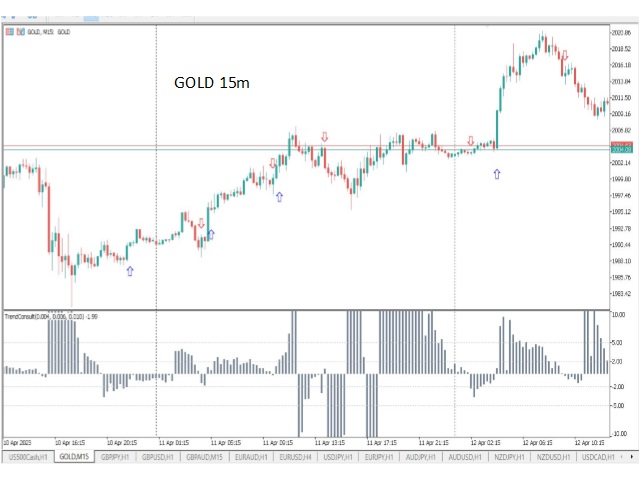
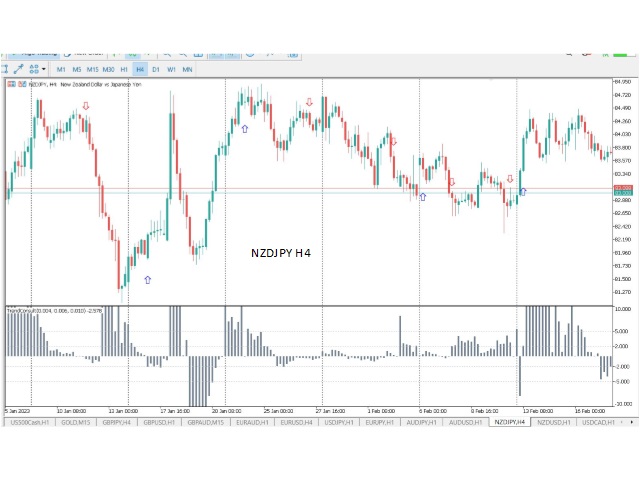
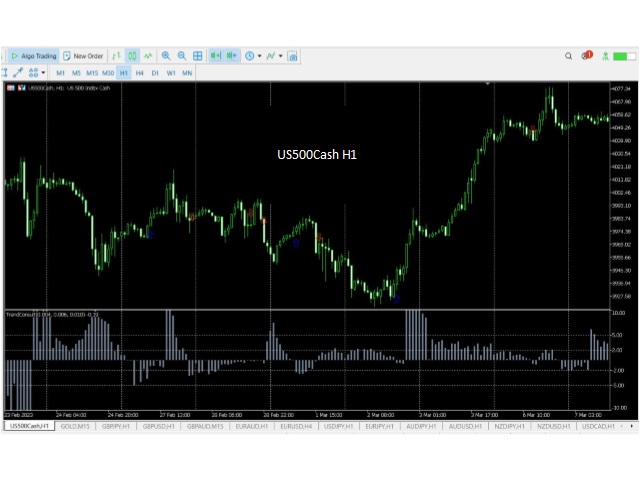
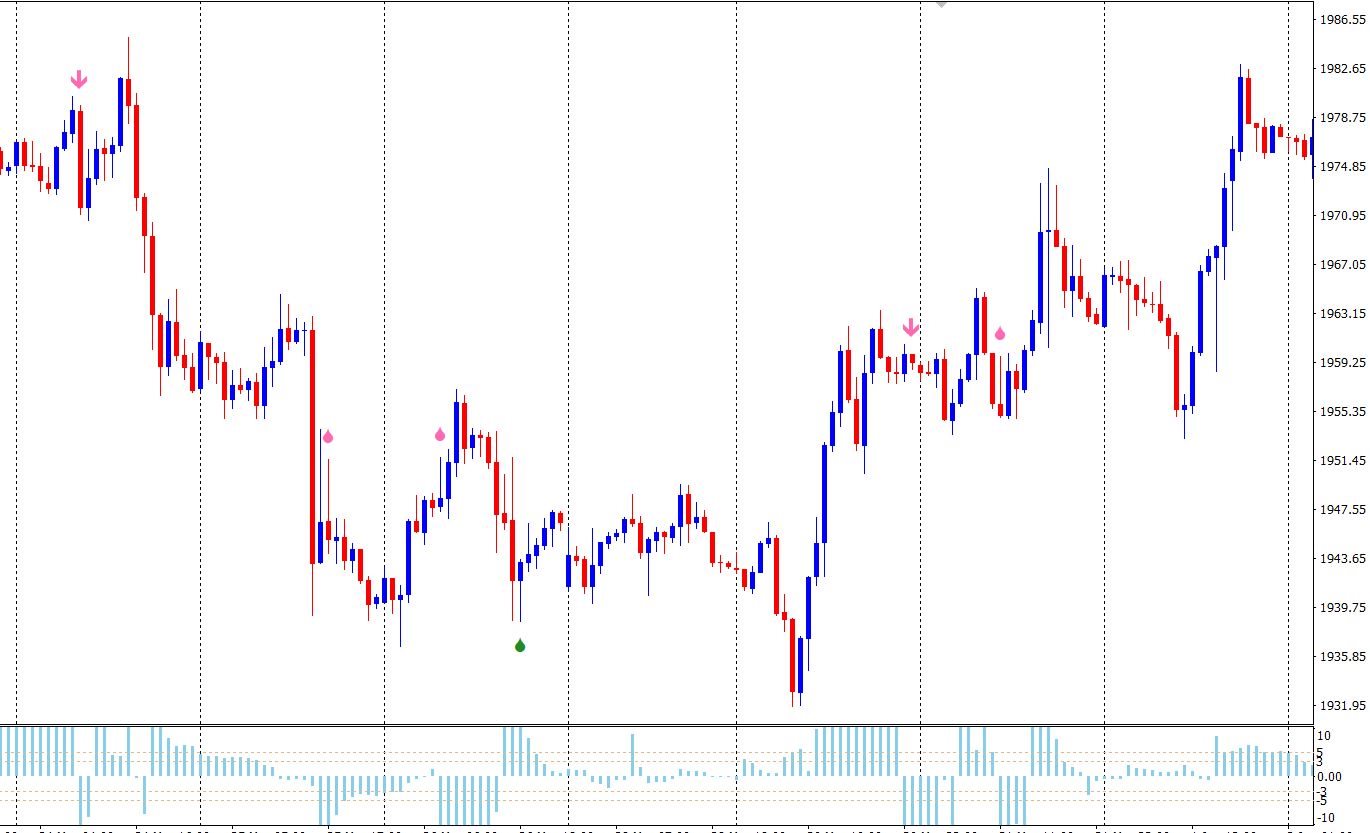
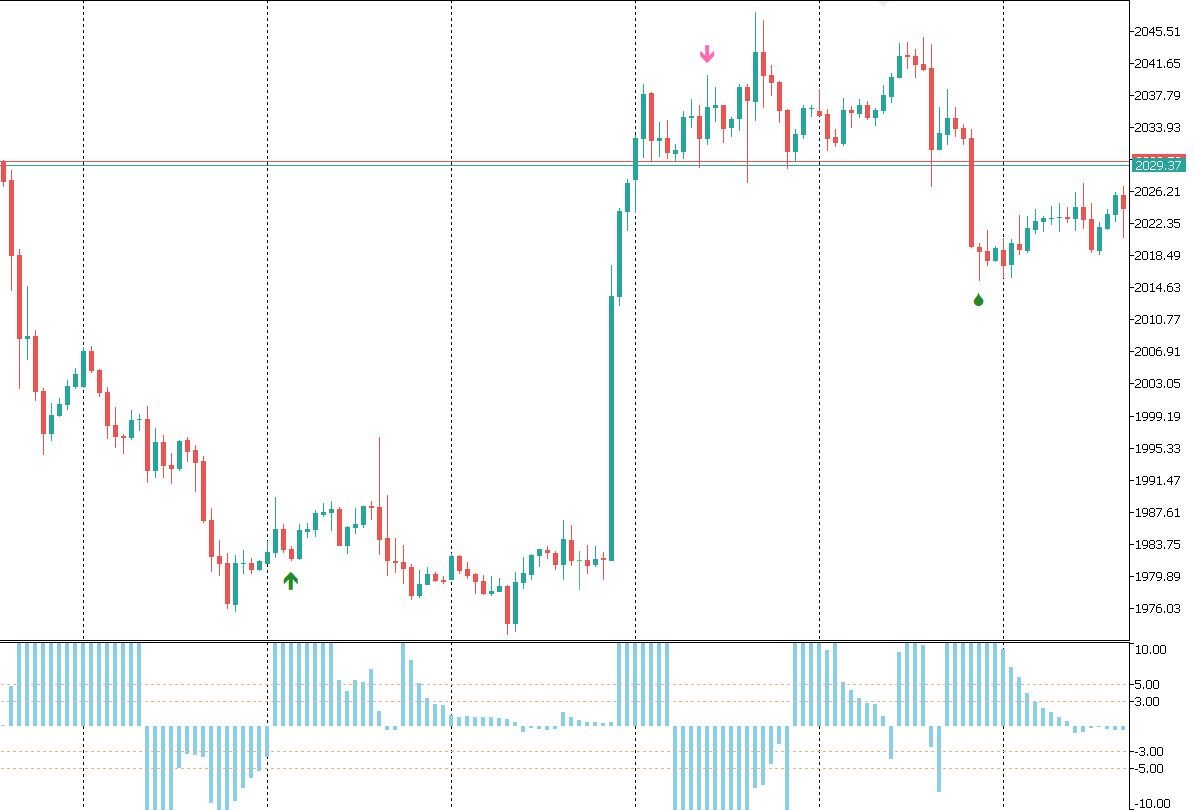
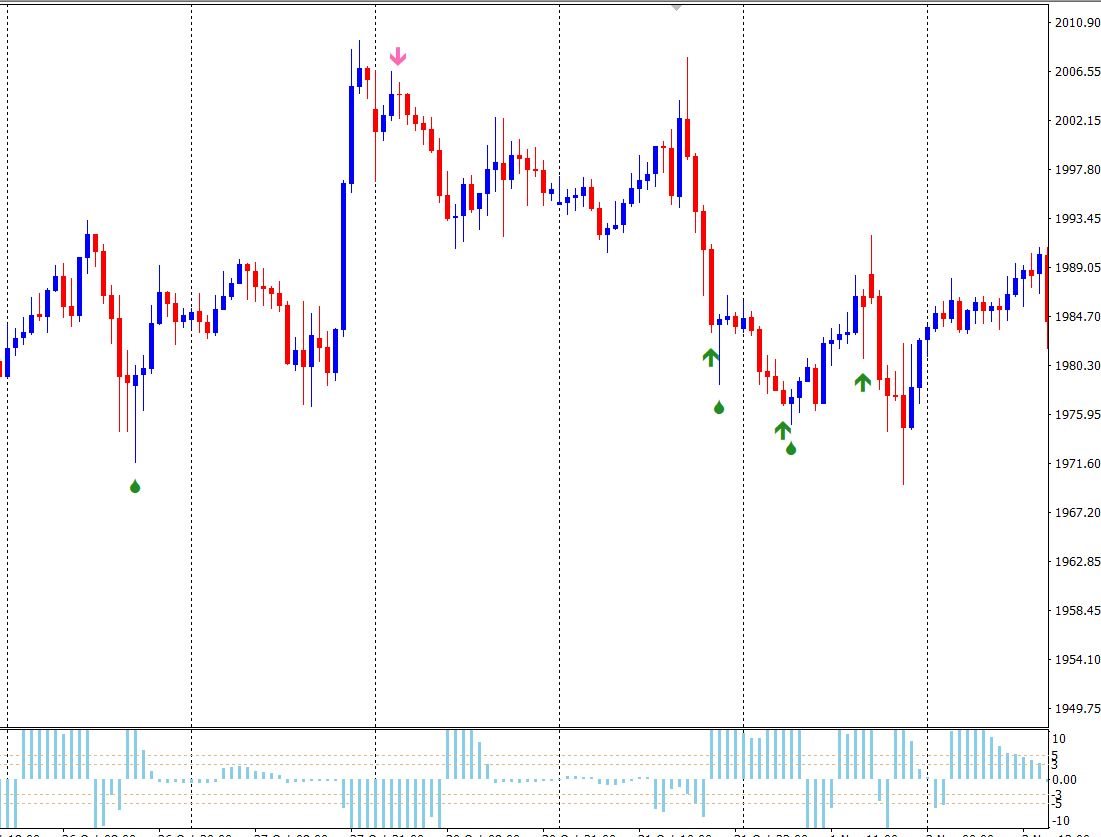
- Enter BUY position when the UP ARROW appears below the Low of the previous candle.
- Enter SELL position when the DOWN ARROW appears above the High of the previous candle.
At Wamek, we prioritize transparency and empower traders to take control of their trades. Unlike others, we don't dictate specific stop-loss or take-profit signals. We believe in the uniqueness of every trader's strategy, encouraging you to make informed decisions based on your trading style. With Trend Consult as your trusted partner, take your trading to the next level – on your terms.
Input Parameters:
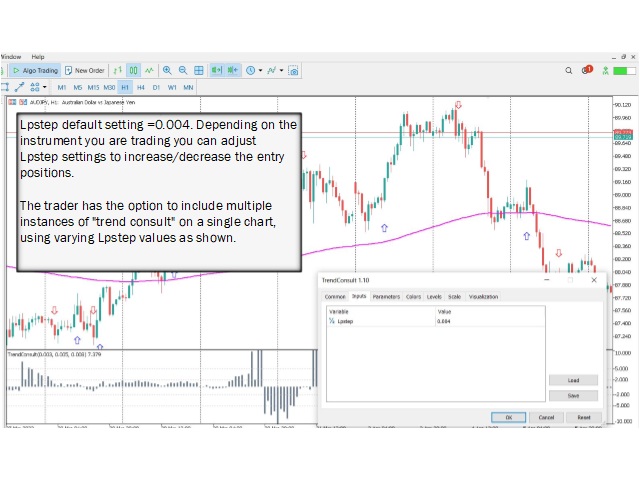
- Lpstep default settings = 0.016
- FilterLow = 20
- FilterHigh = 40
Enhanced Flexibility:
Unlock greater flexibility in your trading strategy with Trend Consult. Adjustable Lpstep settings empower you to fine-tune entry positions based on the specific instrument you're trading. The innovative design allows for multiple instances of the indicator on a single chart, each with varying Lpstep values tailored to your preferences.
Invest in Trend Consult today and discover the difference it can make in your trading success!
Keep in Mind:
Wamek Trend Consult is not the holy grail of the financial market, but it is a powerful tool that can help you achieve consistent profits over time. Combine our indicator signals with your unique trading strategy to increase success and build a positive trading expectancy. Our team is committed to providing accurate insights into market trends, standing by our product's ability to improve your overall trading performance.