• 概要
  • レビュー
  • コメント
  • 最新情報

DYJ SuperTrendWave

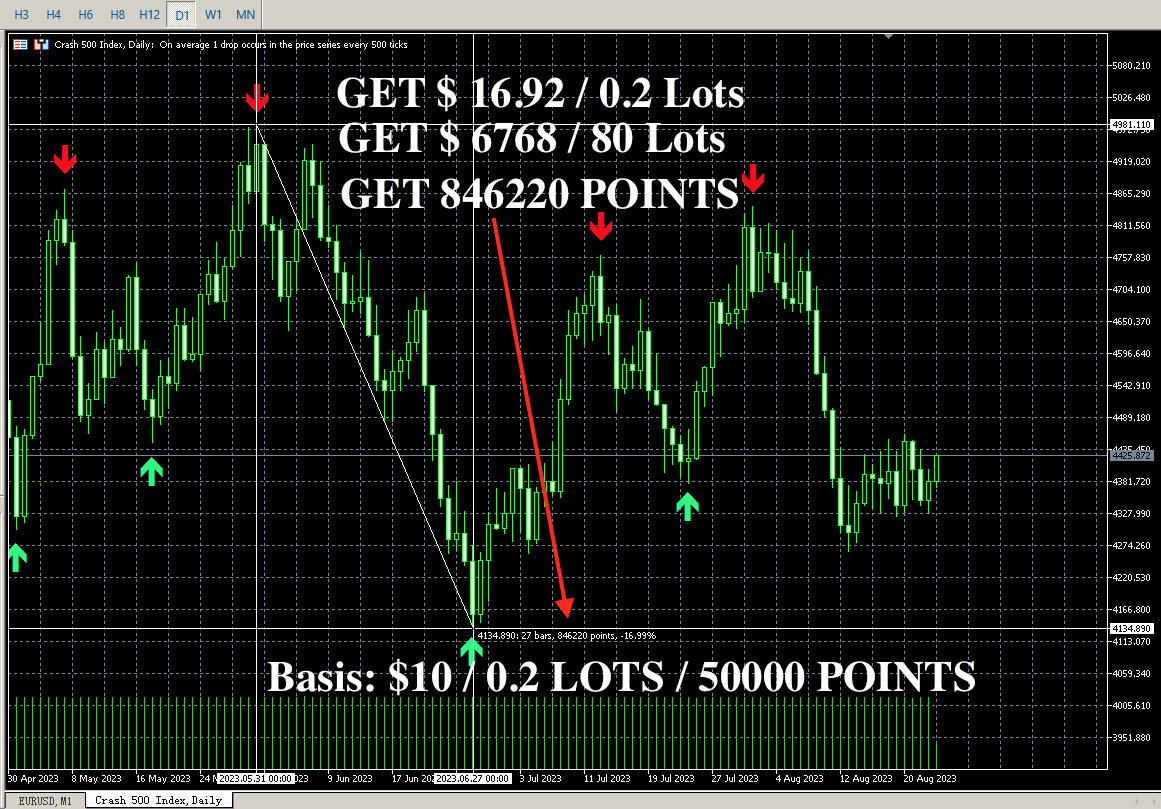
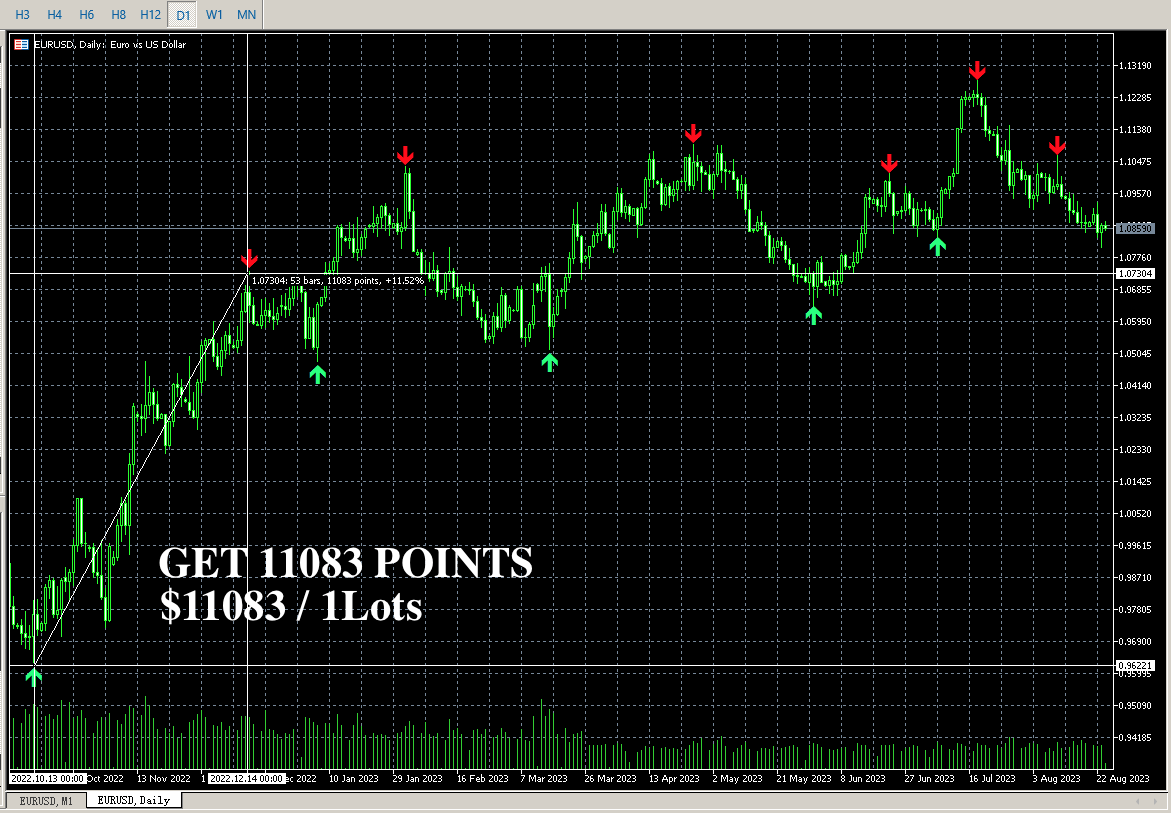
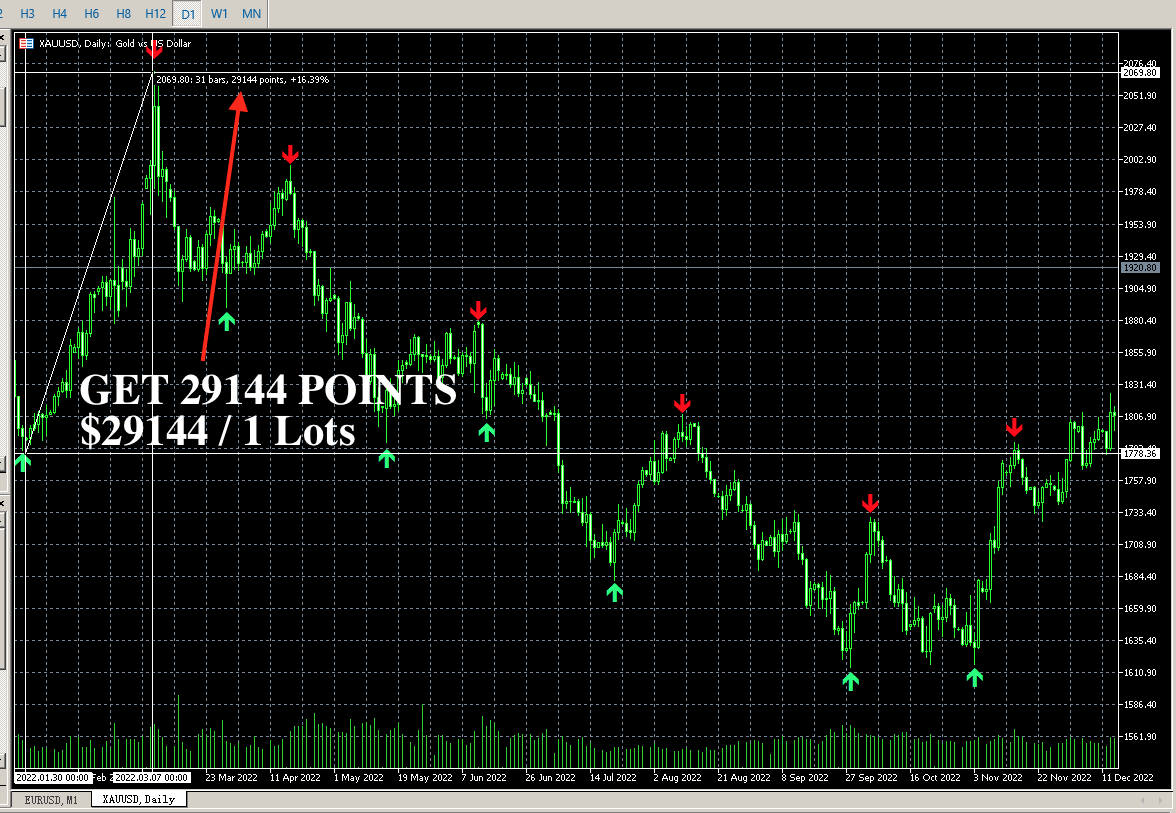
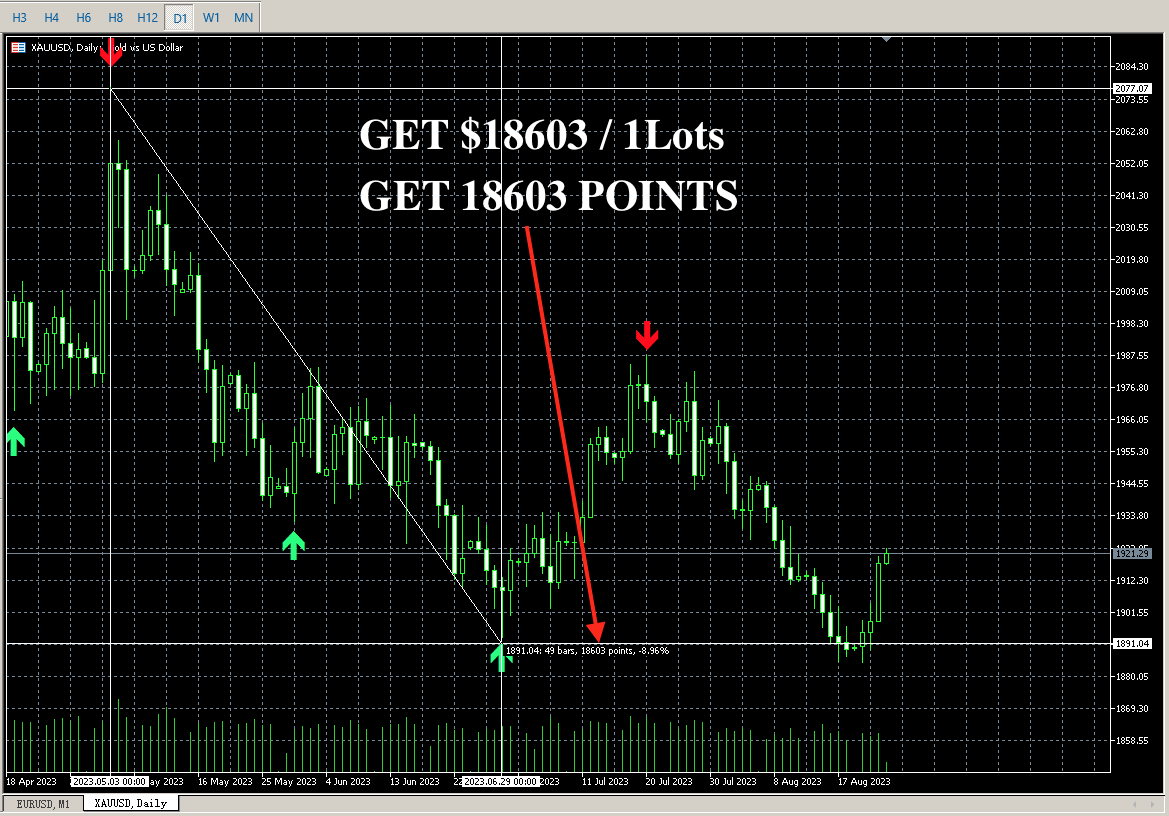
DYJスーパートレンド波は高度に正確なピークと谷取引システムである。

この指標は市場に進出する時にろうそくの糸の最高点と最低点を探す。

シグナルの通知タイプがdyj supertrendに追加されました。

多空間信号が発生すると、

Alert mailSend、MobilePushという種類の通知信号を使用できます。

Input

InpSignalPeriod = 10
BarDistance = 24
InpIsAlert = true

=====================

DYJ SuperTrendWave is a highly accurate trading system.

This indicator looks for the highest and lowest points of candles as entering and leaving the market.

The notification type of signal has been added to the dyj supertrend.

When a multi-space signal is generated,

The following types of notification signals are available:  Alert  mailSend, MobilePush.

  • InpSignalPeriod   =  10;
  • BarDistance       =  24;
  • InpIsAlert        =  true;


おすすめのプロダクト
A powerful oscillator that provide Buy and Sell signals by calculating the investor liquidity. The more liquidity the more buy possibilities. The less liquidity the more sell possibilities. Please download the demo and run a backtest! HOW IT WORKS: The oscillator will put buy and sell arrow on the chart in runtime only . Top value is 95 to 100 -> Investors are ready to buy and you should follow. Bottom value is 5 to 0 -> Investors are ready to sell and you should follow. Alert + sound will app
MT4版  |  FAQ Owl Smart Levels Indicator は、 Bill Williams の高度なフラクタル、市場の正しい波構造を構築する Valable ZigZag、エントリの正確なレベルをマークする Fibonacci レベルなどの一般的な市場分析ツールを含む 1 つのインジケーター内の完全な取引システムです。 利益を得るために市場と場所に。 戦略の詳細な説明 インジケータを操作するための指示 顧問-取引助手 プライベートユーザーチャット ->購入後に私に書いて、私はプライベートチャットにあなたを追加し、あなたはそこにすべてのボーナスをダウンロードすることができます 力はシンプルさにあります! Owl Smart Levels 取引システムは非常に使いやすいので、専門家にも、市場を勉強し始めて自分で取引戦略を選択し始めたばかりの人にも適しています。 戦略と指標に秘密の数式や計算方法が隠されているわけではなく、すべての戦略指標は公開されています。 Owl Smart Levels を使用すると、取引を開始するためのシグナルをすばやく確認し、注文を出すため
Noize Absorption Index - is the manual trading system that measures the difference of pressure between bears forces and bulls forces. Green line - is a noize free index that showing curent situation. Zero value of index shows totally choppy/flat market.Values above zero level shows how powerfull bullish wave is and values below zero measures bearish forces.Up arrow appears on bearish market when it's ready to reverse, dn arrow appears on weak bullish market, as a result of reverse expectation.
トレンドトレーディング は、タイミングのプルバックとブレイクアウトにより、市場で起こっているトレンドから可能な限り利益を得るように設計された指標です。確立されたトレンドの中で価格が何をしているかを分析することにより、取引の機会を見つけます。 [ インストールガイド | 更新ガイド | トラブルシューティング | よくある質問 | すべての製品 ] 自信を持って効率的に金融市場を取引する むち打ちにならずに確立されたトレンドから利益を得る 収益性の高いプルバック、ブレイクアウト、早期の逆転を認識する この指標は、独自の品質とパフォーマンスを分析します 複数時間枠のダッシュボードを実装します インジケーターは再描画されていません 電子メール/音声/視覚アラートを実装します 確立されたトレンドは多くの取引機会を提供しますが、ほとんどのトレンド指標はそれらを完全に無視しています。インジケーターの解釈はかなり簡単です: (1) トレンドの変化 (2) トレンドの方向への後退 (3) トレンドの方向へのブレイクアウト 赤いダッシュ は下降トレンド中の修正です 青いダッシュ は上昇ト
Trend Monitor MT5
Pavel Zamoshnikov
3.67 (3)
The indicator generates early signals basing on ADX reading data combined with elements of price patterns. Works on all symbols and timeframes. The indicator does not redraw its signals. You see the same things on history and in real time. For better visual perception signals are displayed as arrows (in order not to overload the chart). Features The best results are obtained when the indicator works on two timeframes. For example: M30 – the indicator shows the main trend; M5 – the indicator ge
Introducing the Consecutive Green/Red Candle Alert Indicator for MT5 - Your Trend Spotting Companion! Are you ready to take your trading to the next level? We present the Consecutive Green/Red Candle Alert Indicator, a powerful tool designed to help you spot trends and potential reversals with ease. Whether you're a new trader looking for clarity in the market or an experienced pro seeking additional confirmation, this indicator is your trusted companion. Key Features of the Consecutive Gre
The best time to trade Using this Indicator is when the time reach exactly hour,half,45 minutes,15 minutes and sometimes 5 minutes.. This indicators is helpful to those who trade boom and crash indecies.How to read this indicator first you'll see Blue allow and Red allow all these allows used to indicate or to detect the spike which will happen so the allow happens soon before the spike happen.This indicator works properly only in boom and crash trading thing which you have to consider when
無限からの通貨の強さを測定するためのこの革新的な指標は、長い間取引されているダフ屋やトレーダーにとって不可欠な助手です。 通貨の強さ/弱さを分析するためのシステムは、世界の主要なトレーダーによって市場で長い間知られており、使用されてきました。 任意の裁定取引は、この分析なしでは完全ではありません。 私たちの指標は、互いに関連して基本通貨の強さを簡単に決定します。 これは、インスタント分析を可能にし、最強のエントリポイントを検索し、すべてまたは現在の通貨ペアの折れ線グラフが表示されます。 インジケータは直感的で、すぐに見つけて任意のペアに切り替えることができ、地下室とメインチャートの両方に配置できるモバイルパネルがあります。 通貨の強さの変化の通知のタイマーモードは、トレーダーに電話で通知を受け取る機会を与えます。  通貨パワーメーターインフィニティ指標を使用するためのいくつかの戦略: 1. 通貨の強さの線形表示のチャートを使用して、交差点を新興トレンドの信号として検索します 2. トレンド反転信号が表示された後、強い通貨の方向に頭皮 3. 通貨の強さの発散分析を使用して、
This is the famous Sunflower indicator for Metatrader5. This indicator marks possible tops and bottoms on price charts. The indicator identifies tops and bottoms in the asset's price history, keep in mind that the current sunflower of the last candle repaints, as it is not possible to identify a top until the market reverses and it is also not possible to identify a bottom without the market stop falling and start rising. If you are looking for a professional programmer for Metatrader5, please
The Riko Trend indicator is a revolutionary trend trading and filtering solution with all the important features of a trend tool built into one tool! The Riko Trend indicator is good for any trader, suitable for any trader for both forex and binary options. You don’t need to configure anything, everything is perfected by time and experience, it works great during a flat and in a trend. The Riko Trend indicator is a technical analysis tool for financial markets that reflects the current price
The Antique Trend Indicator is a revolutionary trend trading and filtering solution with all the important features of a trend tool built into one tool! The Antique Trend indicator is good for any trader, suitable for any trader both for Forex and binary options. There is no need to configure anything, everything has been perfected by time and experience, it works great during flats and trends. The Antique Trend indicator is a tool for technical analysis of financial markets, reflecting curre
Indicator and Expert Adviser  EA Available in the comments section of this product. Download with Indicator must have indicator installed for EA to work. Mt5 indicator alerts for bollinger band and envelope extremes occurring at the same time. Buy signal alerts occur when A bullish candle has formed below both the lower bollinger band and the lower envelope  Bar must open and close below both these indicators. Sell signal occur when A bear bar is formed above the upper bollinger band and upp
このインジケーターは、チャート上のすべての注文 (トランザクション/注文ラインにクローズ) に対して既に設定した TP および SL 値 (その通貨で) を表示し、すべての注文の利益と損失を見積もるのに大いに役立ちます。また、PIP 値も表示されます。表示されている形式は、「利益または損失の通貨値 / PIP 値」です。 TP 値は緑色で表示され、SL 値は赤色で表示されます。 ご質問や詳細については、fxlife.asia@hotmail.com で販売者にお気軽にお問い合わせください。 (そして、近日中にインジケータに追加される次の機能は、「自動または半自動の TP および SL 設定」であり、お客様は無料で更新バージョンを入手できます。よろしくお願いします。) (または、表示に何か機能を追加すべきだと思われる場合は、お気軽にお申し付けください)
Improved version of the free HMA Trend indicator (for MetaTrader 4) with statistical analysis. HMA Trend is a trend indicator based on the Hull Moving Average (HMA) with two periods. HMA with a slow period identifies the trend, while HMA with a fast period determines the short-term movements and signals in the trend direction. The main differences from the free version: Ability to predict the probability of a trend reversal using analysis of history data. Plotting statistical charts for analyz
Stochastic  Reversal  allows you to recognize reversals professionally. Stochastic Indicator: This technical indicator was developed by George Lane more than 50 years ago. The reason why this indicator survived for so many years is because it continues to show consistent signals even in these current times. The Stochastic indicator is a momentum indicator that shows you how strong or weak the current trend is. It helps you identify overbought and oversold market conditions within a trend.  Rules
Buy CTS scalping indicator, provide buying and selling signals, automatic channeling and sending signals to mobile phones Using technical analysis and price action methods and modern methods, CTS indicator can draw price channels and recognize price trends with high accuracy and issue entry and exit signals according to them. Traders can easily fluctuate using this indicator in different time frames and in different markets. With the CTS indicator, you can signal in different ways. This indicat
The new update makes this indicator a complete tool for studying, analyzing and operating probabilistic patterns. It includes: On-chart Multi-asset percentage monitor. Configurable martingales. Twenty-one pre-configured patterns, including Mhi patterns and C3. An advanced pattern editor to store up to 5 custom patterns. Backtest mode to test results with loss reports. Trend filter. Hit operational filter. Martingale Cycles option. Various types of strategies and alerts. Confluence between patter
The indicator detects and displays М. Gartley's Butterfly pattern. The pattern is plotted by the extreme values of the ZigZag indicator (included in the resources, no need to install). After detecting the pattern, the indicator notifies of that by the pop-up window, a mobile notification and an email. The pattern and wave parameters are displayed on the screenshots. The default parameters are used for demonstration purposes only in order to increase the amount of detected patterns. Parameters
MACD Intraday Trend PROは、1960年代にGeraldAppelによって作成された元のMACDを応用して開発されたインジケーターです。 長年の取引を通じて、MACDのパラメーターをフィボナッチの比率で変更することにより、トレンドの動きの連続性をより適切に表現できることが観察され、価格トレンドの開始と終了をより効率的に検出できるようになりました。 価格トレンドの検出が効率的であるため、トップとボトムの相違を非常に明確に識別し、取引機会をより有効に活用することもできます。 特徴 インディケータMACD日中トレンドPROは、任意の通貨ペア、任意の時間枠、および練行足チャートで機能します。 5つのモードを選択することにより、トレンド検出速度を設定することができます。 最速 速い 正常 スロー 最も遅い 資力 6つの構成可能なアラートがあります。 MACDがシグナルラインを引き戻す MACDが信号線を横切る MACDがレベル0を超える 信号線がレベル0を超えています MACDはトレンドカラーを変更します 信号線変更トレンドカラー アラートごとに、以下を
The standard Bollinger Bands indicator has been improved by integrating additional indications from the Standard Deviation indicator (StdDev), which gives an additional filter for confirming trading signals. In addition, the color of the indicator's lines shows the beginning of a trend, its development and exhaustion. This indicator has a signal block that notifies the trader of the beginning of the trend on any time frame to which it is attached. Settings Type of messages - select the type of
Point Black
Ignacio Agustin Mene Franco
Black Card Pack indicator 5/1 point black It has the strategy of professional bollingers where each arrow gives you a different entry signal. It is used to operate in m1 and in d1 It is used for scalping and intraday, modified for forex markets ! suitable for all pairs modified for synthetic index markets suitable for all pairs! Ideal for volatility and jumps!
インジケーターは、可能な限り最小のラグで 再描画せず にチャートに高調波パターンを表示します。インディケータトップの検索は、価格分析の波動原理に基づいています。 詳細設定では、取引スタイルのパラメータを選択できます。ろうそく(バー)のオープニングで、新しいパターンが形成されると、価格変動の可能性のある方向の矢印が固定され、変更されません。 インジケーターは、次のパターンとその種類を認識します:ABCD、Gartley(Butterfly、Crab、Bat)、3Drives、5-0、Batman、SHS、One2One、Camel、Triangles、WXY、Fibo、Vibrations。デフォルトでは、ABCDとGartleyの数字のみが設定に表示されます。多くの追加の構成可能なパラメーター。 主なパラメータ: ShowUpDnArrows-予想される方向矢印を表示/非表示 ArrowUpCode-上矢印コード ArrowDnCode-下矢印コード Show old history patterns-古いパターンの表示を有効/無効にします Enable alert messages,
The Trend Detect indicator combines the features of both trend indicators and oscillators. This indicator is a convenient tool for detecting short-term market cycles and identifying overbought and oversold levels. A long position can be opened when the indicator starts leaving the oversold area and breaks the zero level from below. A short position can be opened when the indicator starts leaving the overbought area and breaks the zero level from above. An opposite signal of the indicator can
US30NinjaMT5
Satyaseelan Shankarananda Moodley
US30 Ninja is a 5 minute scalping indicator that will let know you when there is a trade set up (buy or sell). Once the indicator gives the trade direction, you can open a trade and use a 30 pip stop loss and a 30 pip to 50 pip take profit. Please trade at own own risk. This indicator has been created solely for the US30 market and may not yield positive results on any other pair. 
Magic Finger can help you identify trends and trading opportunities clearly. The finger points to the open position signal, and the discoloration line is confirmed by the trend. If you are a day trader, you can choose to trade during a period of active trading, referring to the discoloration line as the basis for the next order, finger signal as a filter. If you are a trend trader, you can choose a period above H1, wait for the appearance of the finger signal in the key price area, and enter
To get access to MT4 version click   here . This is the exact conversion from TradingView: "Trendlines with Breaks" by LuxAlgo This is a REPAINT indicator. Buffers are available for processing.  However there are objects on chart to process also. All input fields are available.  Alerts are generated based on bars closure. You can message in private chat for further changes you need. Thanks for downloading
まず第一に、この取引インジケーターは再描画されず、再描画されず、遅延しないことを強調する価値があります。これにより、手動取引とロボット取引の両方に理想的なものになります。 アトミックアナリストは、価格の強さとモメンタムを利用して市場でより良いエッジを見つけるためのPA価格アクションインジケーターです。ノイズや誤ったシグナルを除去し、取引ポテンシャルを高めるための高度なフィルターを備えています。複雑なインジケーターの複数のレイヤーを使用して、アトミックアナリストはチャートをスキャンし、複雑な数学的計算をシンプルなシグナルと色に変換します。これにより、どのような初心者トレーダーでも理解して使用し、一貫した取引の決定を行うことができます。 「アトミックアナリスト」は、新規および経験豊富なトレーダー向けにカスタマイズされた包括的な取引ソリューションです。プレミアムインジケーターとトップノッチの機能を1つの取引戦略に組み合わせ、すべてのタイプのトレーダーにとって汎用性のある選択肢にします。 デイリートレーディングとスキャルピング戦略:高速で正確なデイトレーディングおよび短期トレード
トレンドサイド - トレンドを決定するためのテクニカル指標。これは、いくつかの本格的な取引戦略のセットです。このインジケーターは、高度なトレンド フィルタリング システムを使用し、統計パネルを備え、エントリー レベルとエグジット レベルを計算し、動的トレーリング ストップ レベルを計算します。あらゆるタイプのシンボルに適しており、シグナルと結果を再描画しません。プロのトレンド取引のための包括的なツール。 トレンド サイド インディケータのセットには、Andrews トレンド スキャナも含まれています - マルチ通貨およびマルチタイムフレーム トレンド スキャナ、通貨強度アナライザ、可能な反転の分析を備えたマルチタイムフレーム トレンド アナライザ。 3 つのトレンド アナライザーが 1 つの製品に組み込まれています。 インジケーターを購入した後、私に連絡して無料のアンドリュース トレンド スキャナー インジケーター キットを入手してください。 インジケーターとすべての追加パネルについては、完全な説明で詳しく説明されています。このマニュアルでは、インディケータ、すべての入力変数、お
Renko Gold
Ignacio Agustin Mene Franco
Renko Gold! clearly indicates the floors and ceilings where it goes from 4 lines, the line below that marks the floor in green confirming with the thinnest line clarifies the purchase entry, the same is for sale, the top line marks the ceiling and the thinnest red line marks the sale, This indicator works for all temporalities! For Forex and Synthetic Indices markets! It also works for crypto markets! Good profit! World Investor.
Advanced ideas of the popular MACD indicator: It detects and displays classic and reverse divergences (two methods of detecting divergences). It uses different color to highlight an uptrend and a downtrend. Two methods of determining a trend: а) MACD crosses the 0 level (classic signal); б) MACD crosses its own average (early signal). This is a multi-timeframe indicator: it can display MACD data from other timeframes. Two methods of drawing: classic histogram and line. It generates sound and vis
このプロダクトを購入した人は以下も購入しています
まず第一に、このトレーディングシステムがノンリペイント、ノンリドロー、ノンラグのインジケーターであることを強調する価値がある。これにより、手動取引とロボット取引の両方に理想的なものになっています。 「スマートトレンドトレーディングシステム MT5」は、新規および経験豊富なトレーダー向けにカスタマイズされた包括的なトレーディングソリューションです。10以上のプレミアムインジケーターを組み合わせ、7つ以上の堅実なトレーディング戦略を備えており、多様な市場状況に対応する多目的な選択肢となっています。 トレンドフォロー戦略:トレンドを効果的に乗り越えるための正確なエントリーとストップロス管理を提供します。 リバーサル戦略:潜在的なトレンドの反転を特定し、トレーダーがレンジ相場を活用できるようにします。 スキャルピング戦略:高速で正確なデイトレードおよび短期取引のために設計されています。 安定性:すべてのインジケーターはノンリペイント、ノンリドロー、ノンラグであり、信頼性の高いシグナルを保証します。 カスタマイズ:個々の取引の嗜好に合わせたカスタム戦略をサポートします。7つ以上の戦略と組み合わせ
FX Volume MT5
Daniel Stein
4.94 (17)
mql5と Telegramの モーニング・ブリーフィングで、詳細とスクリーンショットを含む毎日のマーケット・アップデートをご覧 ください! FX Volumeは、ブローカーの視点から市場のセンチメントをリアルに洞察する、最初で唯一の出来高インジケーターです。 ブローカーのような機関投資家が外国為替市場でどのようなポジションをとっているか、COTレポートよりもはるかに速く、素晴らしい洞察を提供します。 この情報をチャート上で直接見ることは、あなたの取引にとって真のゲームチェンジャーであり、画期的なソリューションです。 以下のようなユニークなマーケットデータ洞察から利益を得てください。 比率は 、通貨のロングポジションとショートポジションの比率をパーセントで表示します。 比率の変化は 、選択した期間内のロング比率とその変化率を表示します。 Volumes Totalは 、通貨の取引量(ロングとショート)の合計をロット単位で表示します。 Volumes Long :全通貨のロングポジションの取引量を表示します。 Volumes(ショート )は、全通貨のショートポジションの取引量を表示
ご紹介   クォンタム トレンド スナイパー インジケーターは 、トレンド反転を特定して取引する方法を変革する画期的な MQL5 インジケーターです。 13年以上の取引経験を持つ経験豊富なトレーダーのチームによって開発されました。     クォンタムトレンドスナイパーインジケーター   は、非常に高い精度でトレンドの反転を識別する革新的な方法で、あなたのトレーディングの旅を新たな高みに押し上げるように設計されています。 ***Quantum Trend Sniper Indicatorを購入すると、Quantum Breakout Indicatorを無料で入手できます!*** クォンタム ブレイクアウト インジケーターは、トレンドの反転を特定するとアラートを発し、矢印を示し、3 つのテイクプロフィットレベルを提案します。 初心者トレーダーにもプロのトレーダーにも適しています。 量子EAチャネル:       ここをクリック MT4のバージョン:       ここをクリック 推奨事項: 期間:すべての時間枠。最良の結果を得るには、M
Gold Stuff mt5
Vasiliy Strukov
4.89 (166)
Gold Stuff mt5 は、金専用に設計されたトレンド指標であり、あらゆる金融商品にも使用できます。 インジケーターは再描画せず、遅れません。 推奨時間枠 H1. 設定と個人的なボーナスを得るために、購入後すぐに私に連絡してください!   設定 矢印を描く - オンオフ。 チャートに矢印を描く。 アラート - 可聴アラートのオンオフ。 メール通知 - オンオフ。 電子メール通知。 プチ通知 - オンオフ。 プッシュ通知。 次に、色域を調整します。 Gold Stuff mt5 は、金専用に設計されたトレンド指標であり、あらゆる金融商品にも使用できます。 インジケーターは再描画せず、遅れません。 推奨時間枠 H1. 設定と個人的なボーナスを得るために、購入後すぐに私に連絡してください!   設定 矢印を描く - オンオフ。 チャートに矢印を描く。 アラート - 可聴アラートのオンオフ。 メール通知 - オンオフ。 電子メール通知。 プチ通知 - オンオフ。 プッシュ通知。 次に、色域を調整します。
トレンド スクリーナー インジケーターでトレンド取引の力を解き放ちます。ファジー ロジックと複数通貨システムを活用した究極のトレンド取引ソリューションです。 ファジー ロジックを活用した革新的なトレンド インジケーターである Trend Screener を使用して、トレンド取引を向上させます。 これは、13 を超えるプレミアム ツールと機能、および 3 つの取引戦略を組み合わせた強力なトレンド追跡インジケーターであり、Metatrader をトレンド アナライザーにする多用途の選択肢となります。 期間限定オファー : トレンド スクリーナー インジケーターは、わずか 50 ドルで生涯ご利用いただけます。 (元の価格 125$ ) (オファー延長) Trend Screener の 100% 非再描画精度の揺るぎない精度を体験して、取引の決定が過去の価格変動の影響を受けないようにしてください。 マルチタイムフレームおよびマルチ通貨機能の多用途性を解放し、比類のない自信を持って外国為替、商品、暗号通貨、インデックスの世界を取引できるようにします。 Trend Screener の包括的な
今、147ドル(いくつかの更新後に499ドルに増加します) - 無制限のアカウント(PCSまたはMac) RelicusRoad ユーザー マニュアル + トレーニング ビデオ + プライベート Discord グループへのアクセス + VIP ステータス 市場の新しい見方 RelicusRoad は、外国為替、先物、暗号通貨、株式、および指数の世界で最も強力な取引インジケーターであり、トレーダーに収益を維持するために必要なすべての情報とツールを提供します。初心者から上級者まで、すべてのトレーダーが成功するためのテクニカル分析と取引計画を提供します。これは、将来の市場を予測するのに十分な情報を提供する重要な取引指標です。意味をなさないチャート上のいくつかの異なる指標ではなく、完全な解決策を信じています.これは、信号、矢印 + 価格アクション情報を表示するオールインワンのインジケーターで、他に類を見ない非常に正確です。 強力な AI に基づいて、RelicusRoad は不足している情報とツールを提供して、あなたを教育し、トレーディングのプロ、成功したトレーダーにします。
まず第一に、この取引ツールはノンリペイント、ノンリドロー、ノンラグの指標であり、プロの取引に理想的ですことを強調する価値があります。 スマートプライスアクションコンセプトインジケーターは、新米から経験豊富なトレーダーまで、非常 に強力なツールです。Inner Circle Trader AnalysisやSmart Money Concepts Trading Strategiesなど、20以上の有用な指標を1つに組み合わせています。このインジケーターはスマートマネーコンセプトに焦点を当て、大手機関の取引方法を提供し、彼らの動きを予測するのに役立ちます。 特に、流動性分析に優れており、機関がどのように取引しているかを理解しやすくしています。市場のトレンドを予測し、価格の動きを慎重に分析するのに優れています。機関の戦略とトレードを合わせることで、市場の動向についてより正確な予測ができます。このインジケーターは多目的であり、市場構造を分析し、重要な注文ブロックを特定し、さまざまなパターンを認識するのに優れています。 このインジケーターはBOSやCHoCHなどのパターンの識
これはMT5のインジケーターで、再描画なしで取引に参入するための正確なシグナルを提供します。 外国為替、暗号通貨、金属、株式、インデックスなど、あらゆる金融資産に適用できます。かなり正確な見積もりを提供し、取引を開始して終了するのに最適な時期を教えてくれます。1つのシグナルを処理しただけでインジケーターの元が取れた例の 動画 (6:22)をご覧ください。Entry PointsPro インジケーターの助けを借りたほとんどのトレーダーの最初の1週間の結果が改善しています。 Telegramグループ に登録してください。Entry Points Proインジケーターのメリットは次の通りです。 再描画のないエントリーシグナル 再描画されるインジケーターでは一度表示されたシグナルが削除されて大きな金銭的損失につながることがありますが、これと異なり、表示されて確認されたシグナルは消えることがありません。 エラーなしの取引開始 インジケーターアルゴリズムによって取引を開始する(資産を売買する)理想的な瞬間を見つけることができます。それを使用するすべてのトレーダーの成功率が向上します。
mql5と Telegramの モーニング・ブリーフィングで、詳細とスクリーンショットを含む毎日のマーケット・アップデートをご覧 ください! FX Power MT5 NGは 、長年の人気を誇る通貨強度計FX Powerの次世代モデルです。 この次世代ストレングスメーターは何を提供するのでしょうか?初代FXパワーの魅力すべて プラス GOLD/XAUの強さ分析 より正確な計算結果 個別に設定可能な分析期間 カスタマイズ可能な計算上限値により、さらに優れたパフォーマンスを実現 もっと見たい人のための特別なマルチインスタンス設定 すべてのチャートでお好みの色を無限に設定可能 数え切れないほどの通知オプションにより、重要なことを見逃すことはありません。 Windows 11とmacOSのスタイルで角を丸くした新しいデザイン 魔法のように動くインジケーターパネル FXパワーの主な機能 すべての主要通貨の強さの完全な履歴 すべての時間枠における通貨の強さの履歴 すべてのブローカーとチャートで同一の計算結果 100%信頼できるリアルタイム計算 -> リペイントなし ドロップダウン・リストから
現在33%オフ 初心者にもエキスパートトレーダーにも最適なソリューション このインジケーターは独自の機能と新しい公式を多数内蔵しており、ユニークで高品質かつ手頃な取引ツールです。このアップデートでは、2つの時間枠ゾーンを表示できるようになります。より長いTFだけでなく、チャートTFとより長いTF(ネストゾーンを表示)の両方を表示できます。すべてのSupply Demandトレーダーの皆さんのお気に召すはずです。:) 重要情報の公開 Advanced Supply Demandの可能性を最大化するには、 https://www.mql5.com/ja/blogs/post/720245 にアクセスしてください。   エントリーまたはターゲットの正確なトリガーポイントを正確に特定できれば取引がどのように改善されるか想像してみてください。新しい基盤となるアルゴリズムに基づいて構築されているため、買い手と売り手の間の潜在的な不均衡をさらに簡単に特定できます。これは、最も強い需要と供給のゾーンと、過去のパフォーマンス(古いゾーンを表示)がグラフィカルに表現されるためです。これらの機能は、最適
Auto Order Block with break of structure based on ICT and Smart Money Concepts Futures Break of Structure ( BoS )             Order block ( OB )            Higher time frame Order block / Point of Interest ( POI )    shown on current chart           Fair value Gap ( FVG ) / Imbalance   ,  MTF      ( Multi Time Frame )    Volume Imbalance     ,  MTF          vIMB Gap’s Equal High / Low’s     ,  MTF             EQH / EQL Liquidity               Current Day High / Low           HOD /
Step into the realm of Forex trading with confidence and precision using XQ, a cutting-edge Forex indicator designed to elevate your trading game to unprecedented heights. Whether you're a seasoned trader or just stepping into the world of currency exchange, XQ Forex Indicator empowers you with the insights and signals needed to make informed trading decisions. The signal conditions are a combination of three indicators, and XQ Forex Indicator only display  medium and long-term trends . The ind
ICT, SMC, SMART MONEY CONCEPTS, SMART MONEY, Smart Money Concept, Support and Resistance, Trend Analysis, Price Action, Market Structure, Order Blocks, BOS/CHoCH,   Breaker Blocks ,  Momentum Shift,   Supply&Demand Zone/Order Blocks , Strong Imbalance,   HH/LL/HL/LH,    Fair Value Gap, FVG,  Premium  &   Discount   Zones, Fibonacci Retracement, OTE, Buy Side Liquidity, Sell Side Liquidity, BSL/SSL Taken, Equal Highs & Lows, MTF Dashboard, Multiple Time Frame, BigBar, HTF OB, HTF Market Structure
Was: $299  Now: $99   Supply Demand uses previous price action to identify potential imbalances between buyers and sellers. The key is to identify the better odds zones, not just the untouched ones. Blahtech Supply Demand indicator delivers functionality previously unavailable on any trading platform. This 4-in-1 indicator not only highlights the higher probability zones using a multi-criteria strength engine, but also combines it with multi-timeframe trend analysis, previously confirmed swings
ブレーカートレーダーになり、価格が反転すると市場構造からの利益が変化します。 注文ブロックブレーカーインジケーターは、トレンドまたは価格の動きが枯渇に近づいており、逆転の準備ができていることを識別します。通常、反転または大規模なプルバックが発生しようとしているときに発生する市場構造の変化について警告します。 この指標は、ブレイクアウトと価格の勢いを識別する独自の計算を使用します。使い果たされる可能性のあるポイントの近くで新しい高値が形成されるたびに、インディケーターはその高値の作成を担当する最後の注文ブロックを描きます。次に、移動する価格とともに注文ブロックを追跡します。その後、価格が反対方向にシフトし、その注文ブロックを突破すると、新しい市場構造を作成し、トレンドまたは大きな後退の可能性のある反転の開始を警告します。 注文ブロックは、高値/安値が作成される前の最後の反対色のろうそくであり、価格がこれらの重要な領域を下抜けすると、トレンドの短期的ま​​たは長期的な反転の兆候です。 特徴 重要な枯渇点での市場構造の変化を警告します 価格が使い果たされるレベルに近づくと、
Gannスクエアインジケーターは、W.D. Gannによって執筆された「市場予測のための数学的な式」の記事に基づく強力な市場分析ツールです。このツールは、解析に数学的な概念を応用し、Gann理論に基づいています。それは、144、90、52のスクエアや9のスクエアなど、Gannの関連テクニックの要素を取り入れています。さらに、の方法を組み込んでおり、9のスクエアとその関連性についてのチャネルやスターパターンに焦点を当てています。 ユーザーマニュアルと使用方法: このインジケーターを使用する前に、ユーザーマニュアルを読んで疑問点を解決するためにお問い合わせいただくことをお勧めします。ユーザーマニュアルの完全版は、当社のウェブサイトで入手できます。 MT5の完全版は購入できますし、MT4の無料版も試すことができます。両方のバージョンへのリンクを提供していますので、ご利用ください。 主な機能と機能: Gannスクエアインジケーターは、市場分析のための完全なツールセットを提供し、幾何学的な概念とGann理論に基づいて的確な判断を行う手助けをします。以下に主な機能を示します。 9のスクエアの分析:
AW Trend Predictor MT5
AW Trading Software Limited
4.76 (54)
1 つのシステムでのトレンド レベルとブレイクダウン レベルの組み合わせ。高度なインジケーター アルゴリズムは、市場のノイズをフィルター処理し、トレンド、エントリー ポイント、および可能なエグジット レベルを決定します。インジケーターシグナルは統計モジュールに記録されるため、最適なツールを選択してシグナル履歴の有効性を示すことができます。この指標は、テイクプロフィットとストップロスのマークを計算します。 マニュアルと説明書 ->   ここ / MT4 バージョン ->   ここ インジケーターで取引する方法: Trend Predictor での取引は、たった 3 つの簡単なステップです。 ステップ 1 - ポジションを開く 70% 以上の成功率で買いシグナルが受信されました ステップ 2 - ストップロスの決定 逆信号でトランクを選択 ステップ 3 - テイクプロフィット戦略の定義 戦略 1: TP1 に到達したらポジション全体をクローズする 戦略 2: TP1 に達した時点でポジションの 50% をクローズし、TP2 に達した時点で残りの 50% をクローズします。 戦略 3:
The Volume by Price Indicator for MetaTrader 5 features Volume Profile and Market Profile TPO (Time Price Opportunity). Get valuable insights out of currencies, equities and commodities data. Gain an edge trading financial markets. Volume and TPO histogram bar and line charts. Volume Footprint charts. TPO letter and block marker charts including split structures. Versatile segmentation and compositing methods. Static, dynamic and flexible ranges with relative and/or absolute visualizations. Lay
TrendLine PRO MT5
Evgenii Aksenov
4.78 (49)
The Trend Line PRO indicator is an independent trading strategy. It shows the trend change, the entry point to the transaction, as well as automatically calculates three levels of Take Profit and Stop Loss protection Trend Line PRO is perfect for all Meta Trader symbols: currencies, metals, cryptocurrencies, stocks and indices Advantages of Trend Line PRO Never redraws its signals The possibility of using it as an independent strategy It has three automatic levels Take Profit and Stop Loss lev
MetaBands M5
Vahidreza Heidar Gholami
4.67 (3)
MetaBandsは、強力でユニークなアルゴリズムを使用してチャンネルを描画し、トレンドを検出して、トレーダーに取引の入出ポイントを提供することができます。チャンネル指標に加えて、強力なトレンド指標でもあります。入力パラメータを使用して新しいチャンネルを作成するために、異なるタイプのチャンネルを統合することができます。MetaBandsは、市場のイベントについてユーザーに通知するために、すべてのタイプのアラートを使用します。 特徴 ほとんどのチャンネルアルゴリズムをサポート 強力なトレンド検出アルゴリズム 異なるタイプのチャンネルを統合する能力 マルチタイムフレームおよびマルチカレンシー(シグナルマトリックス) すべてのタイプのアラート機能(サウンド、画面フラッシャー、プッシュ通知、メール、ポップアップ、矢印) 再描画しない トレンド検出 MetaBandsは、チャネル内を振動する青いラインを使用してトレンドを検出します。ラインがチャネルの上部バンドに達すると、下降トレンドの開始を示し、下部バンドに達すると上昇トレンドの開始を示します。青いラインが中心ラインに近づくと、市場はコンソ
ご紹介     Quantum Breakout PRO は 、ブレイクアウト ゾーンの取引方法を変革する画期的な MQL5 インジケーターです。 13年以上の取引経験を持つ経験豊富なトレーダーのチームによって開発されました。     クォンタム ブレイクアウト プロ   は、革新的でダイナミックなブレイクアウト ゾーン戦略により、あなたのトレーディングの旅を新たな高みに押し上げるように設計されています。 クォンタム ブレイクアウト インジケーターは、5 つの利益ターゲット ゾーンを備えたブレイクアウト ゾーン上のシグナル矢印と、ブレイクアウト ボックスに基づいたストップロスの提案を提供します。 初心者トレーダーにもプロのトレーダーにも適しています。 量子EAチャネル:       ここをクリック 重要!購入後、インストールマニュアルを受け取るためにプライベートメッセージを送ってください。 推奨事項: 時間枠: M15 通貨ペア: GBPJPY、EURJPY、USDJPY、NZDUSD、XAUUSD アカウントの種類: ECN、Raw、またはス
Gartley Hunter Multi - An indicator for searching for harmonic patterns simultaneously on dozens of trading instruments and on all classic timeframes: (m1, m5, m15, m30, H1, H4, D1, Wk, Mn). Manual (Be sure to read before purchasing) | Version for MT4 Advantages 1. Patterns: Gartley, Butterfly, Shark, Crab. Bat, Alternate Bat, Deep Crab, Cypher 2. Simultaneous search for patterns on dozens of trading instruments and on all classic timeframes 3. Search for patterns of all possible sizes. Fr
トレンドラインマップインジケーターは、トレンドスクリーナーインジケーターのアドオンです。トレンドスクリーナー(トレンドラインシグナル)によって生成されたすべてのシグナルのスキャナーとして機能します。 これは、トレンドスクリーナーインジケーターに基づくトレンドラインスキャナーです。 Trend Screener Pro インジケーターがない場合、Trend Line Map Proは機能しません。 It's a Trend Line Scanner based on Trend Screener Indicator. If you don't have Trend Screener Pro Indicator,     the Trend Line Map Pro will not work . ブログにアクセスすると、トレンドラインマップインジケーターの無料バージョンをダウンロードできます。 Metatrader Testerの制限なしで、購入する前に試してみてください。 :  ここをクリック 1.簡単になる利点 通貨と時間枠に基づいて売買シグナルを表示し
TrendDecoder Premium MT5
Christophe, Pa Trouillas
5 (1)
レンジと次の動きを特定     |    トレンドの最も早いシグナルと強さを得る     |    反転の前に明確な出口を得る     |    価格がテストするフィボ・レベルを見つける。   |  非リペイント、非遅延インディケータ - マニュアルおよび自動売買に最適 - すべての資産、すべての時間単位に対応 - 発売記念50%割引   - その後 149 ドルに戻る 購入後、 推奨セッティングについては、このチャンネルで私に連絡してください。 MT4 バージョン: ここをクリック BladeSCALPER と PowerZONES を使った完全な方法を入手する どのようなものですか? TrendDECODERは、トレンド監視をシンプルかつ簡単にするための複数のイノベーションを集約したものです。 Projective TrendLine (投影トレンドライン) - 今後のトレンドのスピードリファレンス RealTime TrendLine vs. Projective TrendLine (リアルタイムトレンドライン vs. Projective Tren
TPSpro TRENDPRO  - is a trend indicator that automatically analyzes the market and provides information about the trend and each of its changes, as well as giving signals for entering trades without redrawing! The indicator uses each candle, analyzing them separately. referring to different impulses - up or down impulse. Exact entry points into transactions for currencies, crypto, metals, stocks, indices!  -  Version MT4                  DETAILED DESCRIPTION        /       TRADING SETUPS       
Was: $249  Now: $99   Market Profile defines a number of day types that can help the trader to determine market behaviour. A key feature is the Value Area, representing the range of price action where 70% of trading took place. Understanding the Value Area can give traders valuable insight into market direction and establish the higher odds trade. It is an excellent addition to any system you may be using. Inspired by Jim Dalton’s book “Mind Over Markets”, this indicator is designed to suit the
Golden Spikes Detector This indicator is based on an advanced strategy primarily for trading spikes on Boom and Crash Indices. Complex algorithms were implemented to detect high probability entries only. It alerts on potential Buy and Sell entries. To trade spikes on the Deriv or Binary broker, only take Buy Boom and Sell Cash alerts. It was optimised to be loaded on 5-minute timeframe although multiple timeframe analysis is done in the background. Features ·             Desktop pop up and sound
Matrix Arrow Indicator MT5
Juvenille Emperor Limited
5 (14)
マトリックスアローインジケーターMT5は、すべてのシンボル/商品(外国為替、商品、暗号通貨、インデックス、株式)で使用できる100%再描画されていないマルチタイムフレームインジケーターに続くユニークな10in1トレンドです。マトリックスアローインジケーターMT5は、初期段階で現在のトレンドを判断し、最大10の標準インジケーターから情報とデータを収集します。 平均方向移動指数(ADX) 商品チャネルインデックス(CCI) クラシック平研アシキャンドル 移動平均 移動平均収束発散(MACD) 相対活力指数(RVI) 相対力指数(RSI) 放物線SAR ストキャスティクス ウィリアムズのパーセント範囲 すべてのインジケーターが有効な買いまたは売りシグナルを与えると、対応する矢印がチャートに印刷され、次のろうそく/バーの開始時に強い上昇トレンド/下降トレンドを示します。ユーザーは、使用するインジケーターを選択し、各インジケーターのパラメーターを個別に調整できます。マトリックスアローインジケーターMT5は選択されたインディケーターからのみ情報を収集し、それらのデータのみに基づいてアローを印
IX Powerは 、FX Powerの無敵の精度をついにFX以外のシンボルにも提供します。 お気に入りの指数、株式、コモディティ、ETF、さらには暗号通貨の短期、中期、長期のトレンドの強さを正確に判断します。 お使いの端末が提供する すべてを分析する ことができます。ぜひお試しいただき、取引 タイミングが大幅に改善 されることをご体験ください。 IXパワーの主な特徴 100%正確で再描画されない計算結果 - ターミナルで利用可能なすべての取引シンボルに対して 予め設定され、さらに個別に設定可能な強度分析期間のドロップダウン選択 Eメール、メッセージ、モバイル通知による無数の通知オプション EAリクエストのためのアクセス可能なバッファ カスタマイズ可能な計算制限により、さらに優れたパフォーマンスを実現 もっと見たい人のための特別なマルチインスタンス設定 すべてのチャートでお好みの色を無限に設定可能 Windows 11とmacOSのスタイルで角を丸くした新しいパネルデザイン サブ・ウィンドウとメイン・チャートの間をシームレスに移動する、魔法のように動くイン
** All Symbols x All Timeframes scan just by pressing scanner button ** ***Contact me after purchase to send you instructions and add you in "123 scanner group" for sharing or seeing experiences with other users. After 15 years of experience in the markets and 3 years of programming, Winner indicator is ready. I would like to share with you! Introduction The 123 Pattern Scanner indicator with a special enhanced algorithm is a very repetitive common pattern finder with a high success rate . Inte
作者のその他のプロダクト
DYJ Cashregistereaは、DYJ技術指標に取り組みます。市場が強いとき このEAの発見は、安全市場での機会と貿易です。取引の安全な時間による一貫した収益。 EAはトランザクション・ボリュームを最小にして、利益閉鎖アルゴリズム戦略を最大にするために1オーダ・モードを使用します。 いいえグリッド取引。 裁量はない。 ヘッジなし。 マルチンゲール Please download the setting file and the PDF file of the back test report in the product comment area Recommendations Broker Deriv. Developed for M1, Crash 500 Index.  Backtest: Deposit $100 DD=0.53%  15 Months Profits= $30069 Developed for M1, Crash 500 Index.  Backtest: Deposit $100 DD=2%    15 Months Profi
This StrongCurrency is a complete trading system based on a variety of technical indicators, moving averages and pivots. Each of those elements can be assessed in defined rules and coefficients (depending on the indicator) providing limitless optimization scenarios for the StrongCurrency. In order to work the StrongCurrency creates a trend strength and entry point signal list display by evaluating these data, that takes data from all symbols. It extrapolates all the information in order to get t
DYJ Follow Me   is an EA that follows the virtual transaction record of any dyj indicator to actually open and close positions. It can display the name and status of the indicator of the single signal source; At present, it is only the   DYJ SignalSourceOfWPR MT5   indicator, and more indicators will be expanded in the future. It can receive real-time trend direction of indicator. It can receive the latest admission time of the indicator. It can receive the latest admission price of
DYJ撤去計画はトレンド転換取引システムで、トレンド転換点で倉庫と平倉を開けることができる。 いかなる経典商に適用されるいかなる記号:外国為替やその他の品種(例えば、仲介人の変動指数。 ) これは基礎的なTP、SL、グリッド間隔とTPSL利益と最低取引量の保証金を示し、倉庫を開設した後、各品種の利益を示すことができ、各品種に自動目標利益追跡機能があり、全体目標利益追跡機能もある。 また、人手取引アシスタント機能を有しており、独立した人手取引を行うことも、EAと混合して取引することもできる。 取引のヘッジ機能も備えています 手動取引やEA自動取引の場合、方向が間違っているので、戦略を解くことで損失注文を利益注文に変えることができます EAは設定で注文モードを使用できます。 DYJ払戻し計画は資金管理システムに基づいて払戻し計画を指定することができる。 日黒字、周黒字、月黒字の3つのパターンでお金を引き出すことができます。 各パターンは指定した抽出比率で利益を抽出できます。 私たちはあなたに実盤口座で模擬出金をさせることができます。 定期的な払戻しは私たちの利益を段階的に受け
The  DYJ WPR - SignalSource is based on  WPR  indicator. It can be used for any currency pair and timeframe. The  WPR  recommends  Indicator values ranging between 80 and 100% indicate that the market is oversold. Indicator values ranging between 0 and 20% indicate that the market is overbought. The entry signal of this indicator is a turning point in the trend. The indicator uses analog trading technology, Provide you with indicators to evaluate the overall profit of the opening signal and c
This QuickClose help you to close all orders having profit immediately with only ONE CLICK, its work is very fast. You can choose which symbol you want or close all symbols so it will helpful for you in your trading to manage trading faster. This EA can quick close all Buy and Sell Orders by a selected symbol or total. This SymbolButton is designed for closing orders. There is available Manual and Automatic closing functions. Automatic closing function will close the orders according the paramet
Professional traders know that a reversal in market price is the best entry points to trade. The trend changes K line state changes the most obvious. The SoarSignal is good to identify these changes, because we have incorporated the KDJ indicators. It is the closest to the K line state of the indicators. The two lines of KDJ Winner move within a range of 0 and 100. Values above 80 are considered to be in overbought territory and indicate that a reversal in price is possible. Values below 20 are
このPowerSignalは、テクニカル指標のATRに基づく完全な取引システムです。これらの指標は、分析されたすべての時間枠と通貨ペアにおける各POWERTRENDの現在のステータスを記録します。 PowerSignalは、これらのデータを評価することにより、トレンド強度とエントリポイント信号リストの表示を作成します。いずれかのペアに完全な一致がある場合、そのような場合を示すアラートがポップアップ表示されます。リストデータには、Symbol、M5-MN1、BuyPercent、SellPercent、LastEntryが含まれます。 LastEntryは、エントリポイント(期間、価格、時間)を表示します。トレンド強度が75%を超える場合、それは強い通貨ペアであると見なされます。 Inputs Value Periods = 14 - indicators Periods. Text color = White - Normal text color. Buy Signal color = LawnGreen - Long signal color. Sell signal c
This indicator shows the crossing between two moving averages, a slower and faster moving average. Signal show alert pop-up, when MA1 crosses above the MA2. Signal show alert pop-up, when MA1 crosses below the MA2. Inputs Value Fast MA Setup Period = 5 - period of Faster Moving Average (value 5). Mode = SMA - type of Moving Average (SMA, EMA, SMMA, LWMA). Price = Close - type of price (Close, Open, Low, High, Median, Typical, Weighted). Slow MA Setup Period = 10 - period of Slower MA (value 10
This EA is based on the classical trend-following system of opening the positions. The EA is based on DYJ TwoMACrossAlarm and ATR and CCI indicator. It uses two moving averages. The EA uses dynamic allocation MA period. The MA1 and MA2 period is the Fibonacci sequence, such as 5.8 or 13.21 or 21.34 or...; EA Entry Rules: Go long when fast MA1 crosses above the slow MA2 and CCI crosses above the zero line; Go short when fast MA1 crosses below the slow MA2 and CCI crosses below the zero line; the
DYJニュース外貨工場はカレンダー取引ツールとマクロ経済事件の基本的な市場分析指標である。 ここでは、世界最大の経済ブロックの金融ニュースと指標を見つけることができます。アメリカとeuからオーストラリアと日本まで、合計9つの経済ブロックがあり、60以上の通貨ペアが関係しています。 公共ソースからリアルタイムで800以上のマクロ経済指標と事件を収集する。 各指標には、履歴、現在値と予測値、および重要性の特徴があります。 また、このサービスは大量の履歴データをグラフと表の形で保存します。 指標の右側の動的な緑色の矢印は、前回のイベントの発生を示し、その通貨のデータ分析結果、良し悪しを示します。 結果から通貨ペアの数と空を判断できます インジケータの左側にある黄色のアスタリスクは、次に起こるイベントを示しています。 インジケータの時系列列には、各時点のイベントオブジェクトが表示されます。 インジケータには電子メールとプッシュ通知機能があります。 All currency pairs GBPUSD, EURUSD, USDJPY, USDCHF, USDCAD, GBPJ
This indicator shows the crossing between three moving averages (slower, middle and faster ones). When fast MA crosses up middle MA and middle MA crosses up slow MA, the bullish alert is issued. When fast MA crosses down middle MA and middle MA crosses down slow MA, the bearish alert is issued. Signals to close buy positions are generated if fast MA crosses middle MA downwards, signals to close sell positions are generated if fast MA crosses middle MA upwards. Inputs Fast MA Setup MAPeriod1 =
The Expert Advisor is based on three Moving Average indicators. ThreeMACross is based on the following idea: crossing of three Moving Average lines (Fast, Middle and slow ones) is used as a signal for opening and closing a position together. Go Long when Fast MA (MA1) crosses above Middle MA (MA2), and Middle MA (MA2) crosses above Slow MA (MA3). Go Short when Fast MA (MA1) crosses below Middle MA (MA2), and Middle MA (MA2) crosses below Slow MA (MA3). Signals to close buy positions are generate
The RiseTrading is a unique High quality and easy to use and affordable trading tool because we have incorporated a number of proprietary features and PowerSignal and MACD and Stochastic indicators. The main advantages of the trend trading strategy used by the Expert Advisor are opening positions only in the direction of a trend, ability for the long-term retention of profitable positions allowing users to achieve good combinations of profit/loss distributions. That can work on a real account at
DYJ株式コントローラは全通貨株式取引システムである M1からMNまでの各通貨ペアのランダムな値を表示できます 1サイクルのStoch値がスーパーエリアとスーパーエリアに到達すると、色のヒントがあります これらの情報に基づいて正しい取引をすることができます 「DYJ在庫管理者」という在庫指標テンプレートを作成して保存してください。 スーパーストアまたはスーパーストアをマウスでクリックすると、対応する通貨ペアのサイクルマップが自動的に開き、Stoch指標がロードされます。 INPUT InpPairs                      = "GBPUSD,EURUSD,USDJPY,USDCHF,XAUUSD,USDCAD,GBPJPY,EURJPY,EURGBP,EURAUD,EURNZD,EURCAD,CADJPY,AUDUSD,AUDNZD,AUDCAD,AUDJPY,NZDJPY,NZDUSD,NZDCAD,GBPAUD,GBPNZD,GBPCAD,CHFJPY,NZDCHF,AUDCHF,EURCHF";     InpStrategyMinTimeFrame 
The DYJ SoarTrading is based on SoarSignal indicator. It can be used for any currency pair and timeframe. Signals to buy are generated when SoarSignal has crossed oversold downwards, reached oversold and then crossed back up through oversold. Signals to sell are generated when SoarSignal has crossed overbought upwards, reached overbought, and then crossed back down through overbought. Close a trade when SoarSignal reaches the opposite side ( overbought for long order, oversold for short order).
DYJ Sharp advanced algorithm that detects new trends and current trend continuations for use as an entry and exit strategy. The strategy display the SHARP trend demarcation area. This SHARP area has high HighLine and low LowLine. Falling of high below HighLine of SHARP and then falling of close below LowLine of SHARP can be interpreted as a signal to sell. Rising of close above HighLine of SHARP and then rising of low above LowLine of SHARP can be interpreted as a signal to buy. The signal for e
DYJ TRENDWAVE features an advanced algorithm that detects new trends and current trend continuations for use as an entry strategy. DYJ TRENDWAVE's volatility is based on the power of buyers and sellers, it grabs total body size of candles and identifies the battle between buyers and sellers as a percentage of the total volume, like Sellers: (-)100% and Buyers: (+)100%. This information can be used for any entry and exit strategy. For bullish/Long Pin bar it is below the price line, for bearish/S
DYJTRENDWAVE features an advanced algorithm that detects new trends and current trend continuations for use as an entry strategy. DYJTRENDWAVE's volatility is based on the power of buyers and sellers, it grabs total body size of candles and identifies the battle between buyers and sellers as a percentage of the total volume, like Sellers: (-)100% and Buyers: (+)100%. This information can be used for any entry and exit strategy. For bullish/Long Pin bar it is below the price line, for bearish/Sho
DYJ Scalpingは完全に自動化された専門家のアドバイザーです。 確率インジケータフィルタはエントリに使用されます。アドバイザーにはヘッジやECNのアカウントタイプが必要です。 オーダーロスはゲームで救済され利益になる。順序が間違っているならば。 いつでも無効にすることができますゲームの戦略。 一般勧告 お勧めのECNのアカウントは、Xauusdスプレッド8と11の間に、ユーリッッドスプレッド1 最低保証金は$ 200です。 Please download the xauusd and EURUSD settings file in the product comments area 入力パラメータ InpLotsRisk                = 0.002  -- Lots Risk x% risk 0.002% If the balance is $10000 and 500 leverage risk 0.1%  If the balance is $100 or $200 and 500 leverage rsik 0.008%, If the balan
DYJ T3ModeMAはT3アルゴリズムに基づく。 T3アルゴリズムは、米国雑誌「TASC」が発表した記事「より良い移動平均線」で技術分析分野に導入された。 T3価格序列を平滑化しながら、トレンド追跡システムの遅れを減らすことができる。 指標の柱線の大きさによって入場信号が決まり、柱線の大きさが0に近づいたときがトレンドの転換点である。 この指標はシミュレーション取引技術を用いて、 開盤信号と終盤信号の全体的な利益を評価する指標を提供します。 どの評価モデルで取引しても便利です。 最大利益モデル評価モデルを選択すると、 トラッキングストップ機能を使用することをお勧めします。 これにより、トレンド利益を最大限に追跡できます。 逆の信号オフ評価モードを選択した場合、 向こうの信号が出てから平倉に入るのを辛抱強く待つことをお勧めします。 これはトレンドが本格的に終わり、利益が出るのをずっと待つことができます。 指数の開倉と平倉に自動的に従う必要がある場合は、ユーティリティをダウンロードしてください DYJ Follow Me Input [Indicator] InpM
DYJ Long term Strategy EAはロングライン取引システムである 私たちはろうそくの中で最低価格を探して多頭トレンドとして始まり、最高価格の空頭トレンドを探して始まり、私たちは最長時間で倉庫を持ち、最大の利益を得ることができます。 注文の方向が間違っている場合、戦略は黒字に転換することができます。 EAは1つの通貨対グラフの任意の周期でのみ実行されます Signal URL INPUT InpMagicNumber = 8257 InpIsDisplayInterface = true InpEAComment = LTS InpRStrategyTimeFrame = 1 Day InpLotsRisk = 0.0002 -- Lots Risk x%,default 0.002% if blance is 10000$ InpLots = 0.01 -- fixed lot [0-->Auto] InpMaxSpread = 100 Maxtrades = 1 InpDirection = Both InpFristOrderStep = 200 In
The DYJBands opens and closes positions using Bollinger Bands signals: It performs trades after a price rebound from the borderlines of the indicator. It has the option to close positions by an opposite signal, by take profit and stop loss, move a trade to breakeven upon reaching the central Bollinger band or after a certain price movement. By default, the EA is configured for trading the GBPUSD currency pair on the H1 timeframe. Also, settings for the EURUSD, USDJPY, USDCAD and XAUUSD currency
The DYJ MacdSto is a unique High quality and easy to use and affordable trading tool because we have incorporated a number of proprietary features and MACD and Stochastic and RSI and ADX indicators. The main advantages of the trend trading strategy used by the Expert Advisor are opening positions only in the direction of a trend, ability for the long-term retention of profitable positions allowing users to achieve good combinations of profit/loss distributions. DYJ MacdSto EA uses MACD and Stoch
This StrongCurrency is a complete trading system based on a variety of technical indicators, moving averages and pivots. Each of those elements can be assessed in defined rules and coefficients (depending on the indicator) providing limitless optimization scenarios for the StrongCurrency. In order to work the StrongCurrency creates a trend strength and entry point signal list display by evaluating these data, that takes data from all symbols. It extrapolates all the information in order to get t
The DYJ TrendPending EA tracks the new change of price of the currency pair and opens trades in case of a price low and high from the main movement in the direction of the trend. So EA uses the least risky grid and Add lots. And can attach a positive and reverse pending order. The PositivePending orders can reduce the number of grids and Add lots,  while ReversePending orders reduce the loss of orders . For more convenient search, the working timeframe has been added to inputs (Work timeframe).
This is a multi-currency and multi-strategy EA. This EA is to create one or more polling trading strategies in a transaction. In the polling mode, the strategies filter a trend-free range market environment and trades are placed in the opposite direction at the edges of the range. With an additional main trend filter in the trend-following mode, the DYJ's ArtOfForexWar can also trade pull-backs during trends in the trend of loss. The winning rate is more than 95% within three orders or three cl
DYJ Scalpingburg EAは完全に自動化された専門家のアドバイザーです。 BURGアルゴリズムフィルタはエントリに使用されます。アドバイザーにはヘッジやECNのアカウントタイプが必要です。 オーダーロスはゲームで救済され利益になる。順序が間違っているならば。 いつでも無効にすることができますゲームの戦略。 一般勧告 お勧めのECNのアカウントは、Xauusdスプレッド8と11の間に、ユーリッッドスプレッド1 最低保証金は$ 200です。 製品コメントエリアでXauusdとEURUSD設定ファイルをダウンロードしてください Input Parameters [Burg] MinProfit                  =  160 -- Open positions if predicted profit >= MinProfit PastBars                   =  200     --   Number of past bars ModelOrder              =  0.37     --   Order of Burg m
DYJ ArtOfMakingMoney attempts to gauge bullish and bearish forces in the market by using two separate measures, one for each type of directional pressure. The  EA's BearsIndex  attempts to measure the market's appetite for lower prices The EA's BullsIndex attempts to measure the market's appetite for higher prices Features Monitors all pairs at the same time. The EA monitors the top 35 pairs by default, but you can select less pairs if you wish. It is a multi-currency EA that can be run from a
私たちの目標は、アクセス可能で質の高いサービスを提供し、市場参加者、トレーダー、アナリストに、情報に基づいたタイムリーな取引決定のための非常に必要なツールを提供することです。 最も最適化された、非常に堅牢で使いやすいDYJトレンドアナリストインジケーター。 DYJトレンドアナリストは、方向性圧力のタイプごとに1つずつ、2つの別々の測定値を使用して、市場の強気と弱気の力を測定しようとします。 指標のBearsIndexは、低価格に対する市場の欲求を測定しようとします。 指標のBullsIndexは、より高い価格に対する市場の欲求を測定しようとします。 DYJトレンドアナリスト向けのピボットポイント追加インジケーター。 当社のピボットポイントインジケーターは、ピボットポイントとサポートおよびレジスタンスレベルを計算する高度なアルゴリズムに基づいています。 将来の重要な価格レベルと起こりうる市場の逆転の信じられないほど正確な予測。 すべての市場(外国為替、商品、株式、指数など)と時間枠に役立ちます。 特徴 すべてのペアを同時に監視します。 インジケー
フィルタ:
レビューなし
レビューに返信
バージョン 1.2 2023.08.24
optimize code