• 概要
  • レビュー
  • コメント (1)

MP Candle Countdown for MT4

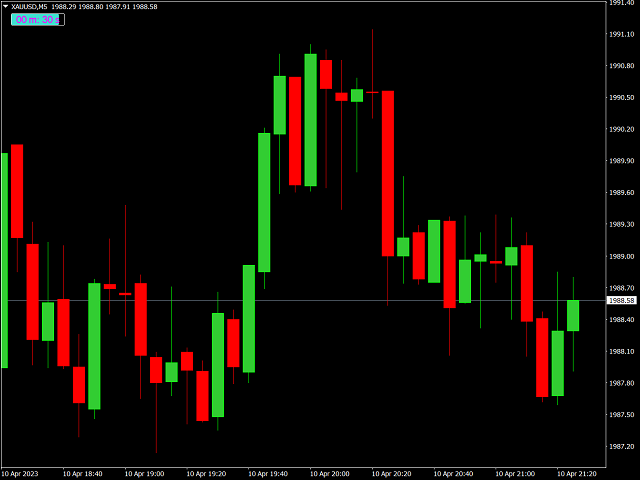
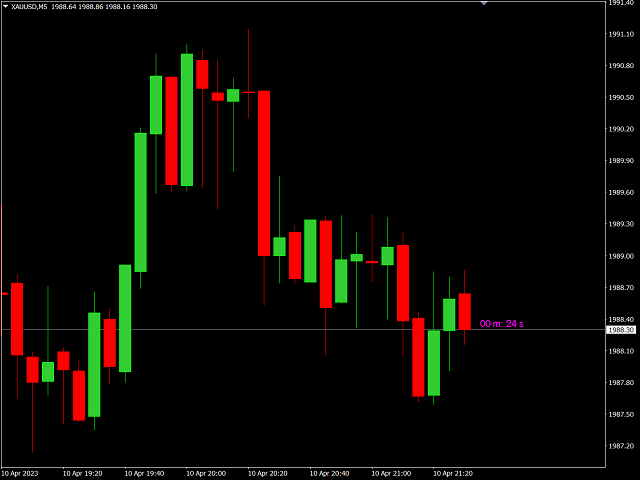
MP Candle Countdown indicator with a progress bar is a tool used in technical analysis that displays the time remaining until the current candlestick on a chart closes, along with a progress bar that shows visually the amount of time that has elapsed since the candlestick opened.

This indicator can be helpful for traders who use candlestick charting to make trading decisions, as it provides both a visual representation of the time left until a candlestick closes and an indication of how much time has already passed.
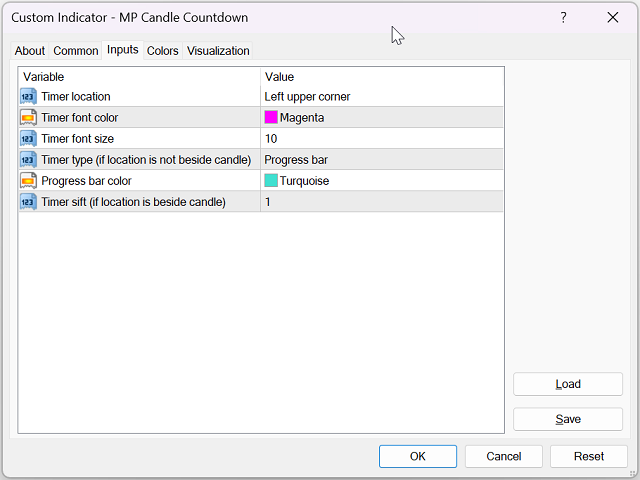
Settings:

  • Timer location
  • Timer font color
  • Timer font size
  • Timer type (if location is not beside candle)
  • Progress bar color
  • Timer shift (if location is beside candle)

#Tags: Candle Timer, Candle Countdown, Candle Close, Remaining Time, Closing Time

___________________________________________________________________________________

Disclaimer:
Do NOT trade or invest based upon the analysis presented on this channel. Always do your own research and due diligence before investing or trading. I’ll never tell you what to do with your capital, trades or investments. I’ll also never recommend for you to buy, sell, long or short any asset, commodity, security, derivative or cryptocurrency related instrument as it's extremely HIGH RISK! You should always consult with a professional/licensed financial adviser before trading or investing in any type of assets.

おすすめのプロダクト
Oscillator helps determine the direction of the market Shows the direction of the price movement and is painted in the appropriate color. Allows you to conduct trend and counter trend trading It works on all timeframes, on any currency pairs, metals and cryptocurrency Can be used when working with binary options Distinctive features Does not redraw; Simple and clear settings; It works on all timeframes and on all symbols; Suitable for trading currencies, metals, options and cryptocurrency (Bitco
FREE
Indicator for binary options arrow is easy to use and does not require configuration works on all currency pairs, cryptocurrencies buy signal blue up arrow sell signal red down arrow tips do not trade during news and 15-30 minutes before their release, as the market is too volatile and there is a lot of noise it is worth entering trades one or two candles from the current period (recommended for 1 candle) timeframe up to m 15 recommended money management fixed lot or fixed percentage of the depo
Signal trend indicator. Detects the direction of the trend and is coloured accordingly.  Has built in audible and visual alerts when trends change. Can send notifications to your phone or email. Allows Trend and Counter-Trend trading. Works on all timeframes, all currency pairs, metals, indices and cryptocurrencies. Can be used with binary options. Distinctive features No re-drawing; Simple and clear settings; Four types of alerts; Works on all timeframes and all trading tools; Su
Strong Retracement Points Pro demo edition! SRP (Strong Retracement/Reversal Points) is a powerful and unique support and resistance indicator. It displays the closest important levels which we expect the price retracement/reversal! If all level are broken from one side, it recalculates and draws new support and resistance levels, so the levels might be valid for several days depending on the market! If you are still hesitating to start using this wonderful tool, you can check this link to see h
Embark on the pinnacle of Binary Options evolution. Our indicator isn't just adaptive—it's relentless. Picture a ninja riding a serpent, shadowing its every move; that's how this tool trails the market trend, unwavering till the end. Built upon the foundational prowess of the Ichimoku indicator and honed with an array of fine-tuned oscillators, it epitomizes accuracy and precision. Dive deep without getting lost in the Ichimoku's intricacies—our indicator simplifies the process for you. Perhaps
This   Real Magic Trend   indicator is designed for signal trading. This indicator generates trend signals. It uses many algorithms and indicators to generate this signal. It tries to generate signals from the points with the highest trend potential. This indicator is a complete trading product. This indicator does not need any additional indicators. The indicator is never repainted. The point at which the signal is given does not change.      Features and Recommendations Time Frame
This is a new strategy for SUPPLY DEMAND areas It is based on a calculation using the tick volume to detect the big price action in market for both bear /bull actions this smart volume action candles are used to determine the supply and demand areas prices in between main supply and demand lines indicate sideway market  up arrows will be shown when prices moves above the main supply and the secondary supply lines Down arrows will be shown when prices moves below the main demand and the secondary
Awesome Oscillator by Bill Williams with the ability to fine-tune and replace the averaging algorithms of the indicator, which significantly expands the possibilities of using this oscillator in algorithmic trading and brings it closer in its properties to such an indicator as the MACD. To reduce price noise, the final indicator is processed with an additional Smooth averaging. The indicator has the ability to give alerts, send mail messages and push signals when the direction of movement of th
Noize Absorption Index - is the manual trading system that measures the difference of pressure between bears forces and bulls forces. Green line - is a noize free index that showing curent situation. Zero value of index shows totally choppy/flat market.Values above zero level shows how powerfull bullish wave is and values below zero measures bearish forces.Up arrow appears on bearish market when it's ready to reverse, dn arrow appears on weak bullish market, as a result of reverse expectation. S
数列の一つに「森林火災数列」があります。これは、最も美しい新しいシーケンスの 1 つとして認識されています。その主な特徴は、このシーケンスが線形トレンドを回避することです。最短のものであってもです。この指標の基礎を形成したのはこのプロパティです。 財務時系列を分析する場合、この指標は可能なすべての傾向オプションを拒否しようとします。そして失敗した場合にのみ、トレンドの存在を認識し、適切なシグナルを発します。このアプローチにより、新しいトレンドの始まりの瞬間を正しく判断できます。ただし、偽陽性の可能性もあります。それらの数を減らすために、このインジケーターに追加のフィルターが追加されました。新しいバーが開くとシグナルが生成されます。いずれの場合も再描画は発生しません。 指標パラメータ: Applied Price - 適用価格定数; Period Main - インディケータのメイン期間、その有効な値は 5 ~ 60 です。 Period Additional - 追加の期間。このパラメーターの有効な値は 5 ~ 40 です。 Signal Filter - 追加の信号フィルター、有効
まず第一に、この取引インジケーターは再描画されず、再描画されず、遅延しないことを強調する価値があります。これにより、手動取引とロボット取引の両方に理想的なものになります。 アトミックアナリストは、価格の強さとモメンタムを利用して市場でより良いエッジを見つけるためのPA価格アクションインジケーターです。ノイズや誤ったシグナルを除去し、取引ポテンシャルを高めるための高度なフィルターを備えています。複雑なインジケーターの複数のレイヤーを使用して、アトミックアナリストはチャートをスキャンし、複雑な数学的計算をシンプルなシグナルと色に変換します。これにより、どのような初心者トレーダーでも理解して使用し、一貫した取引の決定を行うことができます。 「アトミックアナリスト」は、新規および経験豊富なトレーダー向けにカスタマイズされた包括的な取引ソリューションです。プレミアムインジケーターとトップノッチの機能を1つの取引戦略に組み合わせ、すべてのタイプのトレーダーにとって汎用性のある選択肢にします。 デイリートレーディングとスキャルピング戦略:高速で正確なデイトレーディングおよび短期トレード
MetaTimer
Luis Alberto Atuncar Sanchez
The " Countdown Candle Timer " indicator is a visual tool for the MetaTrader 4 platform that displays an accurate countdown of the time remaining until the next candle on the chart. It provides real-time information about the remaining duration of the current candle, allowing traders to track time precisely and optimize their trading decision-making. The indicator can be customized in terms of color, font size, and position on the chart, providing flexibility and convenience to the user. You can
FREE
This EA is an extension for the free trade indicator Trend Mate . https://www.mql5.com/en/market/product/50082 The main idea is to support your decision to  trade  according to the current trend. It is possible to configure alert and push notification to receive when entering to first candle for bull / bear trend. For this extension of the free indicator now it is possible to filter the current trend info with other timeframes. For example show trend for timeframe M5 considering also timefra
This is an arrow indicator without a future function,developed based on the most advanced profit trading algorithms.It has the most innovative and advanced dual trend analysis module, as well as the latest and highly effective market trend prediction algorithm.Trends are your friends, and following larger trends can earn the maximum profit in foreign exchange. This indicator helps traders identify current trends and track them. Someone once made a profit of 10 times in a week by relying on it.No
PipFinite Exit EDGE
Karlo Wilson Vendiola
4.89 (160)
Did You Have A Profitable Trade But Suddenly Reversed? In a solid strategy, exiting a trade is equally important as entering. Exit EDGE helps maximize your current trade profit and avoid turning winning trades to losers. Never Miss An Exit Signal Again Monitor all pairs and timeframes in just 1 chart www.mql5.com/en/blogs/post/726558 How To Trade You can close your open trades as soon as you receive a signal Close your Buy orders if you receive an Exit Buy Signal. Close your Sell orde
The indicator displays signals on the chart of the classic RVI indicator with an alert. The indicator signals after confirmation of the strategy at the opening of a new bar. I recommend watching my advisor -   Night Zen EA In the settings, you can select the following strategies: The main line crosses the signal line The main line crosses the zero level In the settings, you can change the period of the classic RVI indicator. I also recommend to look at my other developments in the market:
FREE
The Th3Eng PipFinite indicator is based on a very excellent analysis of the right trend direction with perfect custom algorithms. It show the true direction and the best point to start trading. With StopLoss point and Three Take Profit points. Also it show the right pivot of the price and small points to order to replace the dynamic support and resistance channel, Which surrounds the price. And Finally it draws a very helpful Box on the left side on the chart includes (take profits and Stop loss
WPR by Profile, or WPR for Professionals Geo_WprPro is one of the well-known currency profile indicators. It simultaneously displays two WPR indicators with different parameters in the matrix form on all timeframes of multiple currency pairs forming the currency profile . As follows from the description, " WPR is a leading indicator that often goes ahead of the price chart. The oscillator frequently reaches extreme values before the price reversal as if anticipating that event: it almost always
の紹介     Quantum平均足PRO チャート 市場のトレンドに対する明確な洞察を提供するように設計された平均足キャンドルは、ノイズを除去し、誤ったシグナルを排除する能力で知られています。混乱を招く価格変動に別れを告げ、よりスムーズで信頼性の高いチャート表現を導入しましょう。 Quantum Heiken Ashi PRO を真にユニークなものにしているのは、従来のローソク足データを読みやすい色のバーに変換する革新的なフォーミュラです。赤と緑のバーはそれぞれ弱気トレンドと強気トレンドをエレガントに強調し、潜在的なエントリーポイントとエグジットポイントを驚くほど正確に見つけることができます。 量子EAチャネル:       ここをクリック MT5のバージョン:       ここをクリック この注目すべき指標には、いくつかの重要な利点があります。 明確性の向上: 価格変動を平滑化することで、平均足バーは市場トレンドをより明確に表現し、有利な取引機会を特定しやすくします。 ノイズの削減: 誤ったシグナルを引き起こすことが多い不安定な価格変動に別れを告げます。 Quan
Based on my original trading strategy, it appears that this EA is programmed to use technical analysis to identify an inside candle pattern in the current candle and wait for a breakout in either direction. If the price breaks out higher, the EA will place a buy order, and if it breaks out lower, the EA will place a sell order. The take profit and stop loss levels are set at 50 pips each. Additionally, using a martingale strategy, which involves increasing the lot size after a losing trade, c
FREE
デイリートレンドスカルパー(DTS) このインジケーターはRPTradeProSolutionsシステムの一部です。 DTSは、プライスアクション、ダイナミックサポート、レジスタンスを使用した毎日のトレンドインジケーターです。 誰でも使用できるように設計されており、トレーディングの初心者でも使用できます。 決して塗り直さないでください。 表示は近いものから近いものへと示されます。 単独で使用するように設計されているため、他のインジケーターは必要ありません。 一日の初めにトレンドと潜在的なテイクプロフィットを提供します。 どのように機能しますか DTSは、価格アクションと動的なサポートおよびレジスタンスを組み合わせたブレイクアウト戦略を使用しています。 夜のトレンドとボラティリティが分析され、翌日に使用されます。 この分析から、ブレイクアウト制限(青と濃いオレンジの線)とTakeProfitが決定されます 履歴データのおかげで、戦略と設定の「成功」を即座に確認できます。 履歴部分では、戦略に「穴」があるかどうかをすぐに確認し、最終的にはより適切な別のタイムフレームまたはシン
Amazing Pro System   indicator is designed for signal trading. This indicator generates trend signals. It uses many algorithms and indicators to generate this signal. It tries to generate a signal from the points with the highest trend potential. This indicator is a complete trading product. This indicator does not need any additional indicators. The indicator certainly does not repaint. The point at which the signal is given does not change.     Features and Suggestions Time Frame: H
Engulfing Candlestick Bulkowski The engulfing candlestick is a well-known candle pattern composed of two candles. This indicator for showing engulfing candlestick that describe by Thomas Bulkowski. If you need for MetaTrader 5 version, please visit here: https://www.mql5.com/en/market/product/34183 Feature Highlights Show bullish engulfing and bearish engulfing. Customizable "Up Symbol". Customizable "Down Symbol". Customizable symbol distance from candlestick. Customizable "Down Color". Cus
Quadron
Marek Kvarda
4 (1)
This robot is designed for major currency pairs and trades several strategies.It uses the algorithm for analysis of price data and finds the best parameters. Trades are filtered by results of analysis of daily and monthly chart for the last 12 periods. This is not a scalping robot. It will be traded at all brokers with quotation accurate to points. Your broker must allow hedging. Default settings can be used for EURUSD, GBPUSD and USDJPY on the M30. Settings TimeFrame - Time Frame for trading S
Indicator which identifies Trend and also buy/sell opportunities. Use for entries aligned to the Trend.  Although Diamond Trend is very accurate identifying entry points, it is always recommended to use a support indicator in order to reconfirm the operation. Remind to look for those Assets and Timeframes which best fit to your trader behavior/need... Valid for Scalping and Long Term operations. Please, set up a Bars Chart to be able to visualize the indicator properly...  ...And remind to give
エルメス スペシャリストは、ロボット自身の傾向と戦略を操作することを目的としたメタ トレーダー用のロボットです。 エルメス ゴールド プロを無料でインストールしてアカウントに操作してください。プライベート メッセージをください。 タイムフレームの使用に関する推奨事項: H1 エルメスはアメリカの金属であるXAUUSD(ゴールド)を扱うために開発されました。 エルメスはアサーティブ スキャルピングの長期エキスパートであるため、「リスク (設定)」の値に応じて、取引せずに 1、2、3 日間滞在することができますが、それについては心配しないで、以下をお読みください。 エントリーとスキャルピング(ショート)クローズの積極性により、低ドローダウン/またはゼロドローダウン(標準設定)に優れた能力を備えています。 アカウントに エルメス を残しておくこともできますし、別の専門家 (ロボット) を呼んで作業してもらうこともできます。問題はありません。 リスクの高い構成 (構成値が低い) を使用しないように注意してください。説明します。 ロボットの設定には次のものがあります。
Advanced Stochastic Scalper - is a professional indicator based on the popular Stochastic Oscillator. Advanced Stochastic Scalper is an oscillator with dynamic overbought and oversold levels, while in the standard Stochastic Oscillator, these levels are static and do not change. This allows Advanced Stochastic Scalper to adapt to the ever-changing market. When a buy or a sell signal appears, an arrow is drawn on the chart and an alert is triggered allowing you to open a position in a timely mann
TPP : Turning Point Pattern   The indicator shows the market Turning Point Pattern as arrows. The reversal signals are based on observation of price action and market behavior. It is based on the principles of searching for extremums, volatility, and candlestick pattern. The indicator provides signals on the following principles: Search for the end of the ascending/descending trend Search for the reversal pattern based on candlestick pattern Confirmation of the reversal by the volatility. The in
FREE
Chart Patterns Detect 15 patterns (Ascending Triangle, Descending Triangle, Rising Wedge, Falling Wedge, Bullish Flag, Bearish Flag, Bullish Rectangle, Bearish Rectangle Symmetrical triangle, Head and Shoulders, Inverted Head and Shoulders, Triple top, Triple Bottom, Double Top, Double Bottom) Use historical data to calculate the probability of each pattern to succeed (possibility to filter notification according to the chance of success) gives graphic indication about the invalidation level and
KT Candlestick Patterns Scanner is a Multi-Symbol and Multi-Timeframe scanner that fetches and shows various candlestick patterns on 28 currency pairs and 9 time-frames concurrently . The scanner finds the candlestick patterns by loading the KT Candlestick Patterns indicator as a resource in the background. Features The scanner can find the candlestick patterns on 252* combinations of symbols and time-frames from a single chart. Open the signal's chart loaded with a predefined template with
このプロダクトを購入した人は以下も購入しています
Gann Made Easy は、ミスター・ギャンの理論を使用した取引の最良の原則に基づいた、プロフェッショナルで使いやすい外国為替取引システムです。 W・D・ガン。このインジケーターは、ストップロスとテイクプロフィットレベルを含む正確な買いと売りのシグナルを提供します。 PUSH通知を利用して外出先でも取引可能です。 購入後はご連絡ください!私の取引のヒントと素晴らしいボーナスインジケーターを無料で共有します! おそらく、ギャンの取引手法についてはすでに何度も聞いたことがあるでしょう。通常、ギャンの理論は初心者のトレーダーだけでなく、すでにある程度の取引経験がある人にとっても非常に複雑なものです。なぜなら、ギャンの取引手法は理論的にはそれほど簡単に適用できるものではないからです。私はその知識を磨き、最良の原則を私の外国為替インジケーターに組み込むために数年を費やしました。 このインジケーターは非常に簡単に適用できます。必要なのは、それをチャートに添付し、簡単な取引推奨事項に従うだけです。このインジケーターは常に市場分析の仕事を行い、取引の機会を探します。適切なエントリーポイントを検出
Gold Stuff
Vasiliy Strukov
4.89 (250)
Gold Stuff は、金専用に設計されたトレンド指標であり、あらゆる金融商品にも使用できます。 インジケーターは再描画せず、遅れません。 推奨時間枠 H1. それインディケータでフルオートExpert Advisor EA Gold Stuffが動作します。 あなたは私のプロフィールでそれを見つけることができます. 設定と個人的なボーナスを得るために、購入後すぐに私に連絡してください!   設定 矢印を描く - オンオフ。 チャートに矢印を描く。 アラート - 可聴アラートのオンオフ。 メール通知 - オンオフ。 電子メール通知。 プチ通知 - オンオフ。 プッシュ通知。 次に、色域を調整します。 Gold Stuff は、金専用に設計されたトレンド指標であり、あらゆる金融商品にも使用できます。 インジケーターは再描画せず、遅れません。 推奨時間枠 H1. それインディケータでフルオートExpert Advisor EA Gold Stuffが動作します。 あなたは私のプロフィールでそれを見つけることができます. 設定と個人的なボーナスを得るために、購入後
現在26%オフ 初心者やエキスパートトレーダーに最適なソリューション! このインジケーターは、独自の機能と新しい計算式を取り入れた、ユニークで高品質、かつ手頃な価格のトレーディングツールです。たった1枚のチャートで28の為替ペアの通貨強度を読み取ることができます。新しいトレンドやスキャルピングチャンスの引き金となるポイントを正確に特定することができるので、あなたのトレードがどのように改善されるか想像してみてください。 ユーザーマニュアルはこちら  https://www.mql5.com/en/blogs/post/697384 これが最初の1本、オリジナルだ! 価値のないクローンを買わないでください。 特別な サブウィンドウの矢印で強い通貨の勢いを表示 GAPがあなたのトレードを導く! 基準通貨や気配値が売られすぎ・買われすぎのゾーン(外相フィボナッチレベル)にあるとき、個別チャートのメインウィンドウに警告表示。 通貨がレンジの外側から反落した場合、プルバック/リバーサルのアラート。 クロスパターンの特別なアラート 複数の時間枠を選択可能で、トレンドを素早く
まず第一に、この取引ツールはノンリペイント、ノンリドロー、ノンラグの指標であり、プロの取引に理想的ですことを強調する価値があります。 スマートプライスアクションコンセプトインジケーターは、新米から経験豊富なトレーダーまで、非常 に強力なツールです。Inner Circle Trader AnalysisやSmart Money Concepts Trading Strategiesなど、20以上の有用な指標を1つに組み合わせています。このインジケーターはスマートマネーコンセプトに焦点を当て、大手機関の取引方法を提供し、彼らの動きを予測するのに役立ちます。 特に、流動性分析に優れており、機関がどのように取引しているかを理解しやすくしています。市場のトレンドを予測し、価格の動きを慎重に分析するのに優れています。機関の戦略とトレードを合わせることで、市場の動向についてより正確な予測ができます。このインジケーターは多目的であり、市場構造を分析し、重要な注文ブロックを特定し、さまざまなパターンを認識するのに優れています。 このインジケーターはBOSやCHoCHなどのパターンの識
Scalper Vault は、スキャルピングを成功させるために必要なすべてを提供するプロフェッショナルなスキャルピング システムです。このインジケーターは、外国為替およびバイナリー オプションのトレーダーが使用できる完全な取引システムです。推奨される時間枠は M5 です。 システムは、トレンドの方向に正確な矢印シグナルを提供します。また、トップとボトムのシグナルとギャン マーケット レベルも提供します。 インジケーターは、プッシュ通知を含むすべてのタイプのアラートを提供します。 インジケータの購入後にご連絡ください。私の個人的な取引の推奨事項と素晴らしいボーナス指標を無料で共有します! 幸せで有益な取引をお祈りします!
TPSpro TRENDPRO  - is a trend indicator that automatically analyzes the market and provides information about the trend and each of its changes, as well as giving signals for entering trades without redrawing! The indicator uses each candle, analyzing them separately. referring to different impulses - up or down impulse. Exact entry points into transactions for currencies, crypto, metals, stocks, indices!  -  Version MT5               DETAILED DESCRIPTION        /       TRADING SETUPS           
Trend Screener
STE S.S.COMPANY
4.83 (86)
トレンドインジケーター、1つのツールに組み込まれたすべての重要なトレンド機能を備えたトレンドトレーディングとフィルタリングのための画期的なユニークなソリューション! これは、すべてのシンボル/商品(外国為替、商品、暗号通貨、インデックス、株式)で使用できる100%再描画されていないマルチタイムフレームおよびマルチ通貨インジケーターです。 トレンドスクリーナーは、チャート内のドットで矢印トレンドシグナルを提供するインジケーターに続く効率的なインジケーターです。 トレンド分析インジケーターで使用できる機能: 1.トレンドスキャナー。 2.最大利益分析を備えたトレンドライン。 3.トレンド通貨強度メーター。 4.アラート付きのトレンド反転ドット。 5.アラート付きの強いトレンドドット。 6.トレンド矢印 毎日の分析例、毎日のシグナルパフォーマンス...など、トレンドスクリーナーインジケーターを使用して、ここで見つけることができます: ここをクリックしてください 期間限定オファー:トレンドスクリーナーインジケーターは、50ドルと生涯でのみご利用いただけます。 (元の価格125 $) MQ
現在20%OFF! 初心者やエキスパートトレーダーのためのベストソリューション! このダッシュボードソフトウェアは、28の通貨ペアで動作しています。それは私達の主要な指標(高度な通貨の強さ28と高度な通貨インパルス)の2に基づいています。それは全体の外国為替市場の大きい概観を与えます。それは、すべての(9)時間枠で28の外国為替ペアのための高度な通貨の強さの値、通貨の動きの速度と信号を示しています。チャート上で1つのインディケータを使用して市場全体を観察し、トレンドやスキャルピングの機会をピンポイントで見つけることができたら、あなたのトレードがどのように改善されるか想像してみてください。 このインディケータには、強い通貨と弱い通貨の識別、潜在的な取引の識別と確認がより簡単になるような機能が搭載されています。このインディケータは、通貨の強さや弱さが増加しているか減少しているか、また、すべての時間枠でどのように機能しているかをグラフィカルに表示します。 新機能として、現在の市場環境の変化に適応するダイナミックなマーケットフィボナッチレベルが追加され、すでに当社のAdvan
SALE NOW! Limited Time Offer! An exclusive indicator that utilizes an innovative algorithm to swiftly and accurately determine the market trend. The indicator automatically calculates opening, closing, and profit levels, providing detailed trading statistics. With these features, you can choose the most appropriate trading instrument for the current market conditions. Additionally, you can easily integrate your own arrow indicators into Scalper Inside Pro to quickly evaluate their statistics and
ブレーカートレーダーになり、価格が反転すると市場構造からの利益が変化します。 注文ブロックブレーカーインジケーターは、トレンドまたは価格の動きが枯渇に近づいており、逆転の準備ができていることを識別します。通常、反転または大規模なプルバックが発生しようとしているときに発生する市場構造の変化について警告します。 この指標は、ブレイクアウトと価格の勢いを識別する独自の計算を使用します。使い果たされる可能性のあるポイントの近くで新しい高値が形成されるたびに、インディケーターはその高値の作成を担当する最後の注文ブロックを描きます。次に、移動する価格とともに注文ブロックを追跡します。その後、価格が反対方向にシフトし、その注文ブロックを突破すると、新しい市場構造を作成し、トレンドまたは大きな後退の可能性のある反転の開始を警告します。 注文ブロックは、高値/安値が作成される前の最後の反対色のろうそくであり、価格がこれらの重要な領域を下抜けすると、トレンドの短期的ま​​たは長期的な反転の兆候です。 特徴 重要な枯渇点での市場構造の変化を警告します 価格が使い果たされるレベルに近づくと、
A key element in trading is zones or levels from which decisions to buy or sell a trading instrument are made. Despite attempts by major players to conceal their presence in the market, they inevitably leave traces. Our task was to learn how to identify these traces and interpret them correctly. Reversal First Impulse levels (RFI)   -  Version MT5                INSTRUCTIONS                 RUS                 ENG                                       R ecommended to use with an indicator   -  
ご紹介   クォンタム トレンド スナイパー インジケーターは 、トレンド反転を特定して取引する方法を変革する画期的な MQL5 インジケーターです。 13年以上の取引経験を持つ経験豊富なトレーダーのチームによって開発されました。     クォンタムトレンドスナイパーインジケーター   は、非常に高い精度でトレンドの反転を識別する革新的な方法で、あなたのトレーディングの旅を新たな高みに押し上げるように設計されています。 ***Quantum Trend Sniper Indicatorを購入すると、Quantum Breakout Indicatorを無料で入手できます!*** クォンタム ブレイクアウト インジケーターは、トレンドの反転を特定するとアラートを発し、矢印を示し、3 つのテイクプロフィットレベルを提案します。 初心者トレーダーにもプロのトレーダーにも適しています。 量子EAチャネル:       ここをクリック MT5のバージョン:       ここをクリック 推奨事項: 期間: すべての時間枠。最良の結果を得るには、
ご紹介     Quantum Breakout PRO は 、ブレイクアウト ゾーンの取引方法を変革する画期的な MQL5 インジケーターです。 13年以上の取引経験を持つ経験豊富なトレーダーのチームによって開発された Quantum Breakout PROは 、革新的でダイナミックなブレイクアウトゾーン戦略により、あなたの取引の旅を新たな高みに押し上げるように設計されています。 クォンタム ブレイクアウト インジケーターは、5 つの利益ターゲット ゾーンを備えたブレイクアウト ゾーン上のシグナル矢印と、ブレイクアウト ボックスに基づいたストップロスの提案を提供します。 初心者トレーダーにもプロのトレーダーにも適しています。 量子EAチャネル:       ここをクリック MT5バージョン:   ここをクリック 重要!購入後、インストールマニュアルを受け取るためにプライベートメッセージを送ってください。 推奨事項: 時間枠: M15 通貨ペア: GBPJPY、EURJPY、USDJPY、NZDUSD、XAUUSD アカウントの種類: ECN、Raw、また
Advanced Supply Demand
Bernhard Schweigert
4.92 (310)
現在33%オフ 初心者にもエキスパートトレーダーにも最適なソリューション このインジケーターは独自の機能と新しい公式を多数内蔵しており、ユニークで高品質かつ手頃な取引ツールです。このアップデートでは、2つの時間枠ゾーンを表示できるようになります。より長いTFだけでなく、チャートTFとより長いTF(ネストゾーンを表示)の両方を表示できます。すべてのSupply Demandトレーダーの皆さんのお気に召すはずです。:) 重要情報の公開 Advanced Supply Demandの可能性を最大化するには、 https://www.mql5.com/ja/blogs/post/720245 にアクセスしてください。   エントリーまたはターゲットの正確なトリガーポイントを正確に特定できれば取引がどのように改善されるか想像してみてください。新しい基盤となるアルゴリズムに基づいて構築されているため、買い手と売り手の間の潜在的な不均衡をさらに簡単に特定できます。これは、最も強い需要と供給のゾーンと、過去のパフォーマンス(古いゾーンを表示)がグラフィカルに表現されるためです。これらの機能は、最適
カスタムMT4インジケーターで外国為替取引を成功させるための秘密を発見してください! 外国為替市場で成功を達成し、リスクを最小限に抑えながら一貫して利益を得る方法を疑問に思ったことはありますか? これがあなたが探している答えです! 取引へのアプローチに革命をもたらす独自のMT4インジケーターを導入できるようにします。 ユニークな汎用性 私たちのインジケータは、RenkoとRangeBarのろうそくのフォーメーションを好むユーザー向けに特別に設計されています。 これらのチャートタイプは多くの経験豊富なトレーダーに好まれていることを理解しています。そのため、私たちのインジケーターはそれらとシームレスに統合され、比類のない市場分析を提供します。 クリアトレンドシグナル 複雑な分析を忘れてください! 私たちのインジケーターは、鮮やかな色と明確なドット構造を利用して、市場の動向を明確に示しています。 赤と青の点は、価格の動きの方向性について疑いの余地がなく、取引の迅速な意思決定を可能にします。 HH/HL HL/LL戦略とのアライメント HH/HLおよびHL/LL構
驚異的なFXインジケーター「Miraculous」をご紹介します。完璧な結果を得るための1時間足を含むすべてのタイムフレームで効果的に機能する、最強の強力な特殊MT4フォレックスインジケーターです。 すべてのタイムフレームで優れた結果を提供する最高のFXインジケーターを探し続けるのに疲れましたか?これ以上探す必要はありません!「Miraculous」フォレックスインジケーターをご紹介します。このインジケーターは、トレーディングの経験を変革し、収益を新たなレベルに引き上げるために設計されました。 先進のテクノロジーと長年にわたる緻密な開発に基づいて構築された「Miraculous」フォレックスインジケーターは、FX市場における力と正確さの頂点となります。この素晴らしいツールは、すべてのレベルのトレーダーのニーズを満たすように設計されており、一貫した収益性を追求する上で比類のない優位性を提供します。 「Miraculous」フォレックスインジケーターの他との違いは、その非常に適応性にあります。デイトレーダー、スウィングトレーダーであろうと、長期ポジションを好む方であろうと、このインジケータ
Break & Retest is unstoppable when combined with our other divergence indicator. After purchase, send us a message and you could get this  2nd indicator  for  FREE  as a  BONUS! ‍You can visually backtest Break & Retest to see how it behaved in the past!    Manual guide:   Click here $59  for the first 25 copies ( 4  left)! Next price is $120 .  After many months of hard work and dedication, we are extremely proud to present you our  Break and Retest price action indicator crea
これはMT4のインジケーターで、再描画なしで取引に参入するための正確なシグナルを提供します。 外国為替、暗号通貨、金属、株式、インデックスなど、あらゆる金融資産に適用できます。かなり正確な見積もりを提供し、取引を開始して終了するのに最適な時期を教えてくれます。1つのシグナルを処理しただけでインジケーターの元が取れた例の 動画 (6:22)をご覧ください。Entry PointsPro インジケーターの助けを借りたほとんどのトレーダーの最初の1週間の結果が改善しています。 Telegramグループ に登録してください。Entry Points Proインジケーターのメリットは次の通りです。 再描画のないエントリーシグナル 再描画されるインジケーターでは一度表示されたシグナルが削除されて大きな金銭的損失につながることがありますが、これと異なり、表示されて確認されたシグナルは消えることがありません。 エラーなしの取引開始 インジケーターアルゴリズムによって取引を開始する(資産を売買する)理想的な瞬間を見つけることができます。それを使用するすべてのトレーダーの成功率が向上します。
通貨強さウィザードは、取引を成功させるためのオールインワン ソリューションを提供する非常に強力な指標です。このインジケーターは、複数の時間枠のすべての通貨のデータを使用して、このまたはその外国為替ペアのパワーを計算します。このデータは、使いやすい通貨インデックスと通貨パワーラインの形式で表され、特定の通貨のパワーを確認するために使用できます。 必要なのは、取引したいチャートにインジケーターを接続することだけです。インジケーターは、取引する通貨の実際の強さを示します。このインジケーターは、トレンドに合わせて取引するときに有利に利用できる売買高の圧力の極値も示します。このインジケーターには、フィボナッチに基づく可能なターゲットも表示されます。 このインジケーターは、PUSH 通知を含むあらゆるタイプのアラートを提供します。 購入後ご連絡下さい。私の取引のヒントをあなたと共有し、素晴らしいボーナスインジケーターを無料で提供します! 幸せで有益な取引をお祈りします。
TrendMaestro
Stefano Frisetti
5 (2)
note: this indicator is for METATRADER4, if you want the version for METATRADER5 this is the link: TRENDMAESTRO recognizes a new TREND in the bud, he never makes mistakes. The certainty of identifying a new TREND is priceless. DESCRIPTION TRENDMAESTRO identifies a new TREND in the bud, this indicator examines the volatility, volumes and momentum to identify the moment in which there is an explosion of one or more of these data and therefore the moment in which prices have strong probability of f
TrendDecoder Premium
Christophe, Pa Trouillas
5 (3)
レンジと次の動きを特定    |  トレンドの最も早いシグナルと強さを得る   |  反転の前に明確な出口を得る   |  価格がテストするフィボ・レベルを見つける。 非リペイント、非遅延インディケータ - マニュアルおよび自動売買に最適 - すべての資産、すべての時間単位に対応 期間限定キャンペーン   >> 50%OFF 購入後、 推奨セッティングについては、このチャンネルで私に連絡してください。 MT5 バージョン: ここをクリック BladeSCALPER   と   PowerZONES   を使った完全な方法を入手する どのようなものですか? TrendDECODERは、トレンド監視をシンプルかつ簡単にするための複数のイノベーションを集約したものです。 Projective TrendLine (投影トレンドライン) - 今後のトレンドのスピードリファレンス。 RealTime TrendLine vs. Projective TrendLine (リアルタイムトレンドライン vs. Projective TrendLine) - 市場が同じ方
複数通貨と複数フレームの売買に関するアラート。 自動トレーリングストップとリスク報酬で利益を獲得! インジケーターが市場をスキャンして分析するため、何もする必要はありません。 1 つのチャートですべての通貨を取引しましょう!   購入後、コメントを残して私に連絡してください。トレードアシスタントEAをお送りします。 このインジケーターはいくつかのオシレーターと付属のフィルターを使用して、最良の確認されたエントリーポイントを見つけますので、それについて心配する必要はありません。 警告が表示され、監視することを選択したすべての時間枠と通貨のボタンが描画されます。 ボタンを押すだけでチャートに移動し、取引を開始できます。 このインジケーターは、すべての基本通貨と市場監視通貨の強さパネルも描画します (設定で調整可能)。これにより、すべてのペアの通貨と選択されたより高い時間枠が表示されます。 インジケーターウィンドウ: チャート通貨のトレンドフィルターとマルチタイムフレームトレンドパネルを備えた特別なMACDヒストグラム! すべての通貨と時間枠の取引アラートを提供し、
mql5と Telegramの モーニング・ブリーフィングで、詳細とスクリーンショットを含む毎日のマーケット・アップデートをご覧 ください! FX Power MT4 NGは 、長年の人気を誇る通貨強度計FX Powerの次世代モデルです。 この次世代ストレングスメーターは何を提供するのでしょうか?初代FXパワーの魅力すべて プラス GOLD/XAUの強さ分析 より正確な計算結果 個別に設定可能な分析期間 カスタマイズ可能な計算上限値により、さらに優れたパフォーマンスを実現 もっと見たい人のための特別なマルチインスタンス設定 すべてのチャートでお好みの色を無限に設定可能 数え切れないほどの通知オプションにより、重要なことを見逃すことはありません。 Windows 11とmacOSのスタイルで角を丸くした新しいデザイン 魔法のように動くインジケーターパネル FXパワーの主な機能 すべての主要通貨の強さの完全な履歴 すべての時間枠における通貨の強さの履歴 すべてのブローカーとチャートで同一の計算結果 100%信頼できるリアルタイム計算 -> リペイントなし ドロップダウン・リストから
This indicator is unstoppable when combined with our other indicator called Katana. After purchase, send us a message and you could get Katana for FREE as a BONUS After purchase, send us a private message for your instructions.  MT5 version: click here 3 copies left available at $45. Next price is $99. Don't miss this great deal!  The Trend Forecasting indicator is a very unique & easy tool that is able to make prediction about future price movement based on the signals generated
Price Action Entry Alerts
Stephen Sanjeeve Sahayam
5 (3)
このインジケーターは、売買圧力についてすべてのバーをスクリーニングし、最大量の 4 種類のローソク足パターンを特定します。次に、これらのローソク足はいくつかの線形フィルターを使用してフィルター処理され、買いまたは売りのシグナルが表示されます。シグナルは、より高い時間枠の方向と組み合わせて、取引量が多い時間帯に取引される場合に最も効果的に機能します。すべてのフィルターはカスタマイズ可能で、独立して動作します。ボタンをクリックするだけで単一方向の信号を表示できます。 このインジケーターには、意思決定プロセスに役立つ最も重要な価格アクションとスマート マネーの概念も組み込まれています。 シグナルとトレードに関する教育をすべて 1 つのツールにまとめました。 特徴: 信号は再描画されません。 飲み込むキャンドル、拒否キャンドル、拡張範囲キャンドル、ピンバーを識別します。 有効なシグナルごとに複数のエントリー、ストップロス、複数のテイクプロフィットレベルを表示します。 大容量セッションでフィルタリングします。 サポート/レジスタンスレベルとローソク足の構造でフィルターします。 MACD ヒ
現在31%オフ! 初心者やエキスパートトレーダーに最適なソリューション! このインジケータは、独自の機能と秘密の数式を組み込んだ、ユニークで高品質かつ手頃な価格のトレーディングツールです。たった1枚のチャートで28の通貨ペアのアラートを表示します。新しいトレンドやスキャルピングチャンスの引き金となるポイントを正確に把握することができるので、あなたのトレードがどのように改善されるか想像してみてください! 新しい基本的なアルゴリズムに基づいて構築されているため、潜在的な取引の特定と確認がより簡単になります。これは、通貨の強さや弱さが加速しているかどうかをグラフィカルに表示し、その加速のスピードを測定するためです。加速すると物事は明らかに速く進みますが、これはFX市場でも同じです。つまり、反対方向に加速している通貨をペアにすれば、利益を生む可能性のある取引を特定することができるのです。 通貨の勢いを示す縦の線と矢印は、あなたの取引の指針となるでしょう。 ダイナミックマーケットフィボナッチ23レベルはアラートトリガーとして使用され、市場の動きに適応します。もしインパルスが黄色
FX Volume
Daniel Stein
4.6 (35)
mql5と Telegramの モーニング・ブリーフィングで、詳細とスクリーンショットを含む毎日のマーケット・アップデートをご覧 ください! FX Volumeは、ブローカーの視点から市場のセンチメントをリアルに洞察する、最初で唯一の出来高インジケーターです。 ブローカーのような機関投資家が外国為替市場でどのようなポジションをとっているか、COTレポートよりもはるかに速く、素晴らしい洞察を提供します。 この情報をチャート上で直接見ることは、あなたの取引にとって真のゲームチェンジャーであり、画期的なソリューションです。 以下のようなユニークなマーケットデータ洞察から利益を得てください。 比率は 、通貨のロングポジションとショートポジションの比率をパーセントで表示します。 比率の変化は 、選択した期間内のロング比率とその変化率を表示します。 Volumes Totalは 、通貨の取引量(ロングとショート)の合計をロット単位で表示します。 Volumes Long :全通貨のロングポジションの取引量を表示します。 Volumes(ショート )は、全通貨のショートポジションの取引量を表示
Thise indicator is up down v6  comes with tradingwiev version. purchased people, after installed on terminal ,contact me on mql5  to get BONUS  TradingView version. up-down indicator is no repaint and works all pairs and lower than weekly time frames charts. it is suitable also 1 m charts for all pairs. and hold long way to signal. dont gives too many signals. when red histogram cross trigger line that is up signal.and price probably will down when blue histogram cross trigger line that is dow
支持線と抵抗線、そしてローソク足のギャップをチャート上に自動的に表示するため、価格が次に向かう可能性のある場所や反転する可能性のある場所を確認することができます。 このインジケーターは、私のウェブサイト(The Market Structure Trader)で教えているポジショントレード手法の一部として使用するように設計されており、ターゲットとエントリーの可能性のための重要な情報を表示します。 このインジケーターには、2つのコア機能と4つの追加機能があります: コア機能1 - 日足、週足、月足のサポートラインとレジスタンスラインの自動表示 このインジケーターは、直近2日間、最大6週間前、数ヶ月前のサポートレベルとレジスタンスレベルを自動的に引き込みます。これらのレベルの見た目は完全にカスタマイズすることができ、いくつ表示されるかを表示することもできます。これらの重要な水準は、しばしば主要な支持線と抵抗線として機能し、価格が転換して引き戻されたり反転したりする場所です。また、価格が向かうターゲットでもあるため、価格が転換する前に、取引に利用できる潜在的な距離を素早く確認するこ
How to use Pair Trading Station Pair Trading Station is recommended for H1 time frame and you can use it for any currency pairs. To generate buy and sell signal, follow few steps below to apply Pair Trading Station to your MetaTrader terminal. When you load Pair Trading Station on your chart, Pair Trading station will assess available historical data in your MetaTrader platforms for each currency pair. On your chart, the amount of historical data available will be displayed for each currency pai
作者のその他のプロダクト
MACD (short for Moving Average Convergence/Divergence) is one of the most famous and oldest indicators ever created and is widely used among   beginners . However, there is a newer version of the MACD that is named   Impulse MACD   which have less false signals than the standard MACD. Classic MACD helps us to identify potential   trends   by displaying   crossovers   between two lines. If MACD line crosses above the Signal line it shows us that the market is potentially   up   trending and that
MACD (short for Moving Average Convergence/Divergence) is one of the most famous and oldest indicators ever created and is widely used among beginners . However, there is a newer version of the MACD that is named Impulse MACD  which have less false signals than the standard MACD. Classic MACD helps us to identify potential trends by displaying crossovers between two lines. If MACD line crosses above the Signal line it shows us that the market is potentially up trending and that it would be a go
MACD (short for   M oving   A verage   C onvergence/ D ivergence) is a popular trading indicator used in technical analysis of securities prices. It is designed to identify changes in the strength, direction, momentum, and duration of a trend in a security's price. History Gerald Appel created the MACD line in the late 1970s. Thomas Aspray added the histogram feature to Appel's  MACD in 1986. The three major components and their formula 1. The MACD line: First, "PM Colored MACD" employs two
This indicator is stand alone version from  MP Pivot Levels  (All in one) containing Woodie Pivots. Woodie’s pivot points are made up of multiple key levels, calculated from past price points, in order to frame trades in a simplistic manner. The key levels include the ‘pivot’ itself, and multiple support and resistance levels (usually up to three each). Traders use these levels as a guide for future price movements when setting up trades. The pivot : (Previous high + previous low + 2 x previou
FREE
MP Squeeze Momentum is a volatility and momentum indicator derivated of "TTM Squeeze" volatility indicator introduced by John Carter. It capitalizes on the tendency for price to break out strongly after consolidating in a tight range. Introduction: The volatility component of MP Squeeze Momentum measures price compression using Bollinger Bands and Keltner Channels. If the Bollinger Bands are completely enclosed within the Keltner Channels, that indicates a period of very low volatility. This st
FREE
An “inside bar” pattern is a two-bar price action trading strategy in which the inside bar is smaller and within the high to low range of the prior bar, i.e. the high is lower than the previous bar’s high, and the low is higher than the previous bar’s low. Its relative position can be at the top, the middle or the bottom of the prior bar. The prior bar, the bar before the inside bar, is often referred to as the “mother bar”. You will sometimes see an inside bar referred to as an “ib” and its
FREE
The purpose of using Smart money index (SMI) or smart money flow index is to find out investors sentiment. The index was constructed by Don Hays and measures the market action. The indicator is based on intra-day price patterns. The beginning of the trading day is supposed to represent the trading by retail traders. The majority of retail traders overreact at the beginning of the trading day because of the overnight news and economic data. There is also a lot of buying on market orders and shor
FREE
This trend scanner indicator is using two main indicators to identify trends. Frist the EMAs to provide a view on Bullish / Bearish momentum. When the shorter EMA (calculated off more recent price action) crosses, or is above, the slower moving EMA (calculated off a longer period of price action), it suggests that the market is in an uptrend. Second the Stochastic RSI, When RSI is < 20 it is considered oversold, and when > 80 it is overbought. These conditions suggests that momentum is very str
FREE
A heatmap is a graphical representation of data in two dimensions, using colors to display different factors. Heatmaps are a helpful visual aid for viewers, enabling the quick dissemination of statistical or data-driven information. The MP Heatmap indicator provides a graphical representation of the relative strengths of major currencies compared to others, organizing data from pairs into color-coded results and producing a clear overview of the entire Forex market. The MP Heatmap indicator dis
FREE
A pin bar pattern consists of one price bar, typically a candlestick price bar, which represents a sharp reversal and rejection of price. The pin bar reversal as it is sometimes called, is defined by a long tail, the tail is also referred to as a “shadow” or “wick”. The area between the open and close of the pin bar is called its “real body”, and pin bars generally have small real bodies in comparison to their long tails. The tail of the pin bar shows the area of price that was rejected, and
FREE
This indicator is stand alone version from  MP Pivot Levels  (All in one) containing Demark's Pivots. Calculations:     PP = X / 4     R1 = X / 2 - LOWprev     S1 = X / 2 - HIGHprev Uses: When the pair currency price may change the direction of movement. Possible constraints of support and resistance that creates plateaus for the currency pair prices. Tendency identification by comparing the present prices according to current day's pivot point and also the prior day's pivot points. ___________
FREE
Candle size oscillator is an easy to use tool to figure out candle size from highest to lowest price of each candle. It's a powerful tool for price action analysts specifically for those who works intraday charts and also a perfect tool for short term swing traders. Kindly note that you can also edit the Bullish and Bearish candles with different colors. #Tags: Candle size, oscillator, price action, price range, high to low, candle ticks _________________________________________________________
FREE
The MP Andean Oscillator is used to estimate the direction and also the degree of variations of trends. It contains 3 components: Bull component, Bear component and Signal component. A rising Bull component indicates that the market is up-trending while a rising Bear component indicates the presence of down-trending market. Settings: Oscillator period: Specifies the importance of the trends degree of variations measured by the indicator. Signal line per: Moving average period of the Signal line
FREE
This utility identifies certain candle open times on chart, this can help you to see your favorite candle open and use it as it fits in your strategy. This tool is very useful for intraday charting and indicating your sessions. ___________________________________________________________________________________ Disclaimer: Do NOT trade or invest based upon the analysis presented on this channel. Always do your own research and due diligence before investing or trading. I’ll never tell you what
FREE
The MP Andean Oscillator is used to estimate the direction and also the degree of variations of trends. It contains 3 components: Bull component, Bear component and Signal component. A rising Bull component indicates that the market is up-trending while a rising Bear component indicates the presence of down-trending market. Settings: Oscillator period: Specifies the importance of the trends degree of variations measured by the indicator. Signal line per: Moving average period of the Signal line
FREE
This indicator is stand alone version from  MP Pivot Levels  (All in one) containing Demark's Pivots. Calculations:     PP = X / 4     R1 = X / 2 - LOWprev     S1 = X / 2 - HIGHprev Uses: When the pair currency price may change the direction of movement. Possible constraints of support and resistance that creates plateaus for the currency pair prices. Tendency identification by comparing the present prices according to current day's pivot point and also the prior day's pivot points. ___________
FREE
MP Price Change Indicator is a tool to calculate the price movement by percentage. The Value of this indicator can be adjusted to look back of the percent of price change within certain timeframes. This is a powerful tool when used by other indicators as well, such as ATR and ADR, for understanding price fluctuations and tolerance in different strategies. ___________________________________________________________________________________ Disclaimer: Do NOT trade or invest based upon the analys
FREE
This indicator contains Pivot Levels of: Traditional Fibonacci Woodie Classic Demark Camarilla  Calculation periods can be set to auto / Daily / Weekly / Monthly / Yearly.  Number of Levels are editable.  Options to hide level labels and price labels.  Pivots Points are price levels chartists can use to determine intraday support and resistance levels. Pivot Points use the previous days Open, High, and Low to calculate a Pivot Point for the current day. Using this Pivot Point as the base, three
This creative simple indicator will provide a precise framework for market sentiment within technical analysis of different timeframes. For instance, for traders like me that uses   "Mark Fisher"   strategy regularly, this is a perfect indicator for having an insight to markets from short term to long term point of view, using Break points of candles' lows and highs and perfect to combine with   "Price Action" . For more options and modifications you can also edit the low timeframe candles withi
FREE
MP Inside Bar
Pierre Ksachikian
5 (2)
An “inside bar” pattern is a two-bar price action trading strategy in which the inside bar is smaller and within the high to low range of the prior bar, i.e. the high is lower than the previous bar’s high, and the low is higher than the previous bar’s low. Its relative position can be at the top, the middle or the bottom of the prior bar. The prior bar, the bar before the inside bar, is often referred to as the “mother bar”. You will sometimes see an inside bar referred to as an “ib” and its
FREE
This indicator is stand alone version from  MP Pivot Levels  (All in one) containing Woodie Pivots. Woodie’s pivot points are made up of multiple key levels, calculated from past price points, in order to frame trades in a simplistic manner. The key levels include the ‘pivot’ itself, and multiple support and resistance levels (usually up to three each). Traders use these levels as a guide for future price movements when setting up trades. The pivot : (Previous high + previous low + 2 x previou
FREE
Candle size oscillator is an easy to use tool to figure out candle size from highest to lowest price of each candle. It's a powerful tool for price action analysts specifically for those who works intraday charts and also a perfect tool for short term swing traders. Kindly note that you can also edit the Bullish and Bearish candles with different colors. #Tags: Candle size, oscillator, price action, price range, high to low, candle ticks _________________________________________________________
FREE
MP Relative Bandwidth Filter (RBF) is created to be used to identify your trading zones based on volatility. This easy to use technical indicator attempts to compare between Bandwidth of higher length and ATR of lower length to identify the areas of low and high volatility: Relative Bandwidth = Bandwidth / ATR The Bandwidth is based on Bollinger Band which its length ideally needs to be higher and ATR length needs to be ideally lower. After calculating Relative Bandwidth, the Bollinger Band is
FREE
MP Price Change Indicator is a tool to calculate the price movement by percentage. The Value of this indicator can be adjusted to look back of the percent of price change within certain timeframes. This is a powerful tool when used by other indicators as well, such as ATR and ADR, for understanding price fluctuations and tolerance in different strategies. ___________________________________________________________________________________ Disclaimer: Do NOT trade or invest based upon the analys
FREE
This utility identifies certain candle open times on chart, this can help you to see your favorite candle open and use it as it fits in your strategy. This tool is very useful for intraday charting and indicating your sessions. ___________________________________________________________________________________ Disclaimer: Do NOT trade or invest based upon the analysis presented on this channel. Always do your own research and due diligence before investing or trading. I’ll never tell you what
FREE
This creative simple indicator will provide a precise framework for market sentiment within technical analysis of different timeframes. For instance, for traders like me that uses   "Mark Fisher"   strategy regularly, this is a perfect indicator for having an insight to markets from short term to long term point of view, using Break points of candles' lows and highs and perfect to combine with   "Price Action" . For more options and modifications you can also edit the low timeframe candles withi
FREE
MP Gradient Adaptive RSI oscillator uses AMA with the basic RSI to cover the retracements with minimum lag. Trigger line crossing the oscillator will provide an entry point for trader. Settings: RSI period: period of the oscillator Sensitivity of the oscillator: controls the sensitivity of the oscillator to retracements, with higher values minimizing the sensitivity to retracements. RSI applied price: source input of the indicator Number of bars to draw: is used when the Fill Type option is n
FREE
A pin bar pattern consists of one price bar, typically a candlestick price bar, which represents a sharp reversal and rejection of price. The pin bar reversal as it is sometimes called, is defined by a long tail, the tail is also referred to as a “shadow” or “wick”. The area between the open and close of the pin bar is called its “real body”, and pin bars generally have small real bodies in comparison to their long tails. The tail of the pin bar shows the area of price that was rejected, and
FREE
This indicator helps to identify market sessions, It's High/Low, Open Range (OR), range of the sessions in pips and percentage of previous day (change%) under OHLC. It is also editable for any brokerage market watch time. For traders who use session trading strategies such as Mark B. Fisher ACD it can be super effective, where they can edit OR from the settings to either line or box.  We tried to make the settings easier to edit, for traders' use on different markets, charts and brokerage time.
This indicator contains Pivot Levels of: Traditional Fibonacci Woodie Classic Demark Camarilla Calculation periods can be set to auto / Daily / Weekly / Monthly / Yearly. Number of Levels are editable. Options to hide level labels and price labels. Pivots Points are price levels chartists can use to determine intraday support and resistance levels. Pivot Points use the previous days Open, High, and Low to calculate a Pivot Point for the current day. Using this Pivot Point as the base, three resi
フィルタ:
レビューなし
レビューに返信