Big Figure Indicator MT5
- インディケータ
- Vonjinirina Alfred Randrianiaina
- バージョン: 1.2
- アップデート済み: 10 4月 2023
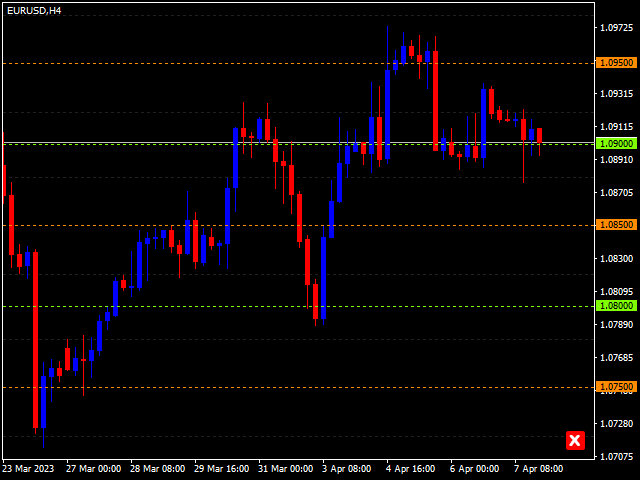
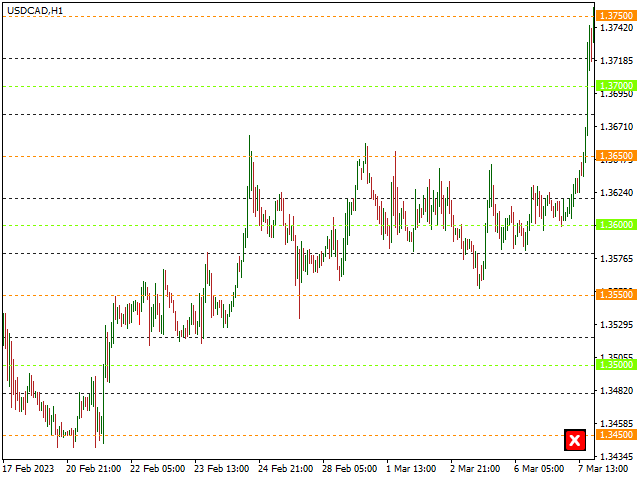
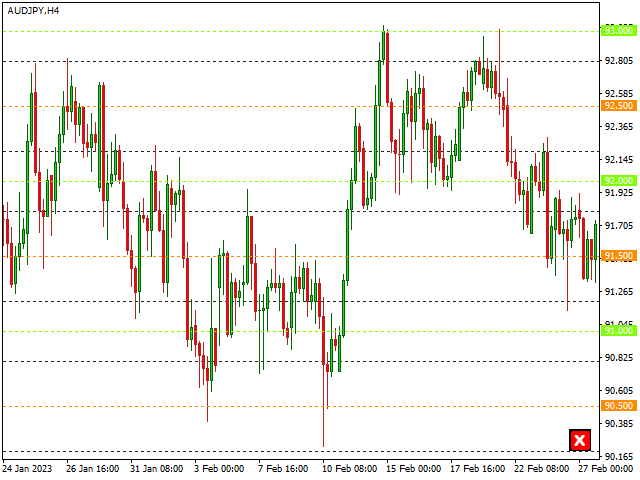
「BIG FIGURE INDICATOR」は、価格チャート上で整数や半分の数字(たとえば、通貨取引での1.0000や1.5000など)など特定のレベルで自動的に水平線を識別して描画します。これらのレベルは心理的に重要であると考えられており、大口トレーダーや投資家が注目する可能性がある丸められた数字を表しており、潜在的なサポートまたはレジスタンスレベルにつながります。ビッグフィギュアインジケーターは、トレーダーが重要な価格レベルを特定し、これらのレベルに基づいて取引決定を行うのに役立ちます。
-
ラインはM1からH8のタイムフレームチャートにのみ表示されます。
-
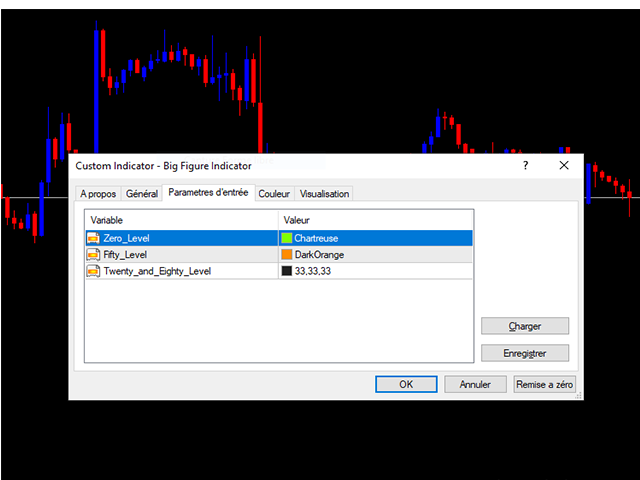
ラインの色は入力パラメータタブで変更できます。
-
すべての通貨ペアで使用できます。
MT4バージョン:https://www.mql5.com/fr/market/product/96747
注意:当社のインジケーターを最適に機能させるには、まずデイリー(D1)タイムフレームを読み込む必要があります


Muy útil gracias