Wamek Trend Consult
- インディケータ
- Daniel Opoku
- バージョン: 2.0
- アップデート済み: 20 1月 2024
- アクティベーション: 5
Get ahead of the curve with the Wamek Trend Consult indicator.
Designed to identify early and continuation trends, this powerful tool empowers traders to enter the market at precisely the right moment, utilizing powerful filters to reduce the number of fake out signals and improve the accuracy of your trades. By precisely analyzing market trends and filtering out false signals, using its advanced algorithms and unparalleled accuracy, the Trend Consult indicator provides traders with a clear advantage and increased profitability.
No matter what type of trader you are – whether you prefer scalping, swing trading, or position trading – Trend Consult can help you to achieve consistent profits by accurately identifying early trends in the market. Our user-friendly interface and intuitive design make it easy for beginners to get started in forex trading and start making money from day one. It also adds top notch advantage to professional traders.
Wamek Trend Consult is presently available at a remarkable 35% discount and now selling at $175. This is a unique chance to obtain this highly effective forex indicator at an exceptionally low price. With Trend Consult, traders can take advantage of its advanced features to accurately identify trends and optimize their trading strategy.
Don’t miss out on this opportunity to elevate your trading game at an unbeatable value. Act fast and get Trend Consult while it’s still discounted!
**********************************************************************************
Wamek Trend Consult is suitable for currencies, stocks, and commodities.
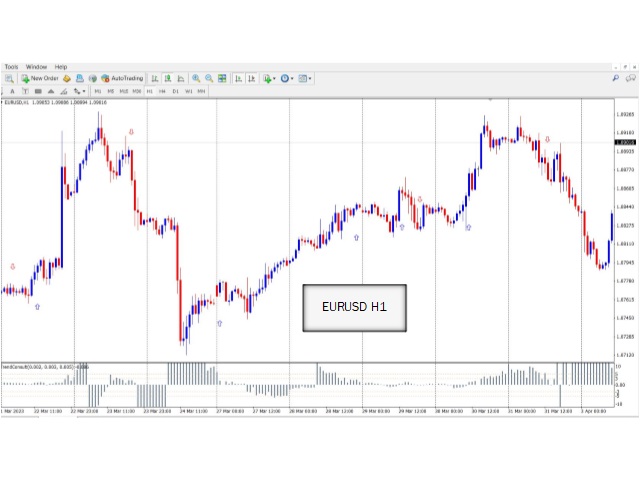
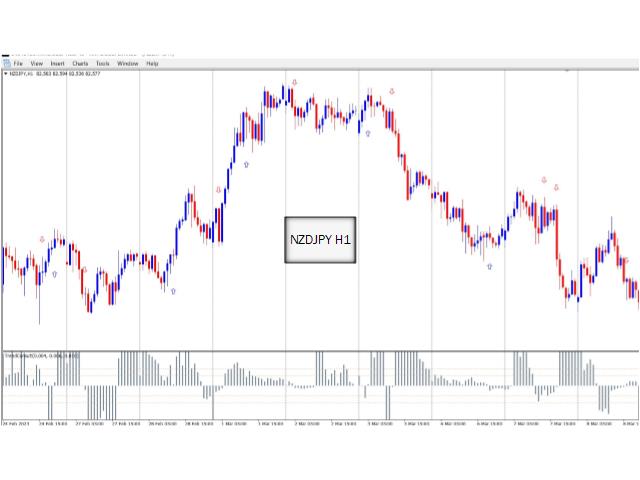
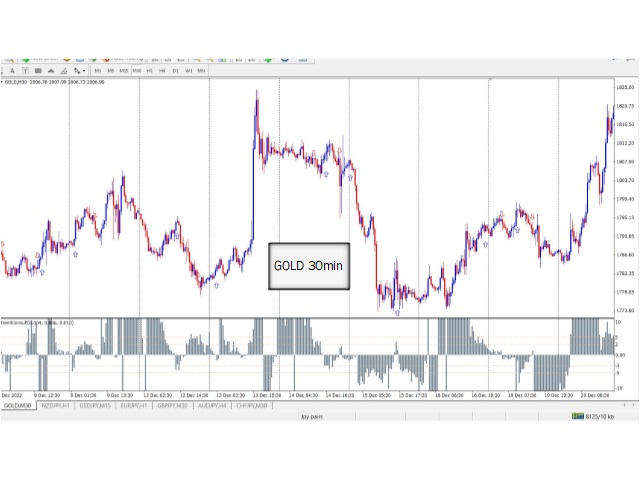
The Trend Consult do NOT repaint: Once the arrows appear on the closed of a candle, it does NOT disappear.
************************************************************************************
HOW TO USE WAMEK TREND CONSULT
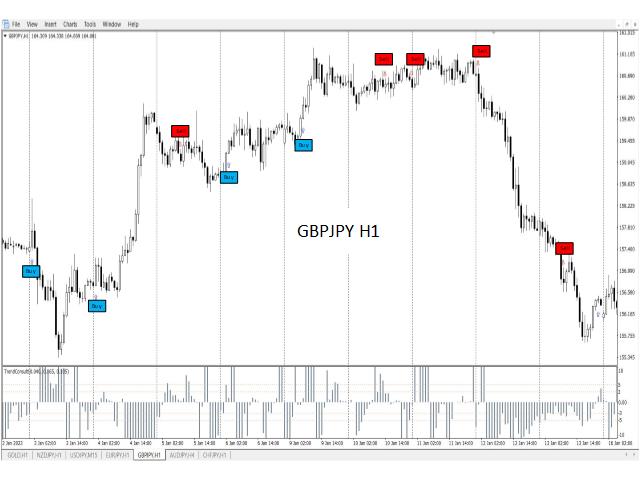
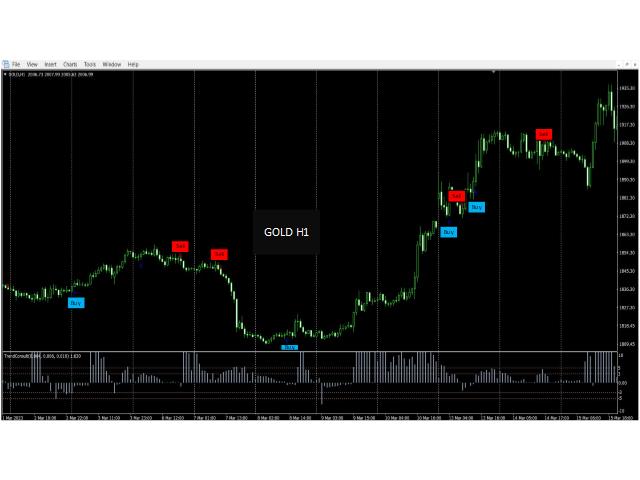
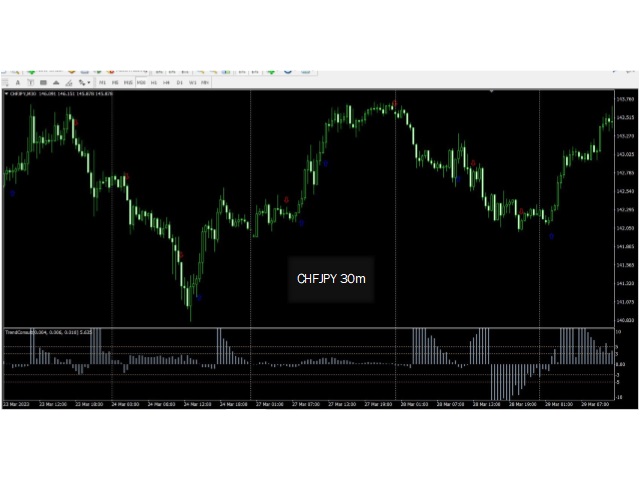
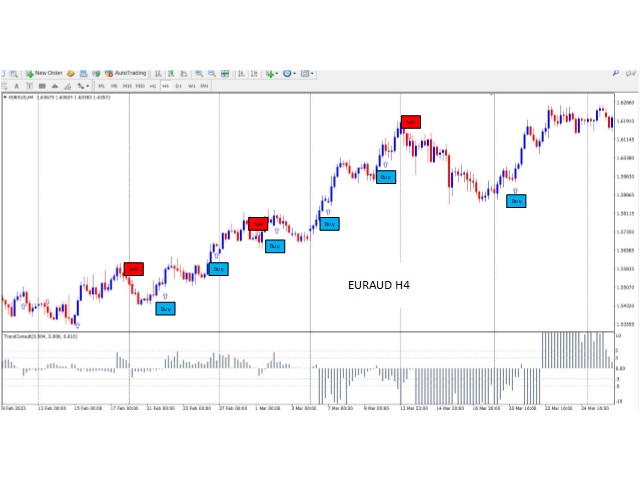
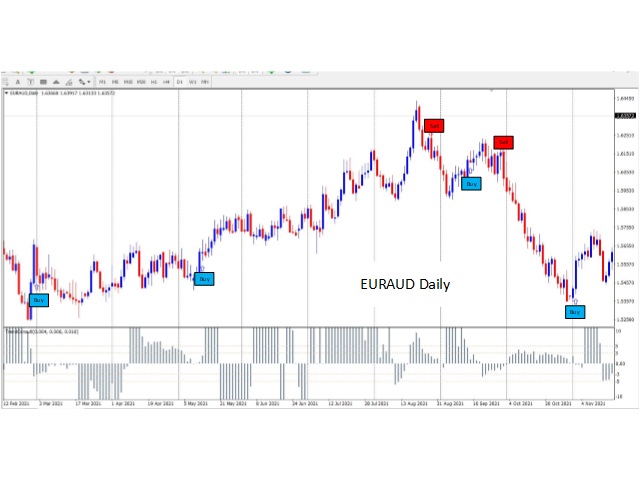
Enter BUY position when the UP ARROW appears below the Low of the previous candle.
Enter SELL position when the DOWN ARROW appears above the High of the previous candle.
At Wamek, we prioritize transparency and empower traders to take control of their trades. While our indicator provides entry signals, we do not believe in dictating specific stop loss or take profit signals. We believe that every trader's strategy is unique and requires a personalized approach. By allowing traders to determine when to take profit or accept loss, Wamek encourages traders to take a more active role in their trades and make informed decisions based on their own trading style and preferences. With Trend Consult as your trusted partner, you'll have the support you need to take your trading to the next level – on your terms.
******************************************************************************
Input Parameters
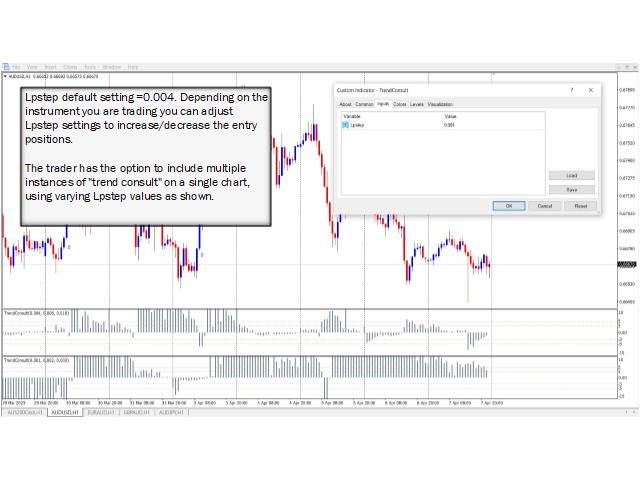
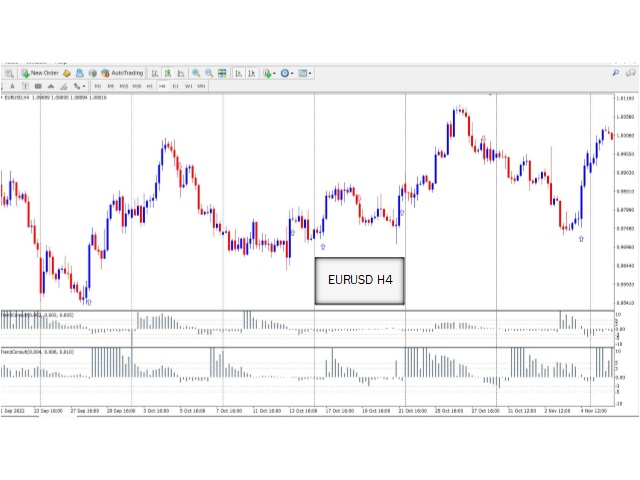
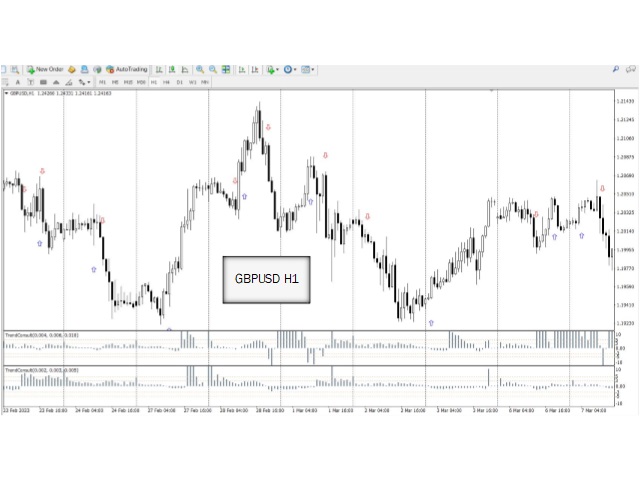
Lpstep default settings=0.004
Unlock greater flexibility in your trading strategy with Trend Consult. With adjustable Lpstep settings, you have the power to fine-tune your entry positions based on the specific instrument you're trading. Plus, Trend Consult's innovative design allows traders to include multiple instances of the indicator on a single chart, with varying Lpstep values tailored to your preferences. By using Trend Consult's advanced features, you can take full control of your trades and maximize your profits with ease.
Invest in Trend Consult today and discover the difference it can make in your trading success!"
*************************************************************************************
KEEP IN MIND
Wamek trend consult is NOT the holy grail of the financial market, however, we can assure you that it is a powerful tool that can help you achieve consistent profits over time. By using our indicator signals in conjunction with your own trading strategy, you can increase your chances of success and build a positive trading expectancy.
Our team is committed to providing accurate and reliable insights into market trends, and we stand by our product's ability to improve your overall trading performance.
So why not give Trend Consult a try? Join the countless traders already experiencing success with our indicator and start your journey towards consistent profits today.