Implied Fair Value Gap MT4
- インディケータ
- Andrei Novichkov
- バージョン: 1.10
- アップデート済み: 23 4月 2023
- アクティベーション: 5
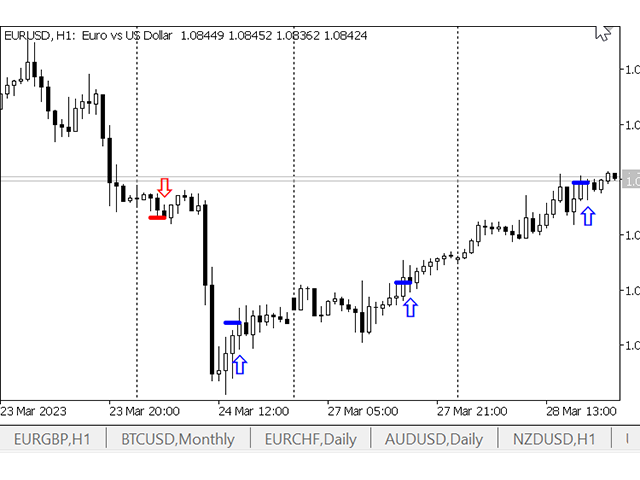
Indicator ICT Implied Fair Value Gap (IFVG) is an important part of the Smart Money Concepts (SMC) system. It looks for and shows on the chart a modern pattern - the Fair Value Gap (FVG). This pattern is a three candlestick imbalance formation based on the discovery of a mismatch between supply and demand. This happens when the price moves quickly in one direction without encountering resistance. The result is a "gap", which can be filled in later. The indicator finds this pattern using the updated methodology and marks the location of the pattern with an arrow. In addition, the settings provide for the creation of an Alert in the form of various combinations of sound alerts, messages to the mail and to the mobile terminal.
2 main ways to use the indicator:
1. When trading imbalances and fair value gaps.
2. Using the found patterns as support/resistance lines.
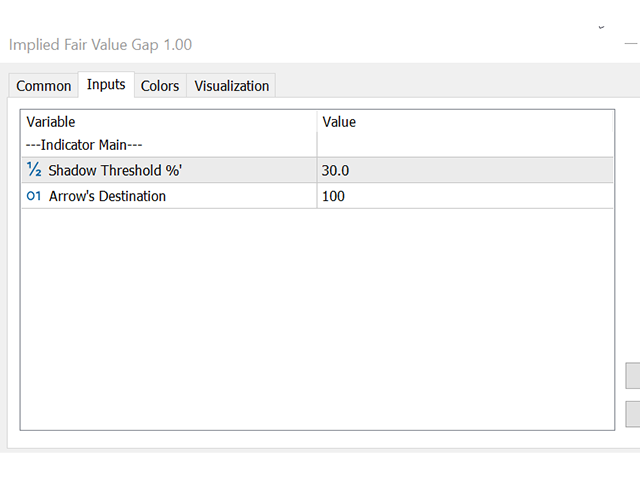
The indicator is not difficult to set up and has only two parameters. The second parameter is responsible for the location of the indicator arrows, and the first one is for the pattern detection accuracy:
Shadow Threshold, %: Threshold percentage used to filter IFVG with similar shadows of adjacent candles.
The indicator, despite its apparent simplicity, will be necessary for any trader who wants to master the modern Smart Money Concepts methodology. Its skillful use will have a positive impact on understanding the market and the accuracy of entering positions.
The version for MT5 is here .