• 概要
  • レビュー
  • コメント

Signal Dream

The indicator for binary options without repainting is a powerful tool for traders. It ensures signal reliability without altering them after their appearance.

Features:

Non-repainting signals: The indicator provides stable and reliable signals that do not change after formation. Expiration time: Signals appear at the candlestick opening and expire within one candlestick of the current timeframe. Overlay method: In the event of a losing trade, it is recommended to use the overlay method with an increased lot size in the same direction on the next candlestick. Ease of use: The indicator is easy to apply and does not require complex settings. Signals:

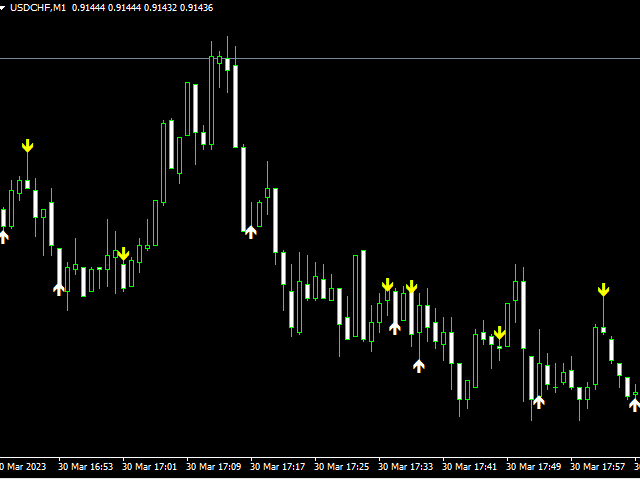
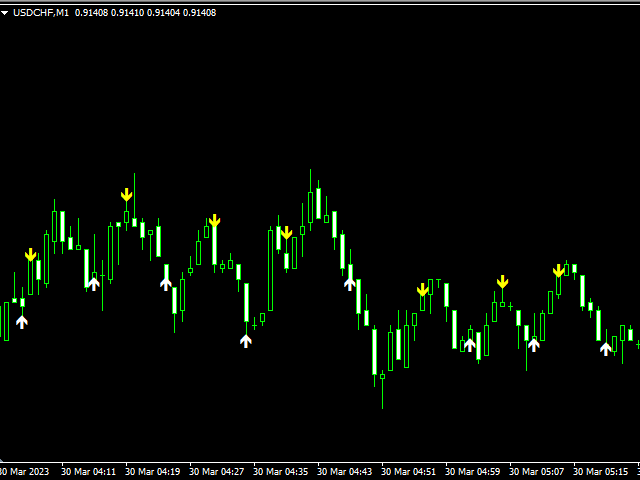
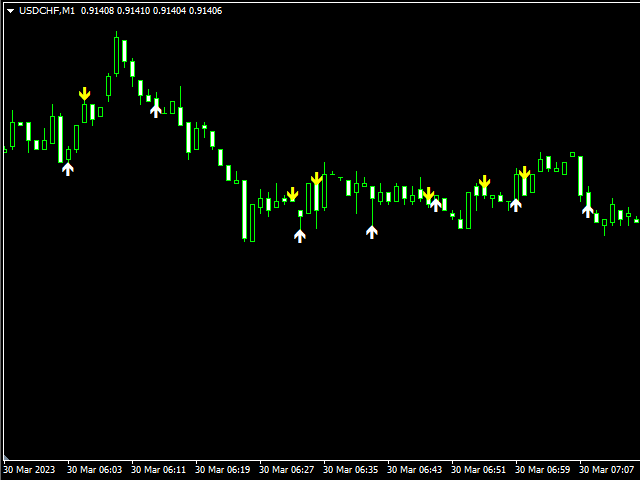
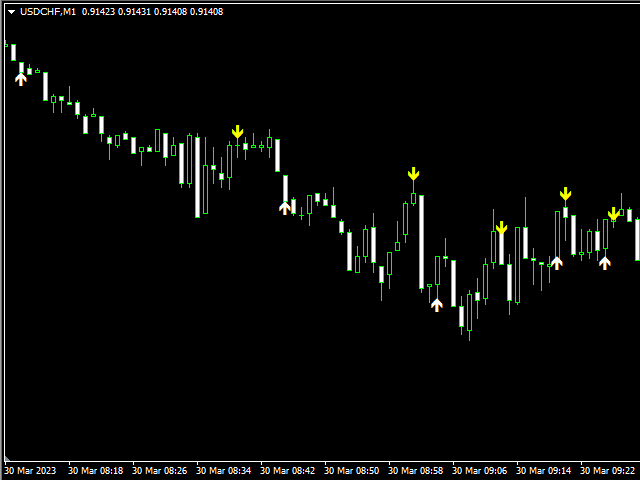
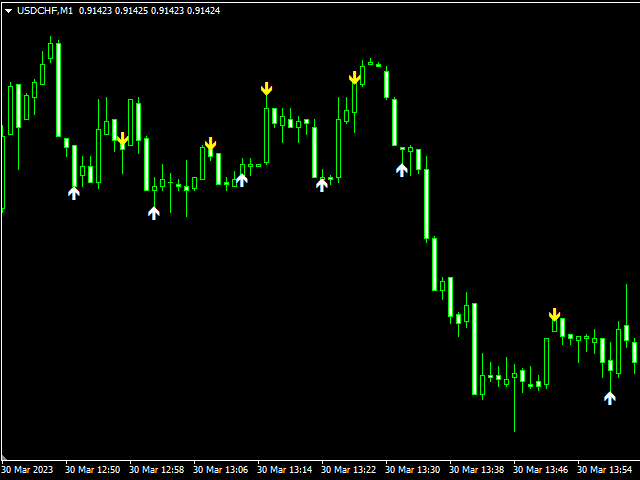
Upward signal: White arrow pointing upwards. It is recommended to open a trade upwards with an expiration of one candlestick of the current timeframe. In case of loss, increase the lot size by 3 times and enter the trade on the next candlestick after the signal.

Downward signal: Yellow arrow pointing downwards. It is recommended to open a trade downwards with an expiration of one candlestick of the current timeframe. In case of loss, increase the lot size by 3 times and enter the trade on the next candlestick after the signal. Warning:

It should be remembered that chasing and martingale systems can lead to significant losses of the deposit. It is recommended to assess the risks and their ratio to your deposit before using this method.

おすすめのプロダクト
これは、キャンドルの終値を予測する指標です。 このインジケータは、主にD1チャートでの使用を目的としていますが. この指標は、従来の外国為替取引とバイナリオプション取引の両方に適しています。 インジケーターは、スタンドアロンのトレーディングシステムとして使用することも、既存のトレーディングシステムへの追加として機能させることもできます。 このインジケーターは、現在のキャンドルを分析し、キャンドル自体の内部の特定の強度係数と、前のキャンドルのパラメーターを計算します。 したがって、この指標は、市場の動きのさらなる方向性と現在のキャンドルの終値を予測します。 この方法のおかげで、この指標は、短期の日中取引だけでなく、中期および長期の取引にも適しています。 インジケーターを使用すると、市場の状況の分析中にインジケーターが生成する潜在的な信号の数を設定できます。 インジケーターの設定には、このための特別なパラメーターがあります。 また、インジケーターは、チャート上のメッセージの形式で、電子メールで、およびPUSH通知の形式で、新しい信号について通知することができます。 購入後は必ず私に書いて
A technical indicator that calculates its readings on trading volumes. In the form of a histogram, it shows the accumulation of the strength of the movement of the trading instrument. It has independent calculation systems for bullish and bearish directions. Works on any trading instruments and time frames. Can complement any trading system. The indicator does not redraw its values, the signals appear on the current candle. It is easy to use and does not load the chart, does not require additi
Was: $249  Now: $99   Market Profile defines a number of day types that can help the trader to determine market behaviour. A key feature is the Value Area, representing the range of price action where 70% of trading took place. Understanding the Value Area can give traders valuable insight into market direction and establish the higher odds trade. It is an excellent addition to any system you may be using. Blahtech Limited presents their Market Profile indicator for the MetaTrader community. Ins
VR Cub
Vladimir Pastushak
VR Cub は、質の高いエントリーポイントを獲得するためのインジケーターです。このインジケーターは、数学的計算を容易にし、ポジションへのエントリーポイントの検索を簡素化するために開発されました。このインジケーターが作成されたトレーディング戦略は、長年にわたってその有効性が証明されてきました。取引戦略のシンプルさはその大きな利点であり、初心者のトレーダーでもうまく取引することができます。 VR Cub はポジション開始ポイントとテイクプロフィットとストップロスのターゲットレベルを計算し、効率と使いやすさを大幅に向上させます。取引の簡単なルールを理解するには、以下の戦略を使用した取引のスクリーンショットを見てください。 設定、設定ファイル、デモ版、説明書、問題解決方法は、以下から入手できます。 [ブログ] レビューを読んだり書いたりすることができます。 [リンク] のバージョン [MetaTrader 5] エントリーポイントの計算ルール ポジションをオープンする エントリーポイントを計算するには、VR Cub ツールを最後の高値から最後の安値までストレッチする必要があります。
Trend Bilio - an arrow indicator without redrawing shows potential market entry points in the form of arrows of the corresponding color: upward red arrows suggest opening a buy, green down arrows - selling. The entrance is supposed to be at the next bar after the pointer. The arrow indicator Trend Bilio visually "unloads" the price chart and saves time for analysis: no signal - no deal, if an opposite signal appears, then the current deal should be closed. It is Trend Bilio that is considered
This indicator displays the histogram and arrows on chart. When Simple The Best Pro are placed on a chart, they identify the trend.  The color of may be blue or red. The blue color stands for upside moves and the red color stands for downside trends. The indicator offers to set Stop Loss (SL) and  Take Profit (TP)  setting. The default value is ATR. Indicator has automatic optimization. The STB is a unique indicator that shows the tendency (button Bars) of a particular signals. The STB tells us
インディケータは現在のクオートを作成し、これを過去のものと比較して、これに基づいて価格変動予測を行います。インジケータには、目的の日付にすばやく移動するためのテキスト フィールドがあります。 オプション: シンボル - インジケーターが表示するシンボルの選択; SymbolPeriod - 指標がデータを取る期間の選択; IndicatorColor - インジケータの色; HorisontalShift - 指定されたバー数だけインディケータによって描画されたクオートのシフト; Inverse - true は引用符を逆にします。false - 元のビュー。 ChartVerticalShiftStep - チャートを垂直方向にシフトします (キーボードの上下矢印)。 次は日付を入力できるテキストフィールドの設定で、「Enter」を押すとすぐにジャンプできます。
TrendCompass is a powerful indicator for trading in the currency and cryptocurrency markets on the MetaTrader 4 platform. This innovative tool is designed to simplify analysis and decision-making in trading. The indicator combines various technical indicators and algorithms to provide accurate and timely trading signals. Key Features: Multilevel Strategy: TrendCompass is based on a comprehensive strategy that includes analyzing major trends, support and resistance levels, and various technical
TWO PAIRS SQUARE HEDGE METER INDICATOR Try this brilliant 2 pairs square indicator It draws a square wave of the relation between your two inputs symbols when square wave indicates -1 then it is very great opportunity to SELL pair1 and BUY Pair2 when square wave indicates +1 then it is very great opportunity to BUY pair1 and SELL Pair2 the inputs are : 2 pairs of symbols         then index value : i use 20 for M30 charts ( you can try other values : 40/50 for M15 , : 30 for M30 , : 10 for H1 ,
This is a new strategy for SUPPLY DEMAND areas It is based on a calculation using the tick volume to detect the big price action in market for both bear /bull actions this smart volume action candles are used to determine the supply and demand areas prices in between main supply and demand lines indicate sideway market  up arrows will be shown when prices moves above the main supply and the secondary supply lines Down arrows will be shown when prices moves below the main demand and the secondary
5 signal in 1  Product     TimeFrame   Recommend   1m-5m recommend  signal   TF  5m    Banks Pro Binary Option is Indicator for binary option Can Use Manaul Trade or Robot on Platform  Mt2Trading  https://www.mt2trading.com/?ref=104    Time Trading   good work  EU session    Recommend  Curency   EUR  GBP USD        careful   AUD JPY      Recommend  Martingale 2-5 Step   Recommend  set profit  2%-5%/Day Setting Brake  News Event High volatility   recommend  15-30 min Have Problem Contract
The new update makes this indicator a complete tool for studying, analyzing and operating probabilistic patterns. It includes: On-chart Multi-asset percentage monitor. Configurable martingales. Twenty-one pre-configured patterns , including Mhi patterns and C3. An advanced pattern editor to store up to 5 custom patterns. Backtest mode to test results with loss reports. Trend filter. Hit operational filter. Martingale Cycles option. Various types of strategies and alerts. Confluence between patte
BoxChart MT4
Evgeny Shevtsov
4.57 (7)
The market is unfair if only because 10% of participants manage 90% of funds. An ordinary trader has slim changes to stand against these "vultures". This problem can be solved. You just need to be among these 10%, learn to predict their intentions and move with them. Volume is the only preemptive factor that faultlessly works on any timeframe and symbol. First, the volume appears and is accumulated, and only then the price moves. The price moves from one volume to another. Areas of volume accumu
スキャルピングアロー通知電話は、ユニークなスキャルピングトレーディングインジケーターです。インジケーターは、注文を開く必要があるときにチャート上に矢印を描画し、注文を開く必要がある方向を示し、携帯電話にシグナルに関する通知を送信します。いつでも、あなたがコンピュータの前にいないときでさえ、あなたは信号を受け取り、市場と取引をコントロールすることができます。インジケーターは、いつ注文を開くかを矢印で示し、矢印の方向は、注文を開く方向を示します。 インジケーターの設定は非常に簡単です。パラメータは2つだけです。 short_period-インジケータ短波周期。 long_period-インジケーターの長波周期。 Signal -ここでは、携帯電話への通知の送信を有効または無効にします。
Features for software Main functions: Accurate entry signals WITHOUT REPAINTING! Once a signal appears, it remains valid! This is a significant distinction from repainting indicators that might provide a signal and then alter it, potentially leading to deposit losses. Now, you can enter the market with higher probability and precision. There's also a function to colour candles after an arrow appears until the target (take profit) is reached or a reversal signal appears . Display of STOP LOSS
ナイト ゴースト - バイナリ オプションの矢印インジケーター。 これからのあなたの頼もしいアシスタントです! 11 - チャートの再描画なし - すべての通貨ペアで大活躍! -インジケータの精度は最大 90% (特に夜間) ・長時間の設定不要(バイナリーオプションに最適な設定) - 信号が遅れない - 現在のローソク足でのシグナルの出現 ・M1期にピッタリ(No More!) ・目に優しいキャンドルカラー(赤・青) -インストールされたアラート それを扱う: - 青い矢印は信号アップを示します -赤い下向き矢印 M1 以上のインジケーターをチャートに配置しないでください. シグナルの精度が低下します! インジケーターのスクリーンショットとビデオを見る
The principle of this indicator is very simple: detecting the trend with Moving Average, then monitoring the return point of graph by using the crossing of Stochastic Oscillator and finally predicting BUY and SELL signal with arrows, alerts and notifications. The parameters are fixed and automatically calculated on each time frame. Example: If you install indicator on EURUSD, timeframe M5: the indicator will detect the main trend with the Moving Average on this timeframe (for example the Moving
This unique multi-currency strategy simultaneously determines the strength of trends and market entry points, visualizing this using histograms on the chart. The indicator is optimally adapted for trading on the timeframes М5, М15, М30, Н1. For the convenience of users, the indicator renders the entry point (in the form of an arrow), recommended take profit levels (TP1, TP2 with text labels) and the recommended Stop Loss level. The take profit levels (TP1, TP2) are automatically calculated for
フィボナッチリトレースと拡張ラインツール DiNapoliポイント取引方法とゴールデンセクション取引を使用するトレーダーにとって理想的なMT4プラットフォームのフィボナッチリトレースと拡張ラインツール 主な特長: あなたはフィボナッチリトレースメントの複数のセットを直接描くことができ、重要なリターンポイント間の関係は一目瞭然です。 2.フィボナッチ拡張を描画することができます。 3.フィボナッチフォールドバックとラインの延長は、簡単な観察と数値表示のために左右に動かすことができます。 4.チャートは非常に爽やかな 5.数字キーでサイクルを切り替えることができます。 ファンクションキー: 1。 [戻るを押す、要求に応じて描画する、最大8つのグループにする 2。拡張]を描くには[押す] 3。 \を押すと、現在のサイクルの下にあるすべての拡張機能と折り畳みが削除されます 4。フォールドバックを移動して削除して展開する (1)最初のフォールドバックセットのF5行をクリックします。 一度クリックすると(黄色に変わります)、キーボードのDel
Noize Absorption Index - is the manual trading system that measures the difference of pressure between bears forces and bulls forces. Green line - is a noize free index that showing curent situation. Zero value of index shows totally choppy/flat market.Values above zero level shows how powerfull bullish wave is and values below zero measures bearish forces.Up arrow appears on bearish market when it's ready to reverse, dn arrow appears on weak bullish market, as a result of reverse expectation. S
The Riko Trend indicator is a revolutionary trend trading and filtering solution with all the important features of a trend tool built into one tool! The Riko Trend indicator is good for any trader, suitable for any trader for both forex and binary options. You don’t need to configure anything, everything is perfected by time and experience, it works great during a flat and in a trend. The Riko Trend indicator is a technical analysis tool for financial markets that reflects the current price
The Chaikin Oscillator is a technical indicator developed by Marc Chaikin that combines price and volume data to measure the accumulation and distribution of a financial instrument. It aims to identify potential buying and selling opportunities in the market. The Chaikin Oscillator is calculated by subtracting a 10-day exponential moving average of the Accumulation Distribution Line (ADL) from a 3-day exponential moving average of the ADL. Here's how to use the Chaikin Oscillator indicator in tr
Indicator for binary options arrow is easy to use and does not require configuration works on all currency pairs, cryptocurrencies buy signal blue up arrow sell signal red down arrow tips do not trade during news and 15-30 minutes before their release, as the market is too volatile and there is a lot of noise it is worth entering trades one or two candles from the current period (recommended for 1 candle) timeframe up to m 15 recommended money management fixed lot or fixed percentage of the depo
Pro Trend Tracking   indicator is designed for trend and signal trading. This indicator generates trend signals.  It uses many algorithms and indicators to generate this signal. It tries to generate a signal from the points with the highest trend potential. This indicator is a complete trading product. This indicator does not need any additional indicators.  You can only trade with this indicator. The generated signals are displayed on the graphical screen.  Thanks to the alert features you can
PipFinite Exit EDGE
Karlo Wilson Vendiola
4.89 (160)
Did You Have A Profitable Trade But Suddenly Reversed? In a solid strategy, exiting a trade is equally important as entering. Exit EDGE helps maximize your current trade profit and avoid turning winning trades to losers. Never Miss An Exit Signal Again Monitor all pairs and timeframes in just 1 chart www.mql5.com/en/blogs/post/726558 How To Trade You can close your open trades as soon as you receive a signal Close your Buy orders if you receive an Exit Buy Signal. Close your Sell orde
Старый, добрый "AP" в версии трендового осциллятора. Это простой индикатор, который использует максимум возможностей языка MQL4. Но при этом он работает достаточно быстро даже на процессорах 1 Гигагерц и менее. При анализе следует обращать внимание на пересечение уровня 50, если вы намеренны использовать его как трендовый индикатор. Индикатор не перерисовывает, и работает на всех типах графиков и таймфреймах. Сделаны основные возможности оповещения, оповещения работают в обоих направлениях
The indicator allows you to trade binary options. The recommended time frame is М1 and the expiration time is 1,2,3 minutes. The indicator suitable for auto and manual trading. A possible signal is specified as a arrows above/under a candle. You should wait until the candle closes! Arrows are not re-painted Trade sessions: TOKYO section (Half-end) Currency pairs: USD/JPY Working time frame: M1 Expiration time: 1,2,3 minutes. The indicator also shows good results when using the martingale strateg
FREE
Pips Hunter PRO は数年かけて開発され、前作の改良版です。この強力なインジケーターは、マーケットと価格の履歴を分析し、売買エントリーを生成します。これらのエントリーの計算には、複雑な統計的対数だけでなく、連動する様々なインジケーターを使用し、不利なエントリーをフィルタリングして排除します / MT5バージョン 。 ストラテジーの高い効率性を維持するための絶え間ない探索により、価格は徐々に上昇し、1000ドルに達します。次回価格→ 69ドル 特徴 リペイントなし このインディケータは、新しいデータが到着してもその値を変更しません ラグなし このインディケータはラグがありません 取引ペア すべてのFXペア  (できればEURGBP) 時間枠  すべての時間枠 パラメータ ===== 表示 矢印の距離 // シグナル(矢印)とローソク足の距離 ===== アラート ポップアップアラート // MT4ターミナル用のアラート プッシュ通知 // 携帯電話向けアラート メールアラート // メールアラート ===== チャート
Improved version of the free HMA Trend indicator (for MetaTrader 4) with statistical analysis. HMA Trend is a trend indicator based on the Hull Moving Average (HMA) with two periods. HMA with a slow period identifies the trend, while HMA with a fast period determines the short-term movements and signals in the trend direction. The main differences from the free version: Ability to predict the probability of a trend reversal using analysis of history data. Plotting statistical charts for analyz
このプロダクトを購入した人は以下も購入しています
驚異的なFXインジケーター「Miraculous」をご紹介します。完璧な結果を得るための1時間足を含むすべてのタイムフレームで効果的に機能する、最強の強力な特殊MT4フォレックスインジケーターです。 すべてのタイムフレームで優れた結果を提供する最高のFXインジケーターを探し続けるのに疲れましたか?これ以上探す必要はありません!「Miraculous」フォレックスインジケーターをご紹介します。このインジケーターは、トレーディングの経験を変革し、収益を新たなレベルに引き上げるために設計されました。 先進のテクノロジーと長年にわたる緻密な開発に基づいて構築された「Miraculous」フォレックスインジケーターは、FX市場における力と正確さの頂点となります。この素晴らしいツールは、すべてのレベルのトレーダーのニーズを満たすように設計されており、一貫した収益性を追求する上で比類のない優位性を提供します。 「Miraculous」フォレックスインジケーターの他との違いは、その非常に適応性にあります。デイトレーダー、スウィングトレーダーであろうと、長期ポジションを好む方であろうと、このインジケータ
TrendMaestro
Stefano Frisetti
5 (2)
note: this indicator is for METATRADER4, if you want the version for METATRADER5 this is the link: TRENDMAESTRO recognizes a new TREND in the bud, he never makes mistakes. The certainty of identifying a new TREND is priceless. DESCRIPTION TRENDMAESTRO identifies a new TREND in the bud, this indicator examines the volatility, volumes and momentum to identify the moment in which there is an explosion of one or more of these data and therefore the moment in which prices have strong probability of f
How to use Pair Trading Station Pair Trading Station is recommended for H1 time frame and you can use it for any currency pairs. To generate buy and sell signal, follow few steps below to apply Pair Trading Station to your MetaTrader terminal. When you load Pair Trading Station on your chart, Pair Trading station will assess available historical data in your MetaTrader platforms for each currency pair. On your chart, the amount of historical data available will be displayed for each currency pai
Indicator : RealValueIndicator Description : RealValueIndicator is a powerful tool designed specifically for trading on the EURUSD pair. This indicator analyzes all EUR and USD pairs, calculates their real currency strength values, and displays them as a single realistic value to give you a head start on price. This indicator will tell you moves before they happen if you use it right. RealValueIndicator allows you to get a quick and accurate overview of the EURUSD currency pair tops and bottoms,
もちろんです。以下は、提供いただいたテキストの日本語への翻訳です: MT4用の天文学指標をご紹介します:究極の天体トレーディングコンパニオン トレーディング体験を天空の高みに高める準備はできていますか?私たちの革命的なMT4用の天文学指標をご紹介します。この革新的なツールは、複雑なアルゴリズムの力を借りて、類まれなる天文学的洞察と精密な計算を提供します。 あなたの指先で宇宙の情報を: 宝のような天文学的データが明らかになる包括的なパネルをご覧ください。惑星の地理的/太陽中心座標、太陽と地球の距離、星の大きさ、伸び、星座、黄道座標および赤道座標、さらには水平座標まで、それぞれが綿密に計算され美しく表示されています。指標によって生成される垂直線は時間値に対応し、トレーディングの旅に宇宙の視点を提供します。 惑星のラインと関係: グラフを飾る惑星のラインの魔法を体験し、スケールと角度をカスタマイズできます。直感的なコントロールパネルを介して各惑星のラインの表示を簡単に切り替えることができます。指定された時刻範囲内での合会、六分会、四分会、三分会、対会、逆行の指標で天体の関係の芸術を発見してく
PZ Day Trading
PZ TRADING SLU
3.67 (3)
このインディケータは、価格アクション分析とドンチャンチャネルのみを使用して、ジグザグ方式で価格の反転を検出します。再描画やバックペインティングを一切行わずに、短期取引向けに特別に設計されています。それは彼らの操作のタイミングを増やすことを目指している賢明なトレーダーにとって素晴らしいツールです。 [ インストールガイド | 更新ガイド | トラブルシューティング | よくある質問 | すべての製品 ] 驚くほど簡単に取引できます すべての時間枠で価値を提供します 自己分析統計を実装します 電子メール/音声/視覚アラートを実装します 可変長のブレイクアウトと混雑ゾーンに基づいて、インディケータは価格アクションのみを使用して取引を選択し、市場が非常に高速に行っていることに反応します。 過去のシグナルの潜在的な利益が表示されます この指標は、独自の品質とパフォーマンスを分析します 負けブレイクアウトは強調表示され、説明されます インジケータは、非バックペインティングおよび非再ペイントです この指標は、日中のトレーダーが単一の価格反転を見逃さないようにするのに役立ちます。ただし、す
Please send me Direct message on MQL5 CHAT after purchasing the Indicator for Training and Installation Support There are some additional files that is important to use with the Indicator . So be sure to contact me after purchasing the Indicator So that I can add you for training and support . If you find any difficulty with installation then send me Direct message here So that I can connect with you via Anydesk or Teamview for the product installation. " Smart Order Block Indicator " to find
Gann Signal is a very simple indicator at first glance, but hidden inside is many years of experience in studying W.D.Ganna methods. The indicator gives accurate BUY/SELL signals, without redrawing. The indicator is very easy to use. All you need to do is attach it to your chart and follow its recommendations. The indicator constantly analyzes the market for entry opportunities. When such an opportunity appears, the indicator gives a signal in the form of an arrow. I repeat, all signals are NOT
[ MT5 Version ] Order Block Indicator MT4 Order Block Indicator MT4  is currently the most accurate and customizable indicator in the market. It has been developed to facilitate the analysis of operations based on Order Blocks and Supply and Demand Zones. These zones are possible reversal points of a movement. Order Blocks indicate a possible accumulation of orders in one area. The price usually gets to reach and react strongly to those areas. The most relevant levels for this reaction are the c
Candle Power Pro
Thushara Dissanayake
4.33 (6)
Candle Power Pro インジケーターを使用して、実際のボリューム情報の力を解き放ちます。この動的ツールは、各ローソク足の実際の体積データを取得し、それを総体積のパーセンテージとして表示します。そうすることで、市場での買い手と売り手の間で進行中の争いを識別できるようになります。 Candle Power Pro は、買い手と売り手の争いを総取引高に対する割合として表示し、市場のダイナミクスに関する貴重な洞察を提供します。買い手と売り手のボリュームを分析することでブレイクアウトを簡単に確認でき、より正確なエントリーポイントとエグジットポイントを確保できます。さらに、買い手と売り手のボリュームを利用して傾向を確認することができ、取引戦略の信頼性が高まります。さらに、買い手と売り手の量の変化を分析することでトレンドの反転を特定できるため、市場の変化に先んじることができます。 このインジケーターは、取引体験を向上させるためのさまざまな機能を提供します。簡単に視覚化できるようにボリューム平均を線として描画したり、ボリュームのパーセンテージを他の 19 個のシンボルと比較してさらに分析し
Weis Wave with Alert
Trade The Volume Waves Single Member P.C.
4.79 (19)
Rental/Lifetime Package Options and Privileges' * For optimum results the yearly or lifetime package is suggested due to live training and Discord  channel trading with the  creator! Rent Monthly Six Months   Yearly/Lifetime Weis Wave with Speed with Alert+Speed Index x x x Manual  x x x Quick Set up Video x x x Blog x x x Lifetime Updates x x x Setup and Training Material x x Free Rectangle Break Alert Tool      x Discord Access Channel "The SI traders" x 2-hour live methodology traini
マーチンゲールアローは、マーチンゲールバイナリーオプション取引用に設計された矢印タイプのMT4インジケーターで、この矢印はバーオープン/バー内に印刷され、アラートを与えます。 使用方法: 矢印が表示された瞬間に取引を開始し、取引が勝った場合は次のシグナルを待って同じロットを取引します。次のシグナルでトレードがダブルロットを失い、シグナルが勝つまでそれを続けた場合、リセットして最初のトレードロットでトレードします。 推奨される期間 : 任意 最低入金額: 200 ユニット。 このインジケーターはライブでは再ペイント/バックペイントを行いません。 -------------------------------------------------- ------------- パラメーター : インジケーター期間: これを変更すると、異なるシグナルが表示されます。 インジケーターの価格/種類 買われすぎ/売られすぎレベル アラート入力 矢印スタイル ========================================
System Trend Pro - This is the best trend trading indicator!!! The indicator no repaint!!!   The indicator has   MTF   mode, which adds confidence to trading on the trend (   no repaint   ). How to trade? Everything is very simple, we wait for the first signal (big arrow), then wait for the second signal (small arrow) and enter the market in the direction of the arrow. (See screens 1 and 2.) Exit on the opposite signal or take 20-30 pips, close half of it, and keep the rest until the oppo
フルSTOインジケータ(3つのSTOインジケータのすべてのバージョンを含む:プレミアム、ゴールド、シルバー) - STABLE TRADE OPTIONは、自動バイナリーオプション取引のために設計されています。 注意深くお読みください! 重要 1つのターミナルで、異なる有効期限を持つ2つのテンプレートを作成します。18:01、18:02のテンプレートは有効期限が1~15分、22:00のテンプレートは有効期限が10~20分です。 勝率:過去5年間で71 資金管理: 預金から0.3 このバージョンのインジケータは、モスクワ時間18:01、18:02、22:00の取引にのみ設定され、有効期限は銀と金が1~15分、プレミアムバージョンは10~20分です。シグナルはローソク足の内側に表示され、すぐに取引を開始します。 インジケータは完全に設定されているので、自分で何かを変更する必要はありません。インストールして取引してください! 実際の口座でstoの全バージョンをチェックし、結果を確認するのに2年以上かかりました。長年のテストの結果、最適なパラメータが選択さ
Connect Indicator is a tool used for connecting indicators between the MQL market and MT4. The connected indicators are made by our group and can be used for other applications, such as sending messages to the Line application or Telegram application. If you have any questions, please don't hesitate to ask us to receive support. Function and indicator buffer Buffer one is the high price of the previous candle. Buffer two is the high price of the previous candle. Usage To connect indicators to fu
Idea: RSI ( Relative Strength Index) and CCI ( Commodity Channel Index ) are powerfull to solved the market.  This indicator has Smoothed Algorithmic signal of RSI and CCI. So that, it separates the market into buy and sell zones, these areas are marked with arrows, red for downtrend, green for uptrend. This algorithm has the effect of predicting the next trend based on the historical trend, so users need to be cautious when the trend has gone many candles. Please visit screenshots
DESCRIPTION The CHAOS INDICATOR has been developed to be used for the TRADING STRATEGY OF CHAOS, as described in the book. The book is in italian language only and can be obtained only on my website indicated below. DATAS COLLECTED AND SHOWN ON GRAPHS The CHAOS INDICATOR apply easily to any graph and any asset, and it is a TRADING FACILITATOR, as it identify immediately the following items on any graph: - The GP (= RIGHT PRICE) i.e. the price to which the asset should be attracted within 24
This indicator is based on the mathematics of the great trader W.D. Ganna. With its help, you can easily find strong levels by analyzing swings to find the optimal entry point. The indicator works on all instruments and all timeframes. The indicator is fully manual and has control buttons. All you need to do is press the NEW button, a segment will appear, which you can place on any movement, swing or even 1 candle that you want to analyze. By placing the segment, press the OK button. A grid (th
発見が困難で頻度が少ないため、分岐は最も信頼できる取引シナリオの1つです。このインジケーターは、お気に入りのオシレーターを使用して、通常の隠れた分岐点を自動的に見つけてスキャンします。 [ インストールガイド | 更新ガイド | トラブルシューティング | よくある質問 | すべての製品 ] 取引が簡単 通常の隠れた発散を見つけます 多くのよく知られている発振器をサポート ブレイクアウトに基づいて取引シグナルを実装します 適切なストップロスおよび利益レベルを表示します 設定可能なオシレーターパラメーター カスタマイズ可能な色とサイズ バー単位でサイズ別に分岐をフィルタリング パフォーマンス統計を実装します 電子メール/音声/視覚アラートを実装します 幅広い市場の見通しを提供するために、異なるオシレーターを使用して、干渉なしで同じチャートにインジケーターを何度もロードできます。このインジケーターは、次のオシレーターをサポートしています。 RSI CCI MACD オスマ 確率的 勢い 素晴らしい発振器 加速器発振器 ウィリアムズパーセントレンジ 相対活力指数 特に外国為替市
スイングトレーディング は、トレンドの方向のスイングと可能な反転スイングを検出するように設計された最初のインジケーターです。トレーディングの文献で広く説明されているベースラインスイングトレーディングアプローチを使用します。インディケータは、いくつかの価格と時間のベクトルを調査して、全体的なトレンドの方向を追跡し、市場が売られ過ぎまたは買われ過ぎて修正の準備ができている状況を検出します。 [ インストールガイド | 更新ガイド | トラブルシューティング | よくある質問 | すべての製品 ] むち打ちを起こさずに市場スイングの利益 インジケーターは常にトレンドの方向を表示します 色付きの価格帯は機会のベースラインを表します 色付きのダッシュは、可能な反転スイングを表します この指標は、独自の品質とパフォーマンスを分析します 複数時間枠のダッシュボードを実装します カスタマイズ可能なトレンドおよびスイング期間 電子メール/サウンド/プッシュアラートを実装します インジケータは再描画またはバックペインティングではありません Swing Tradingとは Swing Tradi
A. A2SR とは何ですか ?   * 先行テクニカル指標です (塗り直しなし、ラグなし)。 -- ガイダンス : -- https://www.mql5.com/en/blogs/post/734748/page4#comment_16532516 -- そして https://www.mql5.com/en/users/yohana/blog A2SR には、サポート (需要) とレジスタンス (供給) のレベルを決定する特別な手法があります。 ネットで見かける通常の方法とは異なり、A2SR は実際の SR レベルを決定する独自のコンセプトを持っています。 元の手法はインターネットから取得されたものではなく、インターネット上で公開されたこともありません。 A2SR は、取引スタイルに応じて SR レベルを自動選択します。 時間枠を変更しても、SR レベルはその位置にとどまります。 実際のSRは、使用する時間枠から取得されるわけではないため. A2SR には、取引のための完全な手段があります 。 実際のサポート (需要) とレジスタンス (供給) の真のコンセプト。
The BB Reversal Arrows technical trading system has been developed to predict reverse points for making retail decisions. The current market situation is analyzed by the indicator and structured for several criteria: the expectation of reversal moments, potential turning points, purchase and sale signals. The indicator does not contain excess information, has a visual understandable interface, allowing traders to make reasonable decisions. All arrows appear to close the candle, without redr
Gold Channel is a volatility-based indicator, developed with a specific timing algorithm for the XAUUSD pair, which consists of finding possible corrections in the market. This indicator shows two outer lines, an inner line (retracement line) and an arrow sign, where the theory of the channel is to help identify overbought and oversold conditions in the market. The market price will generally fall between the boundaries of the channel. If prices touch or move outside the channel it is a tra
ECM Elite Channel is a volatility-based indicator, developed with a specific time algorithm, which consists of finding possible corrections in the market. This indicator shows two outer lines, an inner line (retracement line) and an arrow sign, where the channel theory is to help identify overbought and oversold conditions in the market. The market price will generally fall between the boundaries of the channel. If prices touch or move outside the channel, it's a trading opportunity. The
This indicator identifies and displays zones, as it were areas of strength, where the price will unfold. The indicator can work on any chart, any instrument, at any timeframe. The indicator has two modes. The indicator is equipped with a control panel with buttons for convenience and split into two modes. Manual mode: To work with manual mode, you need to press the NEW button, a segment will appear. This segment is stretched over the movement and the LVL button is pressed. The level is displayed
Full Forex Market View Dashboard
Opengates Success International
5 (2)
FULL FOREX MARKET VIEWダッシュボードインジケーター これは、トレーダーが市場で何が起こっているかを完全に把握できるようにするために作成されたカスタム指標です。 リアルタイム データを使用して市場にアクセスし、取引を成功させるために必要なあらゆる情報を表示します。 インストール: このインジケーターをウィンドウ チャートに添付する前に、MT4 のマーケット ウォッチ パネルに移動し、不要な通貨ペアまたは取引しないすべての通貨ペアを非表示にして、残りをそこに残します。 その理由は、FFMV ダッシュボードが MT4 の気配値表示に表示されるすべての通貨ペアを表示するためです。 最大 30 通貨ペア以下を表示できます。 MT4 の気配値表示でそれ以上だと、FFMV ダッシュボードのフォントと画像がぼやけて変形します。 正しく表示されません。 使用法:      個人取引の場合      バスケット取引の場合 (方法についてはスクリーンショットを参照してください)      複数注文取引にも使用可能      独自の取引システムなどから
The indicator is designed to work on any trading platform. The program is based on proprietary algorithms and W.D.Ganna's mathematics, allowing you to calculate target levels of price movement based on three points with the highest degree of certainty. It is a great tool for stock trading. The indicator has three buttons: NEW - call up a triangle for calculation. DEL - delete the selected triangle. DELS - completely remove all constructions. The probability of achieving the goals is more than 80
EZTトレンドインジケーターは、トレンド、プルバック、エントリーの機会を示します。 オプションのフィルタリングとあらゆるタイプのアラートが利用可能です。 電子メールおよびプッシュ通知アラートが追加されます。 また、このインジケーターに基づいた EA も開発中であり、間もなく利用可能になる予定です。 2色のヒストグラムとラインで構成される多機能インジケーターです。 これはトレンドの方向と強さを視覚的に表現したもので、ラインまたはヒストグラム上で発散が何度も見つかります。 このインジケーターは自動パラメーター設定とうまく連携します。 これらは特定の時間枠に対して事前に決定されており、その設定でインジケーターを使用することをお勧めします。 手動モードでは、独自のパラメータを設定できます。 これはマルチタイムフレーム(MTF)インジケーターです。 このインジケーターは、MTF rsi、MTF cci、MACD pro などの他のインジケーターの組み合わせとうまく機能します。 取引される商品の変動が大きいほど、最適なエントリーを見つけるために使用する必要がある時間枠は短くなりま
IA Trendx3 PRO
Marco Aurelio Santos Costa
What if God Created a Trade System? No miracles... Just see how mathematics can be effective in the market. We managed to combine technical analysis / price action into indicators, creating the best setup for trading, be it in Forex, Indices, or stocks. It took us 2 years to create something that really works, and now it's time for you to discover it. TrendX3 is a revolution in trend analysis. Based on advanced algorithms and real-time data, it provides valuable insights so that you can make inf
This is a trend Predictor. Honestly I have to give some credit to some few developers I know personally because they helped pulled this off.  The trend indicator uses special optics to direct the flow of price . it detects where the trend is moving into  It uses price action and a few other embedded custom indicator. You can use it in all timeframes and will be available at a much cooler price.  Please test this Indicator before buying to make sure you like what you see. I can't guarantee th
作者のその他のプロダクト
Sniper MACD
Yaroslav Varankin
4.08 (12)
いくつかの方法で改良されたスナイパーMACDインジケーター。 追加のフィルタがあります 最大の結果を得るために数回平滑化される 市場および現在の価格条件に関する情報をより正確に表示するために、ボリュームインジケータも追加されます 短期的な期間に設定されているので、m1からm30までの期間に指標を使用することをお勧めします eur.usd - eur.jpyのような非常に揮発性の高い通貨ペアで取引することをお勧めします あなたの注意と落札していただきありがとうございます。 ----------------------------------------------------------------------------------------------------------------------------- いくつかの方法で改良されたスナイパーMACDインジケーター。 追加のフィルタがあります 最大の結果を得るために数回平滑化される 市場および現在の価格条件に関する情報をより正確に表示するために、ボリュームインジケータも追加されます 短期的な期間に設定されているので、m1から
FREE
RVI Sniper Alert
Yaroslav Varankin
4.5 (2)
これが究極のRVIインジケータです。 警告矢印を追加 潜在的な抵抗レベルを特定することができます 読み値を改善するための2つの追加フィルタ それはさらに良好な結果を示すために平滑化される m1からm30までの短い時間枠で構成されていました ひどく悪くはありません スクリーンショットmacdのように、このインジケータを追加のフィルタとともに使用することをお勧めします これが究極のRVIインジケータです。 警告矢印を追加 潜在的な抵抗レベルを特定することができます 読み値を改善するための2つの追加フィルタ それはさらに良好な結果を示すために平滑化される m1からm30までの短い時間枠で構成されていました ひどく悪くはありません スクリーンショットmacdのように、このインジケータを追加のフィルタとともに使用することをお勧めします
FREE
indicator for binary options! open a deal only for 1 - candle The indicator is already set to trade in binary options. The indicator is ideal for trading on martingale since he very accurately combines what the next candle will be if you are trading in a martingale money management, this is the indicator that you were looking for; it is just created for you and your trading style p.s it is much better than relying on the color of the candle as some not very experienced traders do (therefore, the
Revolution Martingale is an indicator designed for trading binary options on the M5 timeframe. Features: M5 Timeframe: It is recommended to use the indicator on the M5 timeframe for optimal trading. Trade Opening: Trades should only be opened when a signal appears on the 1st candle after opening and signal appearance. Signals: A blue rhombus indicates a potential upward purchase opportunity, while a red rhombus indicates a potential downward option purchase opportunity. Configured for Effective
FREE
Mega Alert Level : A Simple yet Invaluable Indicator This assistant delivers sound, informational, push, and email notifications of your choice when the currency pair's price touches or approaches standard support and resistance levels or any other objects on the chart that you select. The indicator attaches to horizontal support and resistance lines or any other objects on the chart that you choose, plotted on the chart using the terminal's standard tools. In the settings window, you only need
FREE
Scalping Binary option Pro is a dial gauge. --------complete lack of redrawing --------- The indicator does not work correctly in the strategy tester.  The red down arrow indicates that sales should be considered, and the green one - up (purchases).  All that needs to be set up is the colors of the signal arrows, as well as the activation or deactivation of the sound signal when a signal appears in one direction or another.  It is best to use high-pair pairs with a small spread in tradin
Almas Wall Street is a professional arrow indicator with no repainting. Signals appear simultaneously with the formation of a candle. Trading Guidelines: Enter a trade for at least 2 candles or on the next candle after the signal for 1 candle. Screenshot 5 . A red arrow pointing down suggests considering sales, while a blue arrow suggests buying. All you need to configure are the colors of the signal arrows. It is recommended to apply this indicator in scalping on timeframes M1-M5. Signals occur
Brilliant Wall Street is a professional arrow indicator.  It is based on a mathematical calculation.  thanks to a special calculation algorithm that was developed by the best specialists  he is not late, moreover, he gives advanced signals.  -----------almost complete absence of redrawing------------.  signals appear with the advent of the candle.  It is recommended to enter a trade for at least 1-2 candles on the next candle, but you can also use a signal...  The red down arrow indicates
This is a dial indicator for trading from the level of support resistance  --- complete lack of redrawing ---  He is able to determine the levels of support resistance  Finds the best entry points and shows them with arrows.  If a trend is forming, the indicator will always notify with a arrow signal.  buy signal blue arrow for sale red arrow  This signaling tool can also be used on a sideways market.  The main thing is that it is volatile.!!!!!!  The percentage of correct indicator pre
I n the tester does not work, see how it works in the video; sorry for the inconvenience. UTB is done for real-time work quotation when trading. indicator draws resistance support levels Also, when a level appears, an arrow appears where to open a deal. You will not miss any desired level approach. The indicator showed good results on all graphs and time frames. recommended settings step 1800 p.s traders selling from wall street also use resistance support levels in their analytics how do
Esta es una de las modificaciones de los canales Keltner. Ayuda a identificar puntos de entrada y salida lógicos. Ayuda a determinar un posible movimiento de precios. Crea canales equidistantes que se convierten en niveles de soporte y resistencia dinámicos. Facilita enormemente el análisis del mercado visual. El indicador es un multi-tiempo multi-tiempo muestra buenos resultados.
trading indicator, which automatically recognizes equal levels of support and resistance and otorova content and resistance and poison indicator uses elder system can be applied to any financial instruments and on any timeframes. the same indicator draws to. it is perfect for scalping as its essence is to trade in the channel. The indicator has many parameters that allow it to be conveniently customized. indicator settings filter - it filters the market noise that is, we get more accurate channe
The Bad Boys indicator is a arrow indicator percentage (of positive trades) of correct forecasts of the indicator, even during news releases, the indicator was tested on a real account and showed a good result of correct forecasts. Settings allow you to customize the color of the arrows. volatility period indicator period the number of bars for which the market analysis will be carried out price is the method when a signal will appear when opening when closing a candle, etc. volatility allows yo
Dream Wall Street   It represents the visualization of support resistance levels. the indicator marks the levels that are formed on a candle whose tick volume exceeds the average volume; it is perfect as it is without filters for scalping by level it can also be used as an addition to an existing trading system. The indicator can be used as a filter. It is already set up to configure anything for you. Settings allow you to customize the light levels
The Divergent Accuracy indicator is designed to identify discrepancies on the price chart of a currency pair. The Divergent Accuracy indicator recognizes bullish and bearish divergences, and can also output a signal that a divergence has been detected... In addition to identifying divergences, the indicator works with overbought and oversold levels, and also shows arrows to enter the market...
The premium loudness indicator draws on the chart of a currency pair based on data on the price level in the back period in the input parameters of the indicator in the form of a histogram. The width of the histogram at this level means, conditionally, the number of transactions conducted on it If the broker provides real volume data, Cannot be received For example, the range H1 can be specified as H1, H4, D1, W1, MN1. For M1, it is recommended to use periodic settings for M5 values.
Premium Volume Lite The Premium Volume Lite indicator plots the distribution of deals according to price levels in the form of a histogram on a chart of a currency pair. The width of the histogram at this level means, conditionally, the number of transactions carried out on it. If the broker provides data on real volume, the indicator can show the distribution over it. Ranges can be equal only to standard timeframes not lower than the current one. о periods value is current then the indicator wi
The Invisible Sniper arrow indicator is built on the use of candlestick analysis. The indicator finds the “Absorption” reversal candlestick patterns on the price chart and, depending on the figure, bullish or bearish absorption, gives a signal to enter in the form of blue arrows to buy, red to sell. in the indicator Invisible Sniper implemented sound and text alert..
Big Scalper Pro комбинированный осциллятор, отображающий на ценовом графике  Сигналы на вход отображаются в виде стрелок соответствующего цвета, а также дублируются текстовым сообщением. есть звуковые и текстовые алерты push уведомления уведомления на email все это можно включить и выключить в настройках индикатора настройки период это период г л авного индикатора в период это период дополнительного индикатора волатильности
Dawn In Trading indicator is a new ray of light in trading! This indicator has been tested on a real chart in real trading; All statistics about this indicator from real trading on the market! From the screenshots you can see the profitability of quality and the number of signals of this tool, you can also check it in the tester! As soon as a blue arrow appears, open a deal to increase, when a red arrow appears, open a deal to fall! Signals appear when you open a new candle and do not redraw,
It is possible to trade on any basic asset, but the experts holding testing give preference to currency pair USD/JPY, EUR/USD. Optimum time for work is considered European, the American session. with the standard settings which are already perfected to an ideal At emergence of a blue arrow under a candle the option UP is acquired. At emergence of a red arrow the option DOWN is acquired. It should be noted one feature of the indicator: the signal is formed on the current bar, but it is wo
boss ! Trading opportunities can be used in any underlying asset, but experts in conducting tests prefer the currency pair USD / JPY. The most favorable time for work is the European, American session. When the blue arrow appears, a red option under the candle is acquired UP. When the red arrow appears, the option DOWN is acquired. It is recommended to avoid trading during strong news releases
This indicator was tested on the basis of real statistics for all market indicators according to indicators for 3 months of trading. trade forecasts for usd / jpy on the m30 time frame were received on our statistics! if you have any questions, please contact us in private messages or in discussions under this indicator and we will figure it out and help any questions will arise personal messages or in discussions under this indicator As soon as the blue points appear, we open a deal to incr
The indicator is designed for opening trades for a long period. he is set up to get as many points from each trade as possible. he uses the scalping method... you can trade on any currency pairs indicator is already  you can trade at any time of the day but the preferred time of trading during the European American session. currency pairs eur / jpy, eur / usd currency pairs with high volatility then the results are much better.
Venom
Yaroslav Varankin
Venom indicator is a new type of indicator for scalping with high accuracy of correct predictions in the indicator you can select the indicator signal does not redraw, does not disappear, you can trust it 100% When a red blue arrow appears under the candlestick, an UP option is purchased. When red arrows appear, the DOWN option is purchased. the indicator is based on our new development, if there is an order with a large amount that opens in the direction we need, according to the analysis of th
the indicator showed excellent results in the scalping trade, and the same excellent results in the trading of exact instruments led to the fact that of these indicators showed themselves perfectly during the exit from the news with an  during low volatility,  This instrument has been tested for more than 1 month. What can we say about the number? It is reliable, accurate, at any time of trading. Atom Pro Maximum, this indicator showed excellent results in scalping trading. The accuracy of this
can recognize candlestick patterns he also recognizes the lows and highs of the price for a certain time. MTF works on all currency pairs in futures and sulfur, cryptocurrency does not redraw. his work can be seen in the test. you can trade at any time of the day but the preferred trading time during the European American session ----------------------------------------------------------------------------------------------------------------------------------------------------------
Multi-timeframe indicator perfectly determines when there will be a rollback from the level ideal for binary options. of correct true signals Forex Stop Loss trading can be dragged behind the line thereby moving the deal to breakeven there is a signal in the indicator. The indicator showed excellent results during testing. Test in the test and make sure it is accurate. For any questions, suggestions, please always communicate with you.
multi-timeframe indicator. Ideal for both the Forex market and binary options. Good accuracy of this tool the indicator showed excellent results during testing. test it in a tester and make sure it is accurate.... complete lack of redrawing. You can choose absolutely any instrument. the indicator will provide many profitable and accurate signals. advantages of the indicator: advanced signals. high signal accuracy. frequency of occurrence of signals.
Revolution Martingale Pro indicator for binary options! at the time of opening and the appearance of the signal! Blue diamond is shopping up. A red diamond is an option down. The indicator is already set to trade in binary options. ----------- protection is set against hitting on (steps - martingale knees) protection of several minuses under the row. ------------------------------------------- (Redrawing possible)
フィルタ:
レビューなし
レビューに返信