• 概要
  • レビュー (1)
  • コメント

Bulls e Bears Composite

5
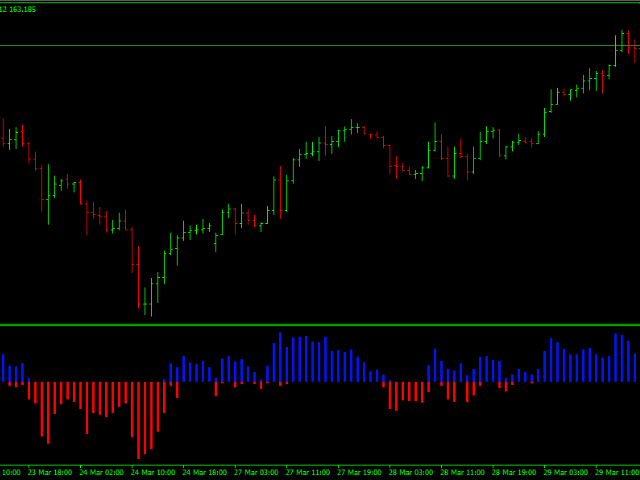
Many traders use The Bull-Bear Indicator, I decided to combine the two into just one, so the visualization is better, and I am sharing it with you. the trading rules remain the same, you can adjust the period as per your preference.

The Bull-Bear Indicator is a free indicator with several versions widely published on the internet, this is just a version that I put together, I hope you like it. If you want to know the indicators of my authorship, please visit my page here.
レビュー 1
trick 86
374
trick 86 2023.04.06 00:44 
 

awesome version thanks

おすすめのプロダクト
Follow The Line
Oliver Gideon Amofa Appiah
4 (13)
FOLLOW THE LINE GET THE FULL VERSION HERE: https://www.mql5.com/en/market/product/36024 This indicator obeys the popular maxim that: "THE TREND IS YOUR FRIEND" It paints a GREEN line for BUY and also paints a RED line for SELL.  It gives alarms and alerts of all kinds. IT DOES NOT REPAINT and can be used for all currency pairs and timeframes. Yes, as easy and simple as that. Even a newbie can use it to make great and reliable trades. NB: For best results, get my other premium indicators for more
FREE
QuantumAlert RSI Navigator is a free indicator available for MT4/MT5 platforms, its work is to provide "alerts" when the market is inside "overbought and oversold" regions in the form of "buy or sell" signals. This indicator comes with many customization options mentioned in the parameter section below, user can customise these parameters as needful. Join our   MQL5 group , where we share important news and updates. You are also welcome to join our private channel as well, contact me for the pri
FREE
MACD indicator in MetaTrader 4/5 looks different than MACD does in most other charting software. That is because the MetaTrader 4/5 version of MACD displays the MACD line as a histogram when it is traditionally displayed as a line. Additionally, the MetaTrader 4/5 version computes the Signal line using an SMA, while according to MACD definition it is supposed to be an EMA. The MetaTrader 4/5 version also does not compute a true MACD Histogram (the difference between the MACD/Signal lines). This
FREE
The indicator displays signals according to the strategy of Bill Williams on the chart. Demo version of the indicator has the same features as the paid, except that it can work only on a demo account . Signal "First Wise Man" is formed when there is a divergent bar with angulation.  Bullish divergent bar - with lower minimum and closing price in the upper half. Bearish divergent bar - higher maximum and the closing price at the bottom half. Angulation is formed when all three lines of Alligat
FREE
This indicator has been created for finding the probable reversal points of the symbol price. A small candlestick reversal pattern is used it its operation in conjunction with a filter of extremums. The indicator is not redrawn! If the extremum filter is disabled, the indicator shows all points that have a pattern. If the extremum filter is enabled, the condition works – if the history Previous bars 1 candles back contains higher candles and they are farther than the Previous bars 2 candle, such
FREE
これは、ほぼ10年前に初めて公開された私の有名なスキャルパー、ゴールドフィンチEAの最新版です。短期間で起こる急激なボラティリティの拡大で市場をスキャルピングします。突然の価格上昇の後、価格変動の慣性を利用しようとします。この新しいバージョンは、トレーダーがテスターの最適化機能を簡単に使用して最適な取引パラメーターを見つけられるように簡素化されています。 [ インストールガイド | 更新ガイド | トラブルシューティング | よくある質問 | すべての製品 ] 最適化を容易にするシンプルな入力パラメーター カスタマイズ可能な取引管理設定 取引セッションの選択 平日の選択 資金管理 注意してください... 多くの要因が見返りを台無しにする可能性があるため、ダニのダフ屋は危険です。変動スプレッドとスリッページは、取引の数学的期待値を低下させ、ブローカーからの低いティック密度は幻の取引を引き起こす可能性があり、ストップレベルは利益を確保する能力を損ない、ネットワークラグはリクオートを意味します。注意が必要です。 バックテスト Expert Advisorはティックデータのみを使
FREE
PZ The Zone
PZ TRADING SLU
4.25 (4)
This indicator displays buy or sell signals according to Bill Williams' definition of the Trading Zone. [ Installation Guide | Update Guide | Troubleshooting | FAQ | All Products ] Easy to use and understand Avoid trading flat markets Deterministic indicator with clear rules The indicator is non-repainting It implements alerts of all kinds It has straightforward trading implications. A blue arrow is a buy signal A red arrow is a sell signal According to Bill Williams trading in the zone helps to
FREE
BoB Candles AM
Andriy Matviyevs'kyy
5 (1)
The indicator improves the idea implemented in the standard Bulls and Bears indicator. The indicator colors candles by analyzing the divergence of the maximum and minimum prices of the current bar with the average value of the maximum and minimum prices over a longer period of time. The indicator does not re-paint on fully formed bars. The indicator is easy to set and efficient on trendy market segments. Adjustable parameters: i_Period - smoothing period for forming the channel; i_Method - smo
FREE
SuperTrend V
Muhammad Hassaan
5 (1)
*This is TradingView indicator converted to mql4* The SuperTrend V indicator is a popular technical analysis tool used to identify trends and potential trend reversals in financial markets. It is based on the concept of the SuperTrend indicator but incorporates additional features and variations. The SuperTrend V indicator uses a combination of price action and volatility to determine the trend direction and generate trading signals. Here are the key components and features of the indicator:
FREE
MASi Three Screens is based on the trading strategy by Dr. Alexander Elder. This indicator is a collection of algorithms. Algorithms are based on the analysis of charts of several timeframes. You can apply any of the provided algorithms. List of versions of algorithms:     ThreeScreens v1.0 - A simple implementation, with analysis of the MACD line;     ThreeScreens v1.1 - A simple implementation, with analysis of the MACD histogram;     ThreeScreens v1.2 - Combines the first two algorithms
FREE
TrendPlus
Sivakumar Subbaiya
4.21 (14)
Trend Plus   Trendplus  Indicator   Time Frame: Suitable for any time frame.  Purpose: Trend Prediction. Blue and red candle indicate the buy and sell call respectively. Buy: When the blue candle is formed buy call is initiated. close the buy trades when the next red candle will formed.   Sell: When the Red candle is formed Sell call is initiated. close the Sell trades when the next blue candle will formed.   Happy trade!!
FREE
BoxInside MT4
Evgeny Shevtsov
4.56 (9)
This indicator calculates the volume profile and places labels that correspond to the VAH, VAL and POC levels, for each candle individually. Indicator operation features The indicator works on the timeframes from M5 to MN, but it uses the history data of smaller periods: M1 - for periods from M5 to H1, M5 - for the H4 period, M30 - for the D1 period, H4 - for the W1 period, D1 - for the MN period. The color and location of the VAL, VAH and POC labels on the current candle are considered to be
FREE
ZigZag Fibo Retracement Indicator Optimize Your Trading Strategy! Are you seeking to optimize your trading strategy in the financial markets? Explore the unique features of the ZigZag Fibo Retracement Indicator, a powerful tool designed to help you identify potential support and resistance levels based on the combination of ZigZag patterns and Fibonacci ratios. Integration of ZigZag Patterns and Fibonacci: The ZigZag Fibo Retracement Indicator combines the effectiveness of ZigZag patterns, helpi
FREE
Free automatic Fibonacci is an indicator that automatically plots a Fibonacci retracement based on the number of bars you select on the BarsToScan setting in the indicator. The Fibonacci is automatically updated in real time as new highest and lowest values appears amongst the selected bars. You can select which level values to be displayed in the indicator settings. You can also select the color of the levels thus enabling the trader to be able to attach the indicator several times with differe
FREE
Trend arrow Indicator is an arrow Indicator used as an assistant tool for your trading strategy. The indicator analyzes the standard deviation of bar close for a given period and generates a buy or sell signals if the deviation increases. It good to combo with Martingale EA to follow Trend and Sellect Buy Only/Sell Only for EA work Semi-Automatic. You can use this  Indicator with any EAs in my Products.
FREE
PZ Penta O MT4
PZ TRADING SLU
2.25 (4)
The Penta-O is a 6-point retracement harmonacci pattern which usually precedes big market movements. Penta-O patterns can expand and repaint quite a bit. To make things easier this indicator implements a twist: it waits for a donchian breakout in the right direction before signaling the trade. The end result is an otherwise repainting indicator with a very reliable trading signal. The donchian breakout period is entered as an input. [ Installation Guide | Update Guide | Troubleshooting | FAQ | A
FREE
Market Profile 3
Hussien Abdeltwab Hussien Ryad
4 (4)
Market Profile 3 MetaTrader 4 indicator  — is a classic Market Profile implementation that can show the price density over time, outlining the most important price levels, value area, and control value of a given trading session. This indicator can be attached to timeframes between M1 and D1 and will show the Market Profile for daily, weekly, monthly, or even intraday sessions. Lower timeframes offer higher precision. Higher timeframes are recommended for better visibility. It is also possible t
FREE
Are you tired of drawing trendlines every time you're analyzing charts? Or perhaps you would like more consistency in your technical analysis. Then this is for you. This indicator will draw trend lines automatically when dropped on a chart. How it works Works similar to standard deviation channel found on mt4 and mt5. It has 2 parameters: 1. Starting Bar 2. Number of bars for calculation The   starting bar   is the bar which drawing of the trend lines will begin, while the   number of bars for c
FREE
価格波形パターン MT4へようこそ --(ABCD パターン)--     ABCD パターンは、テクニカル分析の世界で強力で広く使用されている取引パターンです。 これは、トレーダーが市場での潜在的な売買機会を特定するために使用する調和的な価格パターンです。 ABCD パターンを使用すると、トレーダーは潜在的な価格変動を予測し、いつ取引を開始および終了するかについて十分な情報に基づいた決定を下すことができます。 EA バージョン :   Price Wave EA MT4 MT5バージョン: Price Wave Pattern  MT5 特徴 :  ABCDパターンの自動検出。 強気パターンと弱気パターン。  任意のシンボルと任意の時間枠で機能します。 主要なレベルと価格目標。 カスタマイズ可能な設定と繊維レベルの調整。 アラートと通知。 今後さらに多くの機能が追加される予定です。 
FREE
Royal GER30
Hossein Davarynejad
5 (3)
Royal Ger30  This Expert Working On High Time Farm H1 , H4  the Expert can Analyze The Daily and weekly Trend of the Market and  Open Trade on H1 or H4  Trade have Not SL but have Recovery Lot size  Minim Deposit  1k  Fix Lot 0.01 For EightCap Broker because you can Trade with 0.01 on Stocks    Best Time = H1 Make sure to  Add Set File  Symbol GER30,GER Cash , DE40, DE30  on Eightcap  Broker  No need Set File  this Expert Have Auto Set File 
FREE
Check my paid tools they work great and I share Ea's based on them for free please r ate The Dual Timeframe RSI (Relative Strength Index) indicator is a novel trading tool that allows traders to monitor RSI readings from two different timeframes on a single chart. This dual perspective enables traders to identify potential trend confirmations and divergences more effectively. For instance, a trader might use a 1-hour RSI alongside a daily RSI to ensure that short-term trades align with the bro
FREE
Free informative Indicator-helper. It'll be usefull for traders who trade many symbols or using grid systems (Averaging or Martingale). Indicator counts drawdown as percent and currency separate. It has a number of settings: Count deposite drawdown according equity value and send e-mail or notifications to user if DD more than set; Sending e-mail when max open orders reached; Shows price and remaining pips amount before MarginCall on current chart and Account generally; Display summary trade lot
FREE
Vik Standart
Ivan Kopchuk
3.86 (7)
Features: 1. Your constructor strategies. 2. Large selection of standard indicators. 3. Exact market entry according to your strategy. 4. Slip filter. 5. Support for four and five characters. 6. Trend trading. 7. Trading in flat. 8. Minimum deposit. 9. Aggressive or quiet trade. 10. Limit the lot. 11. Position tracking. 12. Restoring balance after loss. Input parameters    Lot - fixed lot size.    StopLot - lot restriction.    UseVxod - enable / disable login pattern.
FREE
Adjustable Fractal MT4 is a modification of Bill Williams' Fractals indicator. The fractal consists of a two sets of arrows - up (upper fractals) and down (lower fractals). Each fractal satisfies the following conditions: Upper fractal - maximum (high) of a signal bar exceeds or is equal to maximums of all bars from the range to the left and to the right; Lower fractal - minimum (low) of a signal bar is less or equal to minimums of all bars from the range to the left and to the right. Unlike a s
FREE
Tipu Heikin-Ashi Panel is the modified version of the original Heiken Ashi indicator published by MetaQuotes here . A professional version of this indicator is available here . Features An easy to use Panel that shows the Heiken Ashi trend of selected timeframe. Customizable Buy/Sell alerts, push alerts, email alerts, or visual on-screen alerts. Customizable Panel. The panel can be moved to any place on the chart or minimized to allow more space. Heikin means "the average", and Ashi means "foo
FREE
Triple RSI
Pablo Leonardo Spata
2.5 (2)
LOOK AT THE FOLLOWING STRATEGY   WITH THIS INDICATOR.   Triple RSI   is a tool that uses the classic Relative Strength Indicator, but in several timeframes to find market reversals.    1.  ️ Idea behind the indicator and its strategy: In Trading, be it Forex or any other asset, the ideal is   to keep it simple, the simpler the better . The   triple RSI   strategy is one of the simple strategies that seek market returns. In our experience, where there is more money to always be won, i
FREE
Macd Martin
Roman Yablonskiy
2.5 (2)
Double Breakout   is an automatic expert advisor with two separate strateges that uses martingale. The MACD indicator with adjustable parameters is used as inputs for each flow of orders. The specified takeprofit and stoploss levels are used to exit the position.  General recommendation The minimum recommended deposit is 1000 cents. Spread is recommended not more than 3 points. It is better to use trend currency pairs. The martingale parameter can be set from 0.1 to any value. When martingale
FREE
Rainbow MT4 is a technical indicator based on Moving average with period 34 and very easy to use. When price crosses above MA and MA changes color to green, it’s a signal to buy. When price crosses below MA and MA changes color to red, it’s a signal to sell. The Expert advisor ( Rainbow EA MT4) based on Rainbow MT4 indicator, as you can see in the short video below is now available here .
FREE
Long Waiting MT4
Aleksandr Davydov
5 (1)
Expert description Algorithm optimized for Nasdaq trading The Expert Advisor is based on the constant maintenance of long positions with daily profit taking, if there is any, and temporary interruption of work during the implementation of prolonged corrections The Expert Advisor's trading principle is based on the historical volatility of the traded asset. The values of the Correction Size (InpMaxMinusForMarginCallShort) and Maximum Fall (InpMaxMinusForMarginCallLong) are set manually. Recom
FREE
Intervals MT4
Alexandre Borela
5 (1)
このプロジェクトが好きなら、5つ星レビューを残してください。 インスタグラムでフォロー:borelatech 大規模なボリュームを取引するには、複数の楽器/チャートを調べる必要があります 新しい機会を見つける, このインジケータは、特定の特定のプロットによってあなたを助ける 数またはそのサフィックスの複数のレベルによって、それらを自動的に更新します 価格が変更されると、そうでなければ退屈なタスク。 例えば、GBPUSDでは、インジケーターの4つのインスタンスを チャートをプロットする: 線長100バーの各0.01間隔。 線の長さ25バーの0.0075間隔で終わる各価格。 線長50バーの0.0050間隔で終わる各価格。 25バーの線長で0.0025間隔で終わる各価格。 このようにして、定規に似ているので、この例が非常に見られます。 スクリーンショット。 また、色やラインのスタイルを異なるスタイルで設定できます。 レベルを視覚化しやすいようにします。
FREE
このプロダクトを購入した人は以下も購入しています
Gann Made Easy は、ミスター・ギャンの理論を使用した取引の最良の原則に基づいた、プロフェッショナルで使いやすい外国為替取引システムです。 W・D・ガン。このインジケーターは、ストップロスとテイクプロフィットレベルを含む正確な買いと売りのシグナルを提供します。 PUSH通知を利用して外出先でも取引可能です。 購入後はご連絡ください!私の取引のヒントと素晴らしいボーナスインジケーターを無料で共有します! おそらく、ギャンの取引手法についてはすでに何度も聞いたことがあるでしょう。通常、ギャンの理論は初心者のトレーダーだけでなく、すでにある程度の取引経験がある人にとっても非常に複雑なものです。なぜなら、ギャンの取引手法は理論的にはそれほど簡単に適用できるものではないからです。私はその知識を磨き、最良の原則を私の外国為替インジケーターに組み込むために数年を費やしました。 このインジケーターは非常に簡単に適用できます。必要なのは、それをチャートに添付し、簡単な取引推奨事項に従うだけです。このインジケーターは常に市場分析の仕事を行い、取引の機会を探します。適切なエントリーポイントを検出
現在26%オフ 初心者やエキスパートトレーダーに最適なソリューション! このインジケーターは、独自の機能と新しい計算式を取り入れた、ユニークで高品質、かつ手頃な価格のトレーディングツールです。たった1枚のチャートで28の為替ペアの通貨強度を読み取ることができます。新しいトレンドやスキャルピングチャンスの引き金となるポイントを正確に特定することができるので、あなたのトレードがどのように改善されるか想像してみてください。 ユーザーマニュアルはこちら  https://www.mql5.com/en/blogs/post/697384 これが最初の1本、オリジナルだ! 価値のないクローンを買わないでください。 特別な サブウィンドウの矢印で強い通貨の勢いを表示 GAPがあなたのトレードを導く! 基準通貨や気配値が売られすぎ・買われすぎのゾーン(外相フィボナッチレベル)にあるとき、個別チャートのメインウィンドウに警告表示。 通貨がレンジの外側から反落した場合、プルバック/リバーサルのアラート。 クロスパターンの特別なアラート 複数の時間枠を選択可能で、トレンドを素早く
Reversal First Impulse levels (RFI)    INSTRUCTIONS        RUS       -       ENG              R ecommended to use with an indicator   -   TREND PRO -  Version MT5 A key element in trading is zones or levels from which decisions to buy or sell a trading instrument are made. Despite attempts by major players to conceal their presence in the market, they inevitably leave traces. Our task was to learn how to identify these traces and interpret them correctly. Main functions: Displaying active zones
An exclusive indicator that utilizes an innovative algorithm to swiftly and accurately determine the market trend. The indicator automatically calculates opening, closing, and profit levels, providing detailed trading statistics. With these features, you can choose the most appropriate trading instrument for the current market conditions. Additionally, you can easily integrate your own arrow indicators into Scalper Inside Pro to quickly evaluate their statistics and profitability. Scalper Inside
Break and Retest
Mohamed Hassan
4.64 (11)
New update to V.4 where  Break & Retest automatically draws the take profit & stop loss levels and you also have more signals per day! ‍You can visually backtest Break & Retest to see how it behaved in the past!     Manual guide:   Click here $65  for only 1  copy left! Next price is $120 .  This Indicator only places quality trades when the market is really in your favor with a clear break and retest. Patience is key with this price action strategy! If you want more alert s
Advanced Supply Demand
Bernhard Schweigert
4.92 (311)
現在33%オフ 初心者にもエキスパートトレーダーにも最適なソリューション このインジケーターは独自の機能と新しい公式を多数内蔵しており、ユニークで高品質かつ手頃な取引ツールです。このアップデートでは、2つの時間枠ゾーンを表示できるようになります。より長いTFだけでなく、チャートTFとより長いTF(ネストゾーンを表示)の両方を表示できます。すべてのSupply Demandトレーダーの皆さんのお気に召すはずです。:) 重要情報の公開 Advanced Supply Demandの可能性を最大化するには、 https://www.mql5.com/ja/blogs/post/720245 にアクセスしてください。   エントリーまたはターゲットの正確なトリガーポイントを正確に特定できれば取引がどのように改善されるか想像してみてください。新しい基盤となるアルゴリズムに基づいて構築されているため、買い手と売り手の間の潜在的な不均衡をさらに簡単に特定できます。これは、最も強い需要と供給のゾーンと、過去のパフォーマンス(古いゾーンを表示)がグラフィカルに表現されるためです。これらの機能は、最適
TPSpro TRENDPRO  - is a trend indicator that automatically analyzes the market and provides information about the trend and each of its changes, as well as giving signals for entering trades without redrawing! The indicator uses each candle, analyzing them separately. referring to different impulses - up or down impulse. Exact entry points into transactions for currencies, crypto, metals, stocks, indices!  -  Version MT5               DETAILED DESCRIPTION                R ecommended to use with
まず第一に、この取引インジケーターは再描画されず、再描画されず、遅延しないことを強調する価値があります。これにより、手動取引とロボット取引の両方に理想的なものになります。 ユーザーマニュアル:設定、入力、戦略。 アトミックアナリストは、価格の強さとモメンタムを利用して市場でより良いエッジを見つけるためのPA価格アクションインジケーターです。ノイズや誤ったシグナルを除去し、取引ポテンシャルを高めるための高度なフィルターを備えています。複雑なインジケーターの複数のレイヤーを使用して、アトミックアナリストはチャートをスキャンし、複雑な数学的計算をシンプルなシグナルと色に変換します。これにより、どのような初心者トレーダーでも理解して使用し、一貫した取引の決定を行うことができます。 「アトミックアナリスト」は、新規および経験豊富なトレーダー向けにカスタマイズされた包括的な取引ソリューションです。プレミアムインジケーターとトップノッチの機能を1つの取引戦略に組み合わせ、すべてのタイプのトレーダーにとって汎用性のある選択肢にします。 デイリートレーディングとスキャルピング戦略:高
カスタムMT4インジケーターで外国為替取引を成功させるための秘密を発見してください! 外国為替市場で成功を達成し、リスクを最小限に抑えながら一貫して利益を得る方法を疑問に思ったことはありますか? これがあなたが探している答えです! 取引へのアプローチに革命をもたらす独自のMT4インジケーターを導入できるようにします。 ユニークな汎用性 私たちのインジケータは、RenkoとRangeBarのろうそくのフォーメーションを好むユーザー向けに特別に設計されています。 これらのチャートタイプは多くの経験豊富なトレーダーに好まれていることを理解しています。そのため、私たちのインジケーターはそれらとシームレスに統合され、比類のない市場分析を提供します。 クリアトレンドシグナル 複雑な分析を忘れてください! 私たちのインジケーターは、鮮やかな色と明確なドット構造を利用して、市場の動向を明確に示しています。 赤と青の点は、価格の動きの方向性について疑いの余地がなく、取引の迅速な意思決定を可能にします。 HH/HL HL/LL戦略とのアライメント HH/HLおよびHL/LL構
Gold Stuff
Vasiliy Strukov
4.89 (255)
Gold Stuff は、金専用に設計されたトレンド指標であり、あらゆる金融商品にも使用できます。 インジケーターは再描画せず、遅れません。 推奨時間枠 H1. それインディケータでフルオートExpert Advisor EA Gold Stuffが動作します。 あなたは私のプロフィールでそれを見つけることができます. 設定と個人的なボーナスを得るために、購入後すぐに私に連絡してください!   設定 矢印を描く - オンオフ。 チャートに矢印を描く。 アラート - 可聴アラートのオンオフ。 メール通知 - オンオフ。 電子メール通知。 プチ通知 - オンオフ。 プッシュ通知。 次に、色域を調整します。 Gold Stuff は、金専用に設計されたトレンド指標であり、あらゆる金融商品にも使用できます。 インジケーターは再描画せず、遅れません。 推奨時間枠 H1. それインディケータでフルオートExpert Advisor EA Gold Stuffが動作します。 あなたは私のプロフィールでそれを見つけることができます. 設定と個人的なボーナスを得るために、購入後
まず第一に、この取引ツールはノンリペイント、ノンリドロー、ノンラグの指標であり、プロの取引に理想的ですことを強調する価値があります。 オンラインコース、ユーザーマニュアル、デモ。 スマートプライスアクションコンセプトインジケーターは、新米から経験豊富なトレーダーまで、非常 に強力なツールです。Inner Circle Trader AnalysisやSmart Money Concepts Trading Strategiesなど、20以上の有用な指標を1つに組み合わせています。このインジケーターはスマートマネーコンセプトに焦点を当て、大手機関の取引方法を提供し、彼らの動きを予測するのに役立ちます。 特に、流動性分析に優れており、機関がどのように取引しているかを理解しやすくしています。市場のトレンドを予測し、価格の動きを慎重に分析するのに優れています。機関の戦略とトレードを合わせることで、市場の動向についてより正確な予測ができます。このインジケーターは多目的であり、市場構造を分析し、重要な注文ブロックを特定し、さまざまなパターンを認識するのに優れています。 このインジケー
TrendMaestro
Stefano Frisetti
5 (2)
note: this indicator is for METATRADER4, if you want the version for METATRADER5 this is the link:  https://www.mql5.com/it/market/product/108106 TRENDMAESTRO ver 2.4 TRENDMAESTRO recognizes a new TREND in the bud, he never makes mistakes. The certainty of identifying a new TREND is priceless. DESCRIPTION TRENDMAESTRO identifies a new TREND in the bud, this indicator examines the volatility, volumes and momentum to identify the moment in which there is an explosion of one or more of these data a
ブレーカートレーダーになり、価格が反転すると市場構造からの利益が変化します。 注文ブロックブレーカーインジケーターは、トレンドまたは価格の動きが枯渇に近づいており、逆転の準備ができていることを識別します。通常、反転または大規模なプルバックが発生しようとしているときに発生する市場構造の変化について警告します。 この指標は、ブレイクアウトと価格の勢いを識別する独自の計算を使用します。使い果たされる可能性のあるポイントの近くで新しい高値が形成されるたびに、インディケーターはその高値の作成を担当する最後の注文ブロックを描きます。次に、移動する価格とともに注文ブロックを追跡します。その後、価格が反対方向にシフトし、その注文ブロックを突破すると、新しい市場構造を作成し、トレンドまたは大きな後退の可能性のある反転の開始を警告します。 注文ブロックは、高値/安値が作成される前の最後の反対色のろうそくであり、価格がこれらの重要な領域を下抜けすると、トレンドの短期的ま​​たは長期的な反転の兆候です。 特徴 重要な枯渇点での市場構造の変化を警告します 価格が使い果たされるレベルに近づくと、
Trend Screener
STE S.S.COMPANY
4.83 (88)
トレンドインジケーター、1つのツールに組み込まれたすべての重要なトレンド機能を備えたトレンドトレーディングとフィルタリングのための画期的なユニークなソリューション! これは、すべてのシンボル/商品(外国為替、商品、暗号通貨、インデックス、株式)で使用できる100%再描画されていないマルチタイムフレームおよびマルチ通貨インジケーターです。 トレンドスクリーナーは、チャート内のドットで矢印トレンドシグナルを提供するインジケーターに続く効率的なインジケーターです。 トレンド分析インジケーターで使用できる機能: 1.トレンドスキャナー。 2.最大利益分析を備えたトレンドライン。 3.トレンド通貨強度メーター。 4.アラート付きのトレンド反転ドット。 5.アラート付きの強いトレンドドット。 6.トレンド矢印 毎日の分析例、毎日のシグナルパフォーマンス...など、トレンドスクリーナーインジケーターを使用して、ここで見つけることができます: ここをクリックしてください 期間限定オファー:トレンドスクリーナーインジケーターは、50ドルと生涯でのみご利用いただけます。 (元の価格125 $) MQ
現在20%OFF! 初心者やエキスパートトレーダーのためのベストソリューション! このダッシュボードソフトウェアは、28の通貨ペアで動作しています。それは私達の主要な指標(高度な通貨の強さ28と高度な通貨インパルス)の2に基づいています。それは全体の外国為替市場の大きい概観を与えます。それは、すべての(9)時間枠で28の外国為替ペアのための高度な通貨の強さの値、通貨の動きの速度と信号を示しています。チャート上で1つのインディケータを使用して市場全体を観察し、トレンドやスキャルピングの機会をピンポイントで見つけることができたら、あなたのトレードがどのように改善されるか想像してみてください。 このインディケータには、強い通貨と弱い通貨の識別、潜在的な取引の識別と確認がより簡単になるような機能が搭載されています。このインディケータは、通貨の強さや弱さが増加しているか減少しているか、また、すべての時間枠でどのように機能しているかをグラフィカルに表示します。 新機能として、現在の市場環境の変化に適応するダイナミックなマーケットフィボナッチレベルが追加され、すでに当社のAdvan
74% discount for the next 10 buyers (original price $605): 1 left Get a 50% bonus by buying (or even renting) any of our products. After buying (or renting), send a message for more information. 3 Indicators in 1 indicator Strategy based on price action Made specifically for the best forex currency pairs Can be used in the best time frame of the market at a very reasonable price This indicator is basically 3 different indicatos . But we have combined these 3 indicators in 1 indicator so th
ご紹介   クォンタム トレンド スナイパー インジケーターは 、トレンド反転を特定して取引する方法を変革する画期的な MQL5 インジケーターです。 13年以上の取引経験を持つ経験豊富なトレーダーのチームによって開発されました。     クォンタムトレンドスナイパーインジケーター   は、非常に高い精度でトレンドの反転を識別する革新的な方法で、あなたのトレーディングの旅を新たな高みに押し上げるように設計されています。 ***Quantum Trend Sniper Indicatorを購入すると、Quantum Breakout Indicatorを無料で入手できます!*** クォンタム ブレイクアウト インジケーターは、トレンドの反転を特定するとアラートを発し、矢印を示し、3 つのテイクプロフィットレベルを提案します。 初心者トレーダーにもプロのトレーダーにも適しています。 量子EAチャネル:       ここをクリック MT5のバージョン:       ここをクリック 推奨事項: 期間: すべての時間枠。最良の結果を得るには、
The indicator of a Professional Trader is an arrow indicator for predicting the direction of price movement. I have been working on this indicator since 2014. You can use this indicator as your main indicator, use its entry signals, and use it as your only indicator to find entry points. About the product: Recommended TF [H4-D1-W1]   . The indicator predicts the direction of the next candle. Fits a variety of tools; Flexibility in settings for different instruments and intervals through the
TrendDecoder Premium
Christophe Pa Trouillas
5 (4)
レンジと次の動きを特定    |  トレンドの最も早いシグナルと強さを得る   |  反転の前に明確な出口を得る   |  価格がテストするフィボ・レベルを見つける。 非リペイント、非遅延インディケータ - マニュアルおよび自動売買に最適 - すべての資産、すべての時間単位に対応 期間限定キャンペーン   >> 50%OFF 購入後、 推奨セッティングについては、このチャンネルで私に連絡してください。 MT5 バージョン: ここをクリック BladeSCALPER   と   PowerZONES   を使った完全な方法を入手する どのようなものですか? TrendDECODERは、トレンド監視をシンプルかつ簡単にするための複数のイノベーションを集約したものです。 Projective TrendLine (投影トレンドライン) - 今後のトレンドのスピードリファレンス。 RealTime TrendLine vs. Projective TrendLine (リアルタイムトレンドライン vs. Projective TrendLine) - 市場が同じ方
ご紹介     Quantum Breakout PRO は 、ブレイクアウト ゾーンの取引方法を変革する画期的な MQL5 インジケーターです。 13年以上の取引経験を持つ経験豊富なトレーダーのチームによって開発された Quantum Breakout PROは 、革新的でダイナミックなブレイクアウトゾーン戦略により、あなたの取引の旅を新たな高みに押し上げるように設計されています。 クォンタム ブレイクアウト インジケーターは、5 つの利益ターゲット ゾーンを備えたブレイクアウト ゾーン上のシグナル矢印と、ブレイクアウト ボックスに基づいたストップロスの提案を提供します。 初心者トレーダーにもプロのトレーダーにも適しています。 量子EAチャネル:       ここをクリック MT5バージョン:   ここをクリック 重要!購入後、インストールマニュアルを受け取るためにプライベートメッセージを送ってください。 推奨事項: 時間枠: M15 通貨ペア: GBPJPY、EURJPY、USDJPY、NZDUSD、XAUUSD アカウントの種類: ECN、Raw、また
FX Volume
Daniel Stein
4.6 (35)
mql5と Telegramの モーニング・ブリーフィングで、詳細とスクリーンショットを含む毎日のマーケット・アップデートをご覧 ください! FX Volumeは、ブローカーの視点から市場のセンチメントをリアルに洞察する、最初で唯一の出来高インジケーターです。 ブローカーのような機関投資家が外国為替市場でどのようなポジションをとっているか、COTレポートよりもはるかに速く、素晴らしい洞察を提供します。 この情報をチャート上で直接見ることは、あなたの取引にとって真のゲームチェンジャーであり、画期的なソリューションです。 以下のようなユニークなマーケットデータ洞察から利益を得てください。 比率は 、通貨のロングポジションとショートポジションの比率をパーセントで表示します。 比率の変化は 、選択した期間内のロング比率とその変化率を表示します。 Volumes Totalは 、通貨の取引量(ロングとショート)の合計をロット単位で表示します。 Volumes Long :全通貨のロングポジションの取引量を表示します。 Volumes(ショート )は、全通貨のショートポジションの取引量を表示
mql5と Telegramの モーニング・ブリーフィングで、詳細とスクリーンショットを含む毎日のマーケット・アップデートをご覧 ください! FX Power MT4 NGは 、長年の人気を誇る通貨強度計FX Powerの次世代モデルです。 この次世代ストレングスメーターは何を提供するのでしょうか?初代FXパワーの魅力すべて プラス GOLD/XAUの強さ分析 より正確な計算結果 個別に設定可能な分析期間 カスタマイズ可能な計算上限値により、さらに優れたパフォーマンスを実現 もっと見たい人のための特別なマルチインスタンス設定 すべてのチャートでお好みの色を無限に設定可能 数え切れないほどの通知オプションにより、重要なことを見逃すことはありません。 Windows 11とmacOSのスタイルで角を丸くした新しいデザイン 魔法のように動くインジケーターパネル FXパワーの主な機能 すべての主要通貨の強さの完全な履歴 すべての時間枠における通貨の強さの履歴 すべてのブローカーとチャートで同一の計算結果 100%信頼できるリアルタイム計算 -> リペイントなし ドロップダウン・リストから
このインジケータは、手動および自動的な方法でチャートに描かれたハーモニックパターンを検出します。ユーザーマニュアルは、このリンクから参照できます: あなたのレビューを追加し、入手するために私たちに連絡してください。 この製品をmt4で試すための無料版があります。 GartleyおよびNenstarパターンを検出するために使用できます。 https://www.mql5.com/en/market/product/30181 完全なMT4バージョンを購入するには、次の場所から購入できます。 https://www.mql5.com/en/market/product/15212 注 インジケータにはコントロールパネルがあり、すべての(チャート&時間枠)設定が保存されます。チャート上でスペースをより多く確保するために、最小化することができ、他の分析ツールで作業する場合は、すべてのインジケータデータを非表示にするために閉じるボタンを押すことができます。 このインジケータを使用して設定を変更し、移動平均やボリンジャーバンドなどのインジケータを追加すると、編集のテンプレートが自動的に保存され、必
ICT, SMC, SMART MONEY CONCEPTS, SMART MONEY, Smart Money Concept, Support and Resistance, Trend Analysis, Price Action, Market Structure, Order Blocks, BOS/CHoCH,   Breaker Blocks ,  Momentum Shift,   Supply&Demand Zone/Order Blocks , Strong Imbalance, HH/LL/HL/LH,    Fair Value Gap, FVG,  Premium  &   Discount   Zones, Fibonacci Retracement, OTE, Buy Side Liquidity, Sell Side Liquidity, BSL/SSL Taken, Equal Highs & Lows, MTF Dashboard, Multiple Time Frame, BigBar, HTF OB, HTF Market Structure, 
PRO Renko Systemは、特別にRENKOチャートを取引するために設計された高精度の取引システムです。 これは、様々な取引商品に適用することができる普遍的なシステムです。 システムは効果的に正確な逆転信号へのアクセスを与えるいわゆる市場の騒音を中和する。 表示器は非常に使いやすく、信号の生成に責任がある1つの変数だけがあります。 あなたは簡単にお好みの任意の取引ツールとレンコバーのサイズにツールを適応させることができます。 私はいつもあなたが私のソフトウェアで収益性の高い取引を支援するために余分なサポートを提供する準備ができています! 私はあなたに幸せで収益性の高い取引をしたいです! ご購入後にご連絡ください! 私はあなたに私のレンコチャートジェネレータを送信します。 私はまた、私の個人的な推奨事項やシステムの他のモジュールを無料で共有します!
Auto Order Block with break of structure based on ICT and Smart Money Concepts Futures Break of Structure ( BoS )             Order block ( OB )            Higher time frame Order block / Point of Interest ( POI )    shown on current chart           Fair value Gap ( FVG ) / Imbalance   ,  MTF      ( Multi Time Frame )    Volume Imbalance     ,  MTF          vIMB Gap’s Equal High / Low’s     ,  MTF             EQH / EQL Liquidity               Current Day High / Low           HOD /
Legacy of Gann
Pavel Zamoshnikov
4.83 (12)
The indicator very accurately determines the levels of the possible end of the trend and profit fixing. The method of determining levels is based on the ideas of W.D.Gann, using an algorithm developed by his follower Kirill Borovsky. Extremely high reliability of reaching levels (according to K. Borovsky  - 80-90%) Indispensable for any trading strategy – every trader needs to determine the exit point from the market! Precisely determines targets on any timeframes and any instruments (forex, met
BUY INDICATOR AND GET EA FOR FREE AS A BONUS + SOME OTHER GIFTS! ITALO LEVELS INDICATOR  is the best levels indicator ever created, and why is that? Using high volume zones on the market and Fibonacci the Indicator works on all time-frames and assets, indicator built after 7 years of experience on forex and many other markets. You know many levels indicators around the internet are not complete, does not help, and it's difficult to trade, but the   Italo Levels Indicator is different , the Ital
現在31%オフ! 初心者やエキスパートトレーダーに最適なソリューション! このインジケータは、独自の機能と秘密の数式を組み込んだ、ユニークで高品質かつ手頃な価格のトレーディングツールです。たった1枚のチャートで28の通貨ペアのアラートを表示します。新しいトレンドやスキャルピングチャンスの引き金となるポイントを正確に把握することができるので、あなたのトレードがどのように改善されるか想像してみてください! 新しい基本的なアルゴリズムに基づいて構築されているため、潜在的な取引の特定と確認がより簡単になります。これは、通貨の強さや弱さが加速しているかどうかをグラフィカルに表示し、その加速のスピードを測定するためです。加速すると物事は明らかに速く進みますが、これはFX市場でも同じです。つまり、反対方向に加速している通貨をペアにすれば、利益を生む可能性のある取引を特定することができるのです。 通貨の勢いを示す縦の線と矢印は、あなたの取引の指針となるでしょう。 ダイナミックマーケットフィボナッチ23レベルはアラートトリガーとして使用され、市場の動きに適応します。もしインパルスが黄色
このダッシュボードは、市場構造反転インジケーターで使用するためのアラートツールです。主な目的は、特定の時間枠での取消の機会と、インジケーターと同様にアラートの再テスト(確認)についてアラートを出すことです。ダッシュボードは、それ自体でチャート上に配置され、バックグラウンドで動作して、選択したペアと時間枠でアラートを送信するように設計されています。多くの人々が1つのMT4の複数のチャートで市場反転インジケーターを実行するのではなく、一度に複数のペアと時間枠を監視するためにダッシュを要求した後に開発されました。 M5、M15、M30、H1、H4、およびD1の時間枠でアラートを出します。もちろん、取引の場合と同様に、より高い時間枠が最も効果的です。 このダッシュボードは、市場構造反転インジケーターのアドオンとして設計されています。それは独立して機能し、マーケットリバーサルアラートインジケーターによって与えられたパターンと信号にアラートを出します。 ここでマーケットリバーサルアラートインジケーターを取得します:https:// www.mql5.com/en/market/produ
作者のその他のプロダクト
The MACD (Moving Average Convergence Divergence) indicator is one of the most widely used technical analysis tools by traders worldwide. Created by Gerald Appel in the 1970s, the MACD is an indicator that helps investors identify the trend direction, trend strength, and possible trend reversal points. The MACD indicator is composed of a histogram that shows the difference between the 12-period exponential moving average and the 26-period exponential moving average. The top part of the histogram
FREE
Qv² OBOS is an indicator that aims to identify overbought and oversold regions considering price standard deviation and volume analysis. Oversold signals are indicated by arrows pointing upwards. Overbought signals are indicated by arrows pointing downwards. Can be used in all timeframes. Can be used on all pairs. I use in H1 Important note, the histogram is displayed to improve the trader's analysis. But the signs of overbought and oversold are the arrows as mentioned above. Important no
The Qv² Trend is an indicator that aims to identify trends. Buying trend signals are indicated by arrows pointing up. Selling trend signals are indicated by arrows pointing down. It can be used in all deadlines. It can be used in all pairs. I use it on the H1 with a period of 24. Important note: I recommend using it in markets that naturally show trends. For in range markets I present my other indicator on this link OBOS  
QV2 MA is an indicator that displays the results of two smoothed moving averages applied to Candles. Item 01 - Buy signal: Candle show color Aqua when the 4-period smoothed moving average is expanding and above the 24-period smoothed moving average. Item 02 - Sell Signal: Candle show color HotPink color when a 4-period smoothed moving average is expanding and below the 24-period smoothed moving average. Item 03 - The gray candle is an undefined region. When the candle is gray, there are two re
Qv² Stdev is indicator developed based on standard deviation of prices and trading volume. Buy signals are indicated by arrows up. Sell signals are indicated by arrows down. An important detail is that the Qv² Volume has two bands, an upper and a lower, both of which serve as a target for take profit. It is recommended to use it in H1 Can be used in all pairs (I use in Gold). Good Business, in the trending market To find out some more about my work please click here
The Qv² Halifax - Indicator developed through a complex series of calculations, which aims to easily identify buylng and selling signals. Buy signal are indicated by up arrows. Sell signal are indicated by down arrows. An important detail: In order to make the indicator work, the timeframes M1, M5. M15. M30, H1 D1 must be all updated. It can be used on all pairs (I use it on Gold). it is a very good deal in the trending market To learn more about my work click here
The Qv² Histogram - Indicator developed for traders with advanced experience. This indicator has two purposes: 1-) Identify price normality patterns (green color) 2-) Identify abnormal price patterns “outliers” (red color) ====================================================================================================================================== Interpretation for trades in start trend: Histogram (Green color) crossing the zero line upside - uptrend. Histogram (Green color) crossing th
The Qv² Trend is an indicator that aims to identify trends. Buying trend signals are indicated by arrows pointing up. Selling trend signals are indicated by arrows pointing down. It can be used in all deadlines. It can be used in all pairs. I use it on the H1 with a period of 24. Important Recommendation: Make sure you trade in trend market. Good Trades, in trend market
フィルタ:
trick 86
374
trick 86 2023.04.06 00:44 
 

awesome version thanks

レビューに返信