Pinpoint Pro MT5
- インディケータ
- Habibu Asini Shabani
- バージョン: 3.0
- アップデート済み: 27 4月 2023
- アクティベーション: 5
Pinpoint Pro Indicator is a multi-time frames indicator, which uses more than five built-in MT5 indicator to generate trading signals. This indicator can perform several functions, such as:
- Send signals notification to mobile phone
- Gives precise signal entry upon following signal checklist points
- Can be used in all market such as currency pairs, stock market, metals, commodity, synthetic pairs and cryptocurrency pairs
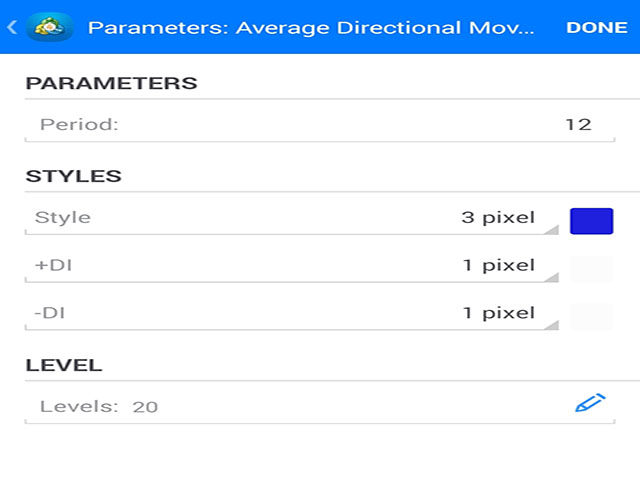
One built-in indicator can be used for signal verification before entering the market; (See screenshot for settings details)
- Average Directional Movement Index (ADX) with the following settings; (Period:12, Levels: 20, Style set 4pixel Blue color, DI+&DI- set them white color, 1pixel)
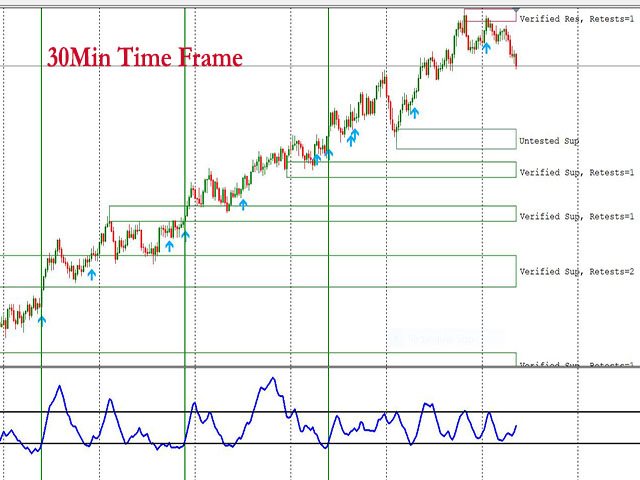
Note: Pinpoint Pro Indicator should be applied on 30Min time frames.
Signal verification points
BUY SIGNAL
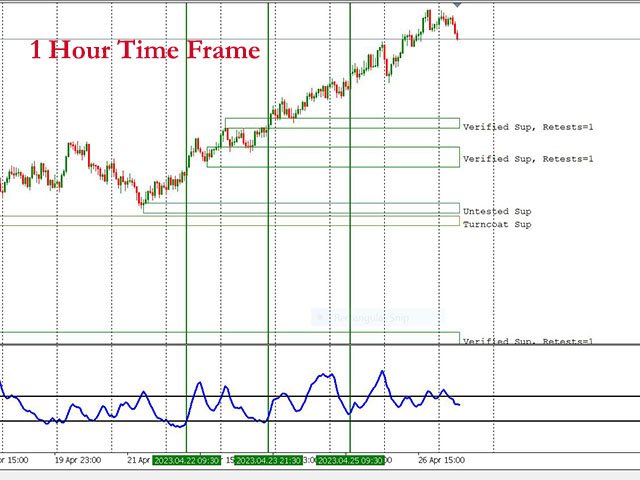
- When ADX is above 20 Level and pointing upwards on both 30min and 1Hour time frames
SELL SIGNAL
- When ADX is above 20 Level and pointing upwards on both 30min and 1Hour time frames
You are advised to set the indicator on a VPS (Online computer) to receive signals even your local PC is shutdown.
Kindly download free Resistance and Support indicators on telegram group below for MT4&5 which will help to see and avoid certain levels which are verified and sometimes those verified levels acts as reversal levels.
Take Note: Do not open BUY order at verified resistance, wait for true breakout of that level and
Do not open SELL order at verified support, wait for true breakout of that level
For support Services:
E-mail: eng.habibu@outlook.com
Telegram Group: https://t.me/FxPinpoint