• 概要
  • レビュー (1)
  • コメント (5)
  • 最新情報

Laguerre Scrat

5

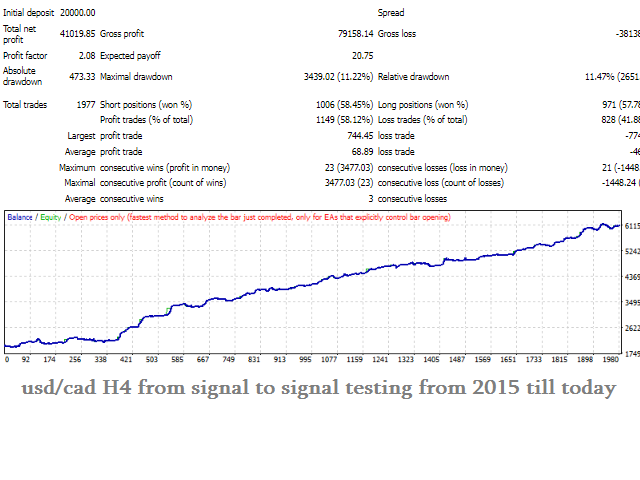
In case you get Laguerre Scrat indicator, you will get Laguerre Scrat Ea as a Gift. To get Ea and detailed manual PDF contact me PM. Default settings are for usd/cad H4

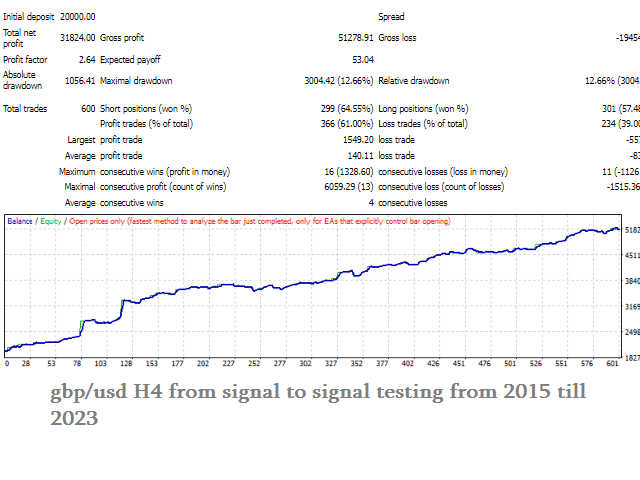
For Stable Long term Profits

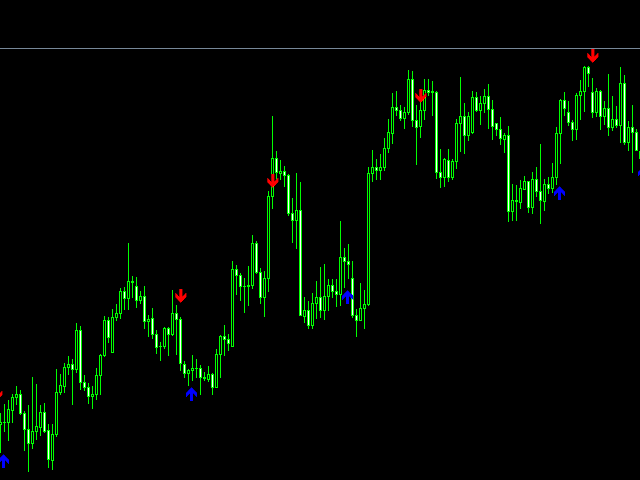
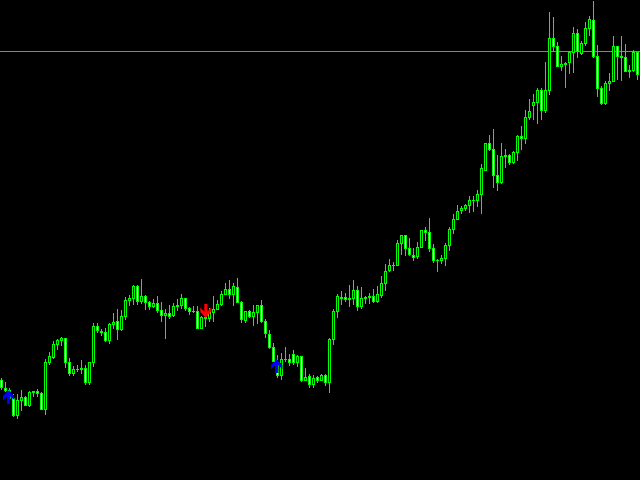
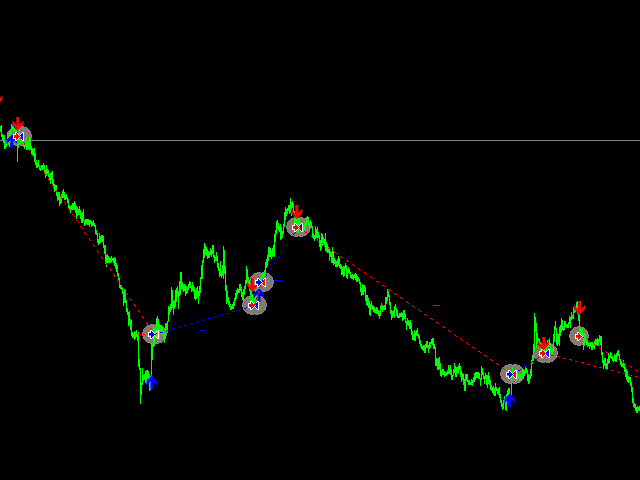
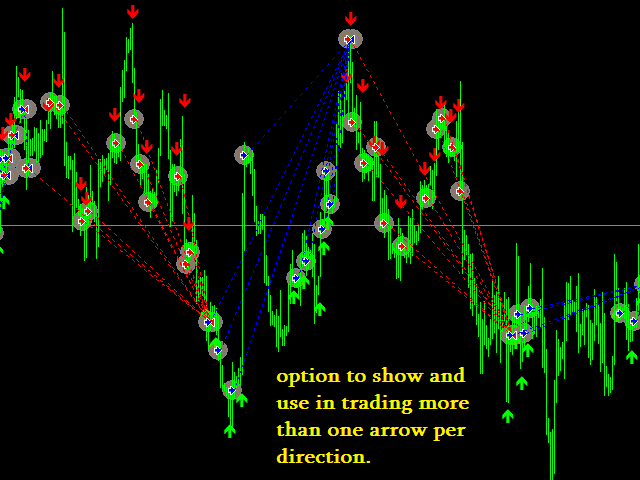
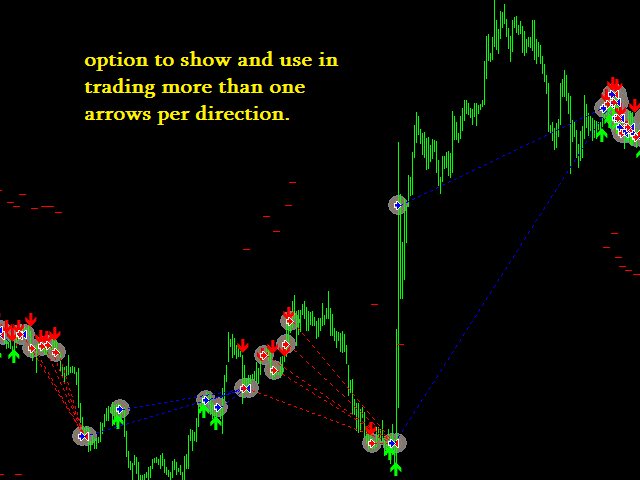
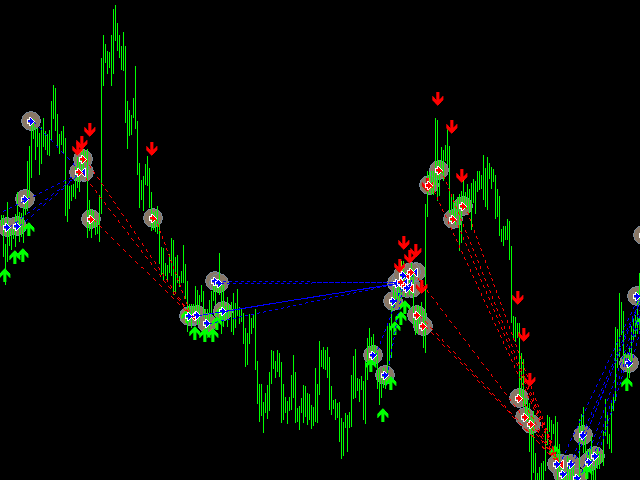
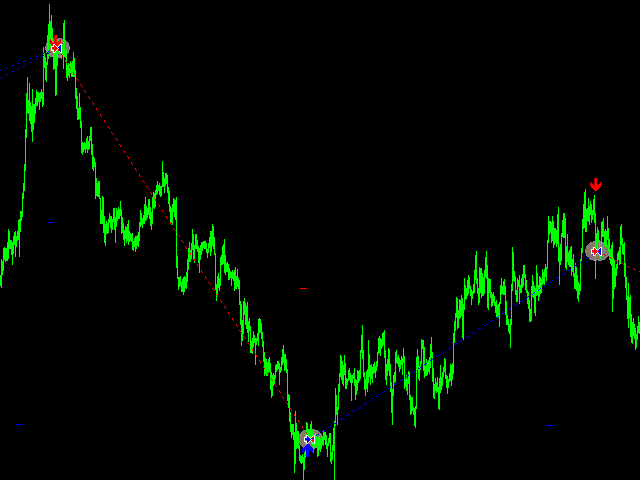
Laguerre Scrat is a trading system based on 4 indicator combinations in the shape of one indicator. Laguerre indicator (upgraded), CCI, Bollinger bands and market volatility factor. It generates arrows in the indicator window and nuts on the price chart, doubling arrows for a better view where to buy/sell.  (It is possible to hide nuts from inputs).

First was upgraded Laguerre to have an automatically changeable dynamic period with help of CCI and made it possible to generate arrows on cross of few levels, after that some conditions were added with use of volatility factor and Bollinger bands factor. As a result we have a very profitable system for a very long period of history in the shape of one indicator with an easy interface and very flexible functionality! 

Default settings are for all instruments just to see shape. All current profitable set files are uploaded in comments section.

Laguerre Scrat input parameters:
gurGamma – period of Laguerre
gurGammaAdd – period step to add to gurGamma (according cci level)
gurSellProof – level of laguerre to cross from down to up for proof of drawing sell arrow.
gurSellCross – level of laguere to cross from up to down after proof to draw a sell  arrow.
gurBuyCross – level of laguerre to cross from down to up after proof to draw a  buy arrow.
gurBuyProof – level of laguerre  to cross from up to down for proof to draw a  buy arrow.
GurSigShift – on what distance from candle to draw arrow.

Volatile – Higher/Lower/not use level of Volatility higher or lower to use for proof of arrow.
VolTF -timeframe of Volatile indicator to use for determining Volatility.
VolPeriod – period of Volatility indicator
volLevel – level of Volatile indicator to higher or lower of what level to use in trading for arrow proof.

Use CCI -true/false use cci or not to grant dynamism to Laguerre Period (gurGamma + gurGammaAdd)
cciTF – what timeframe use cci on.
cciPeriod – what period of CCI to use.
cciPrice – what type of cci use (open price, close price, weighted price etc)
cciLevel – what level of cci to use. 75.0 means range 75 (-75) above 75 below -75. (That’s example)

UseBB – true/false for sell arrow confirmation price should be lower in the up line of bollinger bands. For Buy arrow confirmation price should be higher on the lower line of Bollinger bands.
bbTF – timeframe of bollinger bands to use.
bbPeriod – period of bollinger bands to use.
bbDeviat – deviation of Bollinger bands to use.
bbPrice – what type of Bollinger bands to use (close price, open price etc)

alertsOn – true/false use alerts or no.


レビュー 1
Epsilon Hogas
1468
Epsilon Hogas 2023.04.09 18:05 
 

I use it to assist my entries in combination with differnet TI so far, author is honest and helpful

おすすめのプロダクト
The Free  Pin Bar MT4  indicator  identifies Pin Bars  It will even give you sound or email alerts if want them. If you download it and like it please leave a review! It would be wonderful Pin Bars are purely based on price action as reflected by the candle formations created by Forex price movements. input Parameters are maximum allowed body/length ratio for the Nose bar. Nose body should be position in top (bottom for bearish pattern) part of the Nose bar.  tells the indicator that the Left E
FREE
This indicator calculates and draws lines over the chart. There are two types of trends: Trend A: the line is drawn using local lows for uptrends and local highs for downtrends Trend B: the line is drawn using local highs for uptrends and local lows for downtrends There are a few conditions, which have to be fulfilled and can be changed by the parameters (see also picture 4): MinBarAge : the count of bars to the last base point of a line is called BarAge and has to be greater than the parameter
FREE
RSI divergence indicator is a multi-timeframe and multi-symbol indicator that help us find divergences between price chart and RSI indicator. Always use the divergence indicators with other technical assets like support resistance zones, candlestick patterns and price action to have a higher possibility to find trend reversals. This indicator will identify the peaks and troughs of both price and the RSI indicator. You can adjust the parameters to adjust the strength and weakness of these peaks a
FREE
Time Range Separator is a useful tool to display a separator period on your platform. You could go in the properties of the indicator, select the desired range and that's ALL. We believe it is a useful and necessary that we wish to share with you for free all our followers. Input Values: TimeFrame Period Separator GMT_Hour (ex. +1 or -1) to move the lines at Period Time +/- tot hours in input Hide_dates to show or hide the datetime on vertical lines VLine_Color = Vertical Color Line VLine_Styl
FREE
Pivot Mean Oscillator (PMO) is a unbounded zero-centered oscillator that provides a quick and normalized measure of divergence between two spreads. Detailed description of the mathematical formulation along with some comments and experiments can be found in this article .  Trading aspects This version of PMO is tuned on spreads relative to Close and Open price signals against their cumulative moving average (CMA). Positive PMO(m,n) values means that last (normalized) m Close prices are higher
FREE
Not trading time
Mikhail Nazarenko
3.75 (4)
There are time periods in the market, when trading is highly likely to be unprofitable. This indicator warns you about such non-trading situations and helps you preserve your money and time. Parameters Remind about non-trading periods: Expiration week - remind about the expiration week Consumer index day - remind a day before the release of Consumer index day NON FARM - remind a day before the release of NON FARM Christmas - remind a day before Christmas New Year Days 25.12 - 15.01 - remind ab
FREE
This indicator is one of the useful tools for traders who trade on currency pairs and based on the strength of each currency they can make a correct decision or confirmation in the positions.  It has been calculated for all the minor currency pairs supported by the broker and displays the values of the major currencies. These currencies are displayed horizontally or vertically according to the trader's config when executing the indicator. One of the trading strategies that can be used is to cho
FREE
Account Dashboard Statistics MT4
Nestor Alejandro Chiariello
4.75 (8)
アカウントダッシュボードの統計 これは、アカウントの損益を把握するために集中的に表示するのに役立つツールであり、それを追跡することができ、また、得られるリスクを知るためのドローダウン分析も提供します。 アカウントにダウンロードしてアクティブ化した後、EURUSD H1 などの任意のシンボルに添付する必要があります。その後、この瞬間からツールが統計の監視を開始します。 パネルは完全に高度になっており、非表示にしたり、好きな場所に移動したりできます アカウント操作に基づく主な特徴は次のとおりです 毎日の期間(毎日の利益と損失は毎日更新されます) 毎週の期間 (毎週更新される週ごとの利益と損失) 毎月の期間(毎月の損益は毎月更新) 年間期間 (年間の損益は毎年更新) 最大ドローダウン(残高に基づいて最大リスクに達するのを毎秒監視して制御) たとえば、残高が 1000 米ドルで、引き出しが 10% をマークしている場合、ある時点でアカウントの合計リスクが 100 米ドルに達したことを意味します。
FREE
MQLTA Support Resistance Lines is an indicator that calculates the historical levels of Support and Resistance and display them as Lines on chart. It will also Alert you if the price is in a Safe or Dangerous zone to trade and show you the distance to the next level. The indicator is ideal to be used in other Expert Advisor through the iCustom function. This indicator can be tested LIVE on AUDNZD with the following DEMO https://www.mql5.com/en/market/product/26572 How does it work? The indicat
FREE
ピボットポイントフィボRSJは、フィボナッチレートを使用してその日のサポートラインとレジスタンスラインを追跡するインジケーターです。 この壮大な指標は、フィボナッチレートを使用してピボットポイントを通じて最大7レベルのサポートとレジスタンスを作成します。 価格がこのサポートとレジスタンスの各レベルを尊重する方法は素晴らしいです。そこでは、オペレーションの可能な入口/出口ポイントを認識することができます。 特徴 最大7レベルのサポートと7レベルの抵抗 レベルの色を個別に設定します 入力 ピボットタイプ ピボットフィボRSJ1 =フィボ比1の計算 ピボットフィボRSJ2 =フィボ比2の計算 ピボットフィボRSJ3 =フィボ比3の計算 ピボットフィボクラシック=クラシックピボット計算 最小ピボットレベル ピボット3レベル ピボット4レベル ピボット5レベル ピボット6レベル ピボット7レベル それでも質問がある場合は、ダイレクトメッセージで私に連絡してください: https://www.mql5.com/ja/users/robsjunqueira/
FREE
A tool for backtesting my ATR Trailing Stoploss Helper ( https://www.mql5.com/en/market/product/34103 ) Added on-screen buttons for manual backtesting: - Clicking on button SET, then click on a candle where you want to see how this indicator would draw the ATR trailing stop for that exact time. Parameter: DRAW_ATR_TRAILING_STOP_LEVEL_TIMEFRAME = PERIOD_H4; //timeframe to calculate the value of ATR DRAW_ATR_TRAILING_STOP_LEVEL_PERIOD = 10; //period of the ATR DRAW_ATR_TRAILING_STOP_LEVEL_MULTIPL
FREE
TP1 TP2 TP3 panel free
Denis Paul Richard Remanjon
4.6 (5)
TP1 TP2 TP3 panel free is a simple tool designed for manual trading. It helps you to follow free or paid forex signals with multiple take profit (TP1 TP2 TP3). Fill the fields (volume, SL, TP1, TP2, TP3) in pips or price, press the ‘Sell’ or ‘Buy’ buttons and the program opens 1 to 3 identical orders. It also adds TP1 and TP2 lines on chart. The program alerts you when TP1 and TP2 are reached or if stop lost and TP3 are almost reached so you can close your orders and move stop losses according t
FREE
Add indicator "Symbol Name Drawer " on chart. Indicator creates text object with name of current symbol. You can change symbols on chart and indicator automatically changes text. Free to use. Simple tool. If you have any suggestion you can write me about it in comments. I try to improve this tool in future versions. Thanks for using my indicator. If you want to order something special in mql4 or mql5 message.
FREE
価格波形パターン MT4へようこそ --(ABCD パターン)--     ABCD パターンは、テクニカル分析の世界で強力で広く使用されている取引パターンです。 これは、トレーダーが市場での潜在的な売買機会を特定するために使用する調和的な価格パターンです。 ABCD パターンを使用すると、トレーダーは潜在的な価格変動を予測し、いつ取引を開始および終了するかについて十分な情報に基づいた決定を下すことができます。 EA バージョン :   Price Wave EA MT4 MT5バージョン: Price Wave Pattern  MT5 特徴 :  ABCDパターンの自動検出。 強気パターンと弱気パターン。  任意のシンボルと任意の時間枠で機能します。 主要なレベルと価格目標。 カスタマイズ可能な設定と繊維レベルの調整。 アラートと通知。 今後さらに多くの機能が追加される予定です。 
FREE
RoundNumber
Mohamad Zulhairi Baba
4.25 (4)
RoundNumbers indicator is a simple and powerful psychological price levels. Trader usually use these levels as a Support and Resistance (SnR). Indicator Input: Levels - Numbers of levels drawn on chart. Default 30 levels. BoxSize - Box size drawn on each levels, indicate buffers around levels. Default value 1pips (10point) above and below each levels. ZoneSize - Distance between each levels, default value 10pips (100point). Style & Colours - User inputs customization. For MT5 version, please r
FREE
The indicator is a complex of MACD and OsMA, built according to the complex of several popular oscillators. This combination allows you to get the best out of both types of indicators. On the one hand, a quick response to changes in the market environment, on the other hand, effective market following and noise filtering. The indicator values ​​on a fully formed candle are not redrawn.
FREE
RTL Map AM
Andriy Matviyevs'kyy
RTL Map (Reference Trend Line Map) - the indicator is based on a complex of digital technical indicators described in the article by Vladimir Kravchuk: " Digital indicators in the technical analysis of financial markets ". The indicator displays buy/sell signals on the price chart for such digital indicators of technical analysis as FTLM and STLM, as well as directly the lines of digital filters RSTL, SATL, RFTL, FATL. Signals are displayed on fully formed bars and are not redrawn. It is recomme
FREE
Sm Ichimoku Scanner
Steeve Christian Martol
5 (6)
Multi Time Frame Indicator acts as a Scanner based on the Ichimoku Trading System. The outcome is displayed on a board. This helps you to make "at a glance" a mental picture of the System without having to open the chart. Up to 10 Currencies can be watched. Scanned elements And Legend "KUMO Futur" - Green : The Kumo Futur is Bullish. "KUMO Futur" - Red : The Kumo Futur is Bearish. "PRICE Cross KJ" - Green : The Price is Above the Kijun Sen.  "PRICE Cross KJ" - Red : The Price is Below the Kijun
FREE
ハーモニックパターンは市場の転換点を予測するのに最適です。これらのパターンは高い勝率と1日の中での多くの取引機会を提供します。当社のインジケーターは、ハーモニックトレーディングの原則に基づいて、市場反転ポイントを予測する最も一般的なハーモニックパターンを特定します。 重要な注意事項: インジケーターは再描画されず、遅れることはありません(パターンはDポイントで検出されます);再描画されることはありません(パターンは有効またはキャンセルされます)。 使用方法: インジケーターをMT5チャートにドラッグアンドドロップします。 パターン検出をTRUE(ABCD;Gartley)に設定します。 任意のデバイスを設定します(高いデバイス=より多くのパターン;低いデバイス=より少ないパターン)。 好みに合わせて色を調整します。 バルブ/エントリーポイント、TP、SLの警告を有効または無効にします。 パターンが検出された場合: アルゴリズムはDポイントでパターンを検出します。 警告が有効になっている場合、パターン検出を通知します。 パターンが無効になった場合、「パターンがキャンセルされました」という
FREE
This scanner shows the trend values of the well known indicator SuperTrend for up to 30 instruments and 8 time frames. You can get alerts via MT4, Email and Push-Notification as soon as the direction of the trend changes. This is the FREE version of the indicator: SuperTrend Scanner The free version works only on EURUSD and GBPUSD! Important Information How you can maximize the potential of the scanner, please read here: www.mql5.com/en/blogs/post/718074 With the following FREE indicator you
FREE
Introducing the Consecutive Green/Red Candle Alert Indicator for MT4 - Your Trend Spotting Companion! Are you ready to take your trading to the next level? We present the Consecutive Green/Red Candle Alert Indicator, a powerful tool designed to help you spot trends and potential reversals with ease. Whether you're a new trader looking for clarity in the market or an experienced pro seeking additional confirmation, this indicator is your trusted companion. Key Features of the Consecutive Green/Re
FREE
Marginhedged   情報インジケーター。 ロット-計算に必要なロットを設定し、入力フィールドを使用して設定します MARGININIT-指定されたロットの初期証拠金要件 MARGINHEDGED-セットロットごとの重複注文から請求されるマージン PERCENT- 重複した注文に請求されるマージン(パーセンテージで表される) インジケーター設定の説明: _color-色を設定します インジケーターの使用例: ロット1の1つの買いポジションが市場で開かれています。この場合の証拠金要件は$ 10に対応します。 ロット1で売りポジションを開くと、必要な証拠金の合計は5ドルになります。 または50%。 インジケータは、特定のロットのこの情報を示します。
FREE
MQLTA Support Resistance Lines is an indicator that calculates the historical levels of Support and Resistance and display them as Lines on chart. It will also Alert you if the price is in a Safe or Dangerous zone to trade and show you the distance to the next level. The indicator is ideal to be used in other Expert Advisor through the iCustom function. This DEMO only works with AUDNZD, the full product can be found at https://www.mql5.com/en/market/product/26328 How does it work? The indicato
FREE
The MAtrio indicator displays three moving averages on any timeframe at once with a period of 50-day, 100-day, 200-day. After attaching to the chart, it immediately displays three moving averages with the parameters of simple (SMA) moving average SmoothingType50 , simple (SMA) moving average SmoothingType100 , simple (SMA) moving average SmoothingType200 . Accordingly, with the price type ValuePrices50, ValuePrices100, ValuePrices200 , by default, the price is Close price everywhere. All parame
FREE
このプロジェクトが好きなら、5つ星レビューを残してください。 インスタグラムでフォロー:borelatech このインジケータは、指定されたためのオープン、ハイ、ロー、クローズ価格を描画します 特定のタイムゾーンの期間と調整が可能です。 これらは、多くの機関や専門家によって見られた重要なレベルです トレーダーは、彼らがより多くのかもしれない場所を知るために有用であり、 アクティブ。 利用可能な期間は次のとおりです。 前の日。 前週。 前の月。 前の四半期。 前年。 または: 現在の日。 現在の週。 現在の月。 現在の四半期。 現年。
FREE
LT Automated Support Resistance Screener is a level indicator or a support resistance indicator that can be used to determine the level of support and resistance values. This indicator is free and easy to used in the Metatrader 4 platform which is built using the MQL4 programming language. Support resistance indicator is an important indicator that is often to used, but it is not available on the MT4 platform. This indicator can be used for all markets like forex, indices, gold etc and all time
FREE
UPD1 D Levels
Vitaliy Kuznetsov
5 (1)
Levels インジケータは、前日のデータに基づいています。 数式がエントリーレベルとエグジットレベルを決定します。 取引推奨。 Levelsは、ボラティリティが出現する欧州セッションの開始時に取引する。 ボラティリティが十分でない場合は、利食いの半分でエグジットする。 利益が半分の水準で価格が反転した場合、反転時に利益が半分の水準でターゲットを探します。 価格がエントリーレベルから跳ね返された場合、反対方向に価格が2番目のテイクプロフィットに到達する可能性があります。 常にブレイクアウトでエントリーするべきではありません。再テストを待つことをお勧めします。 再テストは、市場に複数の最小出来高レベルがある場合に有効です。UPD1 Profile Levelsインディケータを参照。 入力パラメータ 。 Start Hour - 1日の始まりの時間から。 00-デフォルト   。 Visual Button - ボタン表示(有効/無効)   。 Corner - ボタンアンカー角度   。 X indent - ピクセル単位の水平パディング   。 Y indent 
FREE
This scanner shows the trend values of the well known indicator Parabolic SAR for up to 30 instruments and 8 time frames. You can get alerts via MT4, Email and Push-Notification as soon as the direction of the trend changes. This is the FREE version of the indicator: Advanced Parabolic SAR Scanner The free version works only on EURUSD and GBPUSD! Important Information How you can maximize the potential of the scanner, please read here: www.mql5.com/en/blogs/post/718074 You have many possibil
FREE
Wicks UpDown Target GJ Wicks UpDown Target GJ is specialized in GJ forex pairs. Choppy movement up and down on the opening range every day.  Trading breakouts on London session and New York session is recommended. Guideline Entry Strategy Idea: Step 1 - Breakout Forming (Warning! Trade on London Session and New York Session) Step 2 - Breakout Starting (Take Action on your trading plan) Step 3 - Partial Close your order & set breakeven (no-risk) Step 4 - Target complete Step 5 - Don't tr
FREE
The indicator displays price distribution on a horizontal histogram. Horizontal histogram help find out key levels of price so that you can make good decision on setting point of take profit, stop loss... You can improve exist trading strategy or get new trading idea with the histogram of price. Outstanding features Support multiple time frame : you can choose to work with history data in any time frame you want. It does not depend on current display time frame. Support weighting by volume a
FREE
このプロダクトを購入した人は以下も購入しています
Gann Made Easy は、ミスター・ギャンの理論を使用した取引の最良の原則に基づいた、プロフェッショナルで使いやすい外国為替取引システムです。 W・D・ガン。このインジケーターは、ストップロスとテイクプロフィットレベルを含む正確な買いと売りのシグナルを提供します。 PUSH通知を利用して外出先でも取引可能です。 購入後はご連絡ください!私の取引のヒントと素晴らしいボーナスインジケーターを無料で共有します! おそらく、ギャンの取引手法についてはすでに何度も聞いたことがあるでしょう。通常、ギャンの理論は初心者のトレーダーだけでなく、すでにある程度の取引経験がある人にとっても非常に複雑なものです。なぜなら、ギャンの取引手法は理論的にはそれほど簡単に適用できるものではないからです。私はその知識を磨き、最良の原則を私の外国為替インジケーターに組み込むために数年を費やしました。 このインジケーターは非常に簡単に適用できます。必要なのは、それをチャートに添付し、簡単な取引推奨事項に従うだけです。このインジケーターは常に市場分析の仕事を行い、取引の機会を探します。適切なエントリーポイントを検出
まず第一に、この取引インジケーターは再描画されず、再描画されず、遅延しないことを強調する価値があります。これにより、手動取引とロボット取引の両方に理想的なものになります。 アトミックアナリストは、価格の強さとモメンタムを利用して市場でより良いエッジを見つけるためのPA価格アクションインジケーターです。ノイズや誤ったシグナルを除去し、取引ポテンシャルを高めるための高度なフィルターを備えています。複雑なインジケーターの複数のレイヤーを使用して、アトミックアナリストはチャートをスキャンし、複雑な数学的計算をシンプルなシグナルと色に変換します。これにより、どのような初心者トレーダーでも理解して使用し、一貫した取引の決定を行うことができます。 「アトミックアナリスト」は、新規および経験豊富なトレーダー向けにカスタマイズされた包括的な取引ソリューションです。プレミアムインジケーターとトップノッチの機能を1つの取引戦略に組み合わせ、すべてのタイプのトレーダーにとって汎用性のある選択肢にします。 デイリートレーディングとスキャルピング戦略:高速で正確なデイトレーディングおよび短期トレード
現在26%オフ 初心者やエキスパートトレーダーに最適なソリューション! このインジケーターは、独自の機能と新しい計算式を取り入れた、ユニークで高品質、かつ手頃な価格のトレーディングツールです。たった1枚のチャートで28の為替ペアの通貨強度を読み取ることができます。新しいトレンドやスキャルピングチャンスの引き金となるポイントを正確に特定することができるので、あなたのトレードがどのように改善されるか想像してみてください。 ユーザーマニュアルはこちら  https://www.mql5.com/en/blogs/post/697384 これが最初の1本、オリジナルだ! 価値のないクローンを買わないでください。 特別な サブウィンドウの矢印で強い通貨の勢いを表示 GAPがあなたのトレードを導く! 基準通貨や気配値が売られすぎ・買われすぎのゾーン(外相フィボナッチレベル)にあるとき、個別チャートのメインウィンドウに警告表示。 通貨がレンジの外側から反落した場合、プルバック/リバーサルのアラート。 クロスパターンの特別なアラート 複数の時間枠を選択可能で、トレンドを素早く
Scalper Vault は、スキャルピングを成功させるために必要なすべてを提供するプロフェッショナルなスキャルピング システムです。このインジケーターは、外国為替およびバイナリー オプションのトレーダーが使用できる完全な取引システムです。推奨される時間枠は M5 です。 システムは、トレンドの方向に正確な矢印シグナルを提供します。また、トップとボトムのシグナルとギャン マーケット レベルも提供します。 インジケーターは、プッシュ通知を含むすべてのタイプのアラートを提供します。 インジケータの購入後にご連絡ください。私の個人的な取引の推奨事項と素晴らしいボーナス指標を無料で共有します! 幸せで有益な取引をお祈りします!
TPSpro TRENDPRO  - is a trend indicator that automatically analyzes the market and provides information about the trend and each of its changes, as well as giving signals for entering trades without redrawing! The indicator uses each candle, analyzing them separately. referring to different impulses - up or down impulse. Exact entry points into transactions for currencies, crypto, metals, stocks, indices!  -  Version MT5               DETAILED DESCRIPTION        /       TRADING SETUPS           
ご紹介   クォンタム トレンド スナイパー インジケーターは 、トレンド反転を特定して取引する方法を変革する画期的な MQL5 インジケーターです。 13年以上の取引経験を持つ経験豊富なトレーダーのチームによって開発されました。     クォンタムトレンドスナイパーインジケーター   は、非常に高い精度でトレンドの反転を識別する革新的な方法で、あなたのトレーディングの旅を新たな高みに押し上げるように設計されています。 ***Quantum Trend Sniper Indicatorを購入すると、Quantum Breakout Indicatorを無料で入手できます!*** クォンタム ブレイクアウト インジケーターは、トレンドの反転を特定するとアラートを発し、矢印を示し、3 つのテイクプロフィットレベルを提案します。 初心者トレーダーにもプロのトレーダーにも適しています。 量子EAチャネル:       ここをクリック MT5のバージョン:       ここをクリック 推奨事項: 期間: すべての時間枠。最良の結果を得るには、
まず第一に、この取引ツールはノンリペイント、ノンリドロー、ノンラグの指標であり、プロの取引に理想的ですことを強調する価値があります。 スマートプライスアクションコンセプトインジケーターは、新米から経験豊富なトレーダーまで、非常 に強力なツールです。Inner Circle Trader AnalysisやSmart Money Concepts Trading Strategiesなど、20以上の有用な指標を1つに組み合わせています。このインジケーターはスマートマネーコンセプトに焦点を当て、大手機関の取引方法を提供し、彼らの動きを予測するのに役立ちます。 特に、流動性分析に優れており、機関がどのように取引しているかを理解しやすくしています。市場のトレンドを予測し、価格の動きを慎重に分析するのに優れています。機関の戦略とトレードを合わせることで、市場の動向についてより正確な予測ができます。このインジケーターは多目的であり、市場構造を分析し、重要な注文ブロックを特定し、さまざまなパターンを認識するのに優れています。 このインジケーターはBOSやCHoCHなどのパターンの識
SALE NOW! Limited Time Offer! An exclusive indicator that utilizes an innovative algorithm to swiftly and accurately determine the market trend. The indicator automatically calculates opening, closing, and profit levels, providing detailed trading statistics. With these features, you can choose the most appropriate trading instrument for the current market conditions. Additionally, you can easily integrate your own arrow indicators into Scalper Inside Pro to quickly evaluate their statistics and
Advanced Supply Demand
Bernhard Schweigert
4.92 (310)
現在33%オフ 初心者にもエキスパートトレーダーにも最適なソリューション このインジケーターは独自の機能と新しい公式を多数内蔵しており、ユニークで高品質かつ手頃な取引ツールです。このアップデートでは、2つの時間枠ゾーンを表示できるようになります。より長いTFだけでなく、チャートTFとより長いTF(ネストゾーンを表示)の両方を表示できます。すべてのSupply Demandトレーダーの皆さんのお気に召すはずです。:) 重要情報の公開 Advanced Supply Demandの可能性を最大化するには、 https://www.mql5.com/ja/blogs/post/720245 にアクセスしてください。   エントリーまたはターゲットの正確なトリガーポイントを正確に特定できれば取引がどのように改善されるか想像してみてください。新しい基盤となるアルゴリズムに基づいて構築されているため、買い手と売り手の間の潜在的な不均衡をさらに簡単に特定できます。これは、最も強い需要と供給のゾーンと、過去のパフォーマンス(古いゾーンを表示)がグラフィカルに表現されるためです。これらの機能は、最適
A key element in trading is zones or levels from which decisions to buy or sell a trading instrument are made. Despite attempts by major players to conceal their presence in the market, they inevitably leave traces. Our task was to learn how to identify these traces and interpret them correctly. Reversal First Impulse levels (RFI)   -  Version MT5                INSTRUCTIONS                 RUS                 ENG                                       R ecommended to use with an indicator   -  
カスタムMT4インジケーターで外国為替取引を成功させるための秘密を発見してください! 外国為替市場で成功を達成し、リスクを最小限に抑えながら一貫して利益を得る方法を疑問に思ったことはありますか? これがあなたが探している答えです! 取引へのアプローチに革命をもたらす独自のMT4インジケーターを導入できるようにします。 ユニークな汎用性 私たちのインジケータは、RenkoとRangeBarのろうそくのフォーメーションを好むユーザー向けに特別に設計されています。 これらのチャートタイプは多くの経験豊富なトレーダーに好まれていることを理解しています。そのため、私たちのインジケーターはそれらとシームレスに統合され、比類のない市場分析を提供します。 クリアトレンドシグナル 複雑な分析を忘れてください! 私たちのインジケーターは、鮮やかな色と明確なドット構造を利用して、市場の動向を明確に示しています。 赤と青の点は、価格の動きの方向性について疑いの余地がなく、取引の迅速な意思決定を可能にします。 HH/HL HL/LL戦略とのアライメント HH/HLおよびHL/LL構
TrendMaestro
Stefano Frisetti
5 (2)
note: this indicator is for METATRADER4, if you want the version for METATRADER5 this is the link: TRENDMAESTRO recognizes a new TREND in the bud, he never makes mistakes. The certainty of identifying a new TREND is priceless. DESCRIPTION TRENDMAESTRO identifies a new TREND in the bud, this indicator examines the volatility, volumes and momentum to identify the moment in which there is an explosion of one or more of these data and therefore the moment in which prices have strong probability of f
現在20%OFF! 初心者やエキスパートトレーダーのためのベストソリューション! このダッシュボードソフトウェアは、28の通貨ペアで動作しています。それは私達の主要な指標(高度な通貨の強さ28と高度な通貨インパルス)の2に基づいています。それは全体の外国為替市場の大きい概観を与えます。それは、すべての(9)時間枠で28の外国為替ペアのための高度な通貨の強さの値、通貨の動きの速度と信号を示しています。チャート上で1つのインディケータを使用して市場全体を観察し、トレンドやスキャルピングの機会をピンポイントで見つけることができたら、あなたのトレードがどのように改善されるか想像してみてください。 このインディケータには、強い通貨と弱い通貨の識別、潜在的な取引の識別と確認がより簡単になるような機能が搭載されています。このインディケータは、通貨の強さや弱さが増加しているか減少しているか、また、すべての時間枠でどのように機能しているかをグラフィカルに表示します。 新機能として、現在の市場環境の変化に適応するダイナミックなマーケットフィボナッチレベルが追加され、すでに当社のAdvan
驚異的なFXインジケーター「Miraculous」をご紹介します。完璧な結果を得るための1時間足を含むすべてのタイムフレームで効果的に機能する、最強の強力な特殊MT4フォレックスインジケーターです。 すべてのタイムフレームで優れた結果を提供する最高のFXインジケーターを探し続けるのに疲れましたか?これ以上探す必要はありません!「Miraculous」フォレックスインジケーターをご紹介します。このインジケーターは、トレーディングの経験を変革し、収益を新たなレベルに引き上げるために設計されました。 先進のテクノロジーと長年にわたる緻密な開発に基づいて構築された「Miraculous」フォレックスインジケーターは、FX市場における力と正確さの頂点となります。この素晴らしいツールは、すべてのレベルのトレーダーのニーズを満たすように設計されており、一貫した収益性を追求する上で比類のない優位性を提供します。 「Miraculous」フォレックスインジケーターの他との違いは、その非常に適応性にあります。デイトレーダー、スウィングトレーダーであろうと、長期ポジションを好む方であろうと、このインジケータ
複数通貨と複数フレームの売買に関するアラート。 自動トレーリングストップとリスク報酬で利益を獲得! インジケーターが市場をスキャンして分析するため、何もする必要はありません。 1 つのチャートですべての通貨を取引しましょう!   購入後、コメントを残して私に連絡してください。トレードアシスタントEAをお送りします。 このインジケーターはいくつかのオシレーターと付属のフィルターを使用して、最良の確認されたエントリーポイントを見つけますので、それについて心配する必要はありません。 警告が表示され、監視することを選択したすべての時間枠と通貨のボタンが描画されます。 ボタンを押すだけでチャートに移動し、取引を開始できます。 このインジケーターは、すべての基本通貨と市場監視通貨の強さパネルも描画します (設定で調整可能)。これにより、すべてのペアの通貨と選択されたより高い時間枠が表示されます。 インジケーターウィンドウ: チャート通貨のトレンドフィルターとマルチタイムフレームトレンドパネルを備えた特別なMACDヒストグラム! すべての通貨と時間枠の取引アラートを提供し、
これはMT4のインジケーターで、再描画なしで取引に参入するための正確なシグナルを提供します。 外国為替、暗号通貨、金属、株式、インデックスなど、あらゆる金融資産に適用できます。かなり正確な見積もりを提供し、取引を開始して終了するのに最適な時期を教えてくれます。1つのシグナルを処理しただけでインジケーターの元が取れた例の 動画 (6:22)をご覧ください。Entry PointsPro インジケーターの助けを借りたほとんどのトレーダーの最初の1週間の結果が改善しています。 Telegramグループ に登録してください。Entry Points Proインジケーターのメリットは次の通りです。 再描画のないエントリーシグナル 再描画されるインジケーターでは一度表示されたシグナルが削除されて大きな金銭的損失につながることがありますが、これと異なり、表示されて確認されたシグナルは消えることがありません。 エラーなしの取引開始 インジケーターアルゴリズムによって取引を開始する(資産を売買する)理想的な瞬間を見つけることができます。それを使用するすべてのトレーダーの成功率が向上します。
This indicator is unstoppable when combined with our other indicator called Katana. After purchase, send us a message and you could get Katana for FREE as a BONUS After purchase, send us a private message for your instructions.  MT5 version: click here 40 copies available at $55. There are 3 copies left before the next price of $105. Don't miss this great deal!  The Trend Forecasting indicator is a very unique & easy tool that is able to make prediction about future price movement
ご紹介     Quantum Breakout PRO は 、ブレイクアウト ゾーンの取引方法を変革する画期的な MQL5 インジケーターです。 13年以上の取引経験を持つ経験豊富なトレーダーのチームによって開発された Quantum Breakout PROは 、革新的でダイナミックなブレイクアウトゾーン戦略により、あなたの取引の旅を新たな高みに押し上げるように設計されています。 クォンタム ブレイクアウト インジケーターは、5 つの利益ターゲット ゾーンを備えたブレイクアウト ゾーン上のシグナル矢印と、ブレイクアウト ボックスに基づいたストップロスの提案を提供します。 初心者トレーダーにもプロのトレーダーにも適しています。 量子EAチャネル:       ここをクリック MT5バージョン:   ここをクリック 重要!購入後、インストールマニュアルを受け取るためにプライベートメッセージを送ってください。 推奨事項: 時間枠: M15 通貨ペア: GBPJPY、EURJPY、USDJPY、NZDUSD、XAUUSD アカウントの種類: ECN、Raw、また
PRO Renko Systemは、特別にRENKOチャートを取引するために設計された高精度の取引システムです。 これは、様々な取引商品に適用することができる普遍的なシステムです。 システムは効果的に正確な逆転信号へのアクセスを与えるいわゆる市場の騒音を中和する。 表示器は非常に使いやすく、信号の生成に責任がある1つの変数だけがあります。 あなたは簡単にお好みの任意の取引ツールとレンコバーのサイズにツールを適応させることができます。 私はいつもあなたが私のソフトウェアで収益性の高い取引を支援するために余分なサポートを提供する準備ができています! 私はあなたに幸せで収益性の高い取引をしたいです! ご購入後にご連絡ください! 私はあなたに私のレンコチャートジェネレータを送信します。 私はまた、私の個人的な推奨事項やシステムの他のモジュールを無料で共有します!
mql5と Telegramの モーニング・ブリーフィングで、詳細とスクリーンショットを含む毎日のマーケット・アップデートをご覧 ください! FX Power MT4 NGは 、長年の人気を誇る通貨強度計FX Powerの次世代モデルです。 この次世代ストレングスメーターは何を提供するのでしょうか?初代FXパワーの魅力すべて プラス GOLD/XAUの強さ分析 より正確な計算結果 個別に設定可能な分析期間 カスタマイズ可能な計算上限値により、さらに優れたパフォーマンスを実現 もっと見たい人のための特別なマルチインスタンス設定 すべてのチャートでお好みの色を無限に設定可能 数え切れないほどの通知オプションにより、重要なことを見逃すことはありません。 Windows 11とmacOSのスタイルで角を丸くした新しいデザイン 魔法のように動くインジケーターパネル FXパワーの主な機能 すべての主要通貨の強さの完全な履歴 すべての時間枠における通貨の強さの履歴 すべてのブローカーとチャートで同一の計算結果 100%信頼できるリアルタイム計算 -> リペイントなし ドロップダウン・リストから
Break & Retest is unstoppable when combined with our other divergence indicator. After purchase, send us a message and you could get this  2nd indicator  for  FREE  as a  BONUS! ‍You can visually backtest Break & Retest to see how it behaved in the past!    Manual guide:   Click here $59  for the first 25 copies ( 7  left)! Next price is $120 .  After many months of hard work and dedication, we are extremely proud to present you our  Break and Retest price action indicator crea
現在31%オフ! 初心者やエキスパートトレーダーに最適なソリューション! このインジケータは、独自の機能と秘密の数式を組み込んだ、ユニークで高品質かつ手頃な価格のトレーディングツールです。たった1枚のチャートで28の通貨ペアのアラートを表示します。新しいトレンドやスキャルピングチャンスの引き金となるポイントを正確に把握することができるので、あなたのトレードがどのように改善されるか想像してみてください! 新しい基本的なアルゴリズムに基づいて構築されているため、潜在的な取引の特定と確認がより簡単になります。これは、通貨の強さや弱さが加速しているかどうかをグラフィカルに表示し、その加速のスピードを測定するためです。加速すると物事は明らかに速く進みますが、これはFX市場でも同じです。つまり、反対方向に加速している通貨をペアにすれば、利益を生む可能性のある取引を特定することができるのです。 通貨の勢いを示す縦の線と矢印は、あなたの取引の指針となるでしょう。 ダイナミックマーケットフィボナッチ23レベルはアラートトリガーとして使用され、市場の動きに適応します。もしインパルスが黄色
TrendDecoder Premium
Christophe, Pa Trouillas
5 (3)
レンジと次の動きを特定    |  トレンドの最も早いシグナルと強さを得る   |  反転の前に明確な出口を得る   |  価格がテストするフィボ・レベルを見つける。 非リペイント、非遅延インディケータ - マニュアルおよび自動売買に最適 - すべての資産、すべての時間単位に対応 期間限定キャンペーン   >> 50%OFF 購入後、 推奨セッティングについては、このチャンネルで私に連絡してください。 MT5 バージョン: ここをクリック BladeSCALPER   と   PowerZONES   を使った完全な方法を入手する どのようなものですか? TrendDECODERは、トレンド監視をシンプルかつ簡単にするための複数のイノベーションを集約したものです。 Projective TrendLine (投影トレンドライン) - 今後のトレンドのスピードリファレンス。 RealTime TrendLine vs. Projective TrendLine (リアルタイムトレンドライン vs. Projective TrendLine) - 市場が同じ方
通貨強さウィザードは、取引を成功させるためのオールインワン ソリューションを提供する非常に強力な指標です。このインジケーターは、複数の時間枠のすべての通貨のデータを使用して、このまたはその外国為替ペアのパワーを計算します。このデータは、使いやすい通貨インデックスと通貨パワーラインの形式で表され、特定の通貨のパワーを確認するために使用できます。 必要なのは、取引したいチャートにインジケーターを接続することだけです。インジケーターは、取引する通貨の実際の強さを示します。このインジケーターは、トレンドに合わせて取引するときに有利に利用できる売買高の圧力の極値も示します。このインジケーターには、フィボナッチに基づく可能なターゲットも表示されます。 このインジケーターは、PUSH 通知を含むあらゆるタイプのアラートを提供します。 購入後ご連絡下さい。私の取引のヒントをあなたと共有し、素晴らしいボーナスインジケーターを無料で提供します! 幸せで有益な取引をお祈りします。
このインジケータは、手動および自動的な方法でチャートに描かれたハーモニックパターンを検出します。ユーザーマニュアルは、このリンクから参照できます: あなたのレビューを追加し、入手するために私たちに連絡してください。 この製品をmt4で試すための無料版があります。 GartleyおよびNenstarパターンを検出するために使用できます。 https://www.mql5.com/en/market/product/30181 完全なMT4バージョンを購入するには、次の場所から購入できます。 https://www.mql5.com/en/market/product/15212 注 インジケータにはコントロールパネルがあり、すべての(チャート&時間枠)設定が保存されます。チャート上でスペースをより多く確保するために、最小化することができ、他の分析ツールで作業する場合は、すべてのインジケータデータを非表示にするために閉じるボタンを押すことができます。 このインジケータを使用して設定を変更し、移動平均やボリンジャーバンドなどのインジケータを追加すると、編集のテンプレートが自動的に保存され、必
FX Volume
Daniel Stein
4.6 (35)
mql5と Telegramの モーニング・ブリーフィングで、詳細とスクリーンショットを含む毎日のマーケット・アップデートをご覧 ください! FX Volumeは、ブローカーの視点から市場のセンチメントをリアルに洞察する、最初で唯一の出来高インジケーターです。 ブローカーのような機関投資家が外国為替市場でどのようなポジションをとっているか、COTレポートよりもはるかに速く、素晴らしい洞察を提供します。 この情報をチャート上で直接見ることは、あなたの取引にとって真のゲームチェンジャーであり、画期的なソリューションです。 以下のようなユニークなマーケットデータ洞察から利益を得てください。 比率は 、通貨のロングポジションとショートポジションの比率をパーセントで表示します。 比率の変化は 、選択した期間内のロング比率とその変化率を表示します。 Volumes Totalは 、通貨の取引量(ロングとショート)の合計をロット単位で表示します。 Volumes Long :全通貨のロングポジションの取引量を表示します。 Volumes(ショート )は、全通貨のショートポジションの取引量を表示
まず最初に、このトレーディングシステムがリペイントされず、再描画されず、遅延しないことを強調する価値があります。これにより、プロのトレーディングに最適な状態になります。 「スマートサポートアンドレジスタンストレーディングシステム」は、新規および経験豊富なトレーダー向けにカスタマイズされた高度なインジケーターです。この包括的なシステムは、7以上の戦略、10のインジケーター、およびデイトレード戦略、スイングトレード戦略、サポートおよびレジスタンス戦略、ローソク足パターン戦略、VWAP戦略、マルチタイムフレームトレンド戦略など、さまざまなトレーディングアプローチを組み合わせています。これは、矢印信号、エントリーポイント、出口ポイント、トレードアラート、より高い時間枠のトレンド分析、リアルタイムのトレードモニタリング、そして洞察力のあるトレンドとボリュームキャンドルの着色を提供します。自動的なサポートとレジスタンスの検出により、さまざまな市況下でトレーダーが的確な決定を下すのを支援する多面的なインジケーターとなっています。 スマートサポートアンドレジスタンストレーディングシステムは、
How to use Pair Trading Station Pair Trading Station is recommended for H1 time frame and you can use it for any currency pairs. To generate buy and sell signal, follow few steps below to apply Pair Trading Station to your MetaTrader terminal. When you load Pair Trading Station on your chart, Pair Trading station will assess available historical data in your MetaTrader platforms for each currency pair. On your chart, the amount of historical data available will be displayed for each currency pai
Cycle Sniper
Elmira Memish
4.4 (35)
NEW YEAR SALE PRICE FOR LIMITED TIME!!! Please contact us after your purchase and we will send you the complimentary indicators to complete the system Cycle Sniper is not a holy grail but when you use it in a system which is explained in the videos, you will feel the difference. If you are not willing to focus on the charts designed with Cycle Sniper and other free tools we provide, we recommend not buying this indicator. We recommend watching the videos about the indiactor and system before pu
プレシジョン・インデックス・オシレーター(Pi-Osc)は、Precision Trading SystemsのRoger Medcalfによるものです。 バージョン2は、チャートにスーパーファストでロードされるように注意深く再コードされ、その他の技術的な改良も組み込まれて、エクスペリエンスを向上させています。 Pi-Oscは、市場が強制的に行かなければならない、すべての人のストップを取り除くためのポイントである、極限のエクソースト・ポイントを見つけるために設計された正確な取引タイミング信号を提供するために作成されました。 この製品は、極限のポイントがどこにあるかを知るという古代の問題を解決し、トレーダーの生活をはるかにシンプルにします。 これは、業界標準のオシレーターとは異なる強力な要素を持つ高度なコンセンサス・インジケーターです。 使用されている一部の機能には、需要指数、マネーフロー、RSI、スティリング、パターン認識、出来高分析、標準偏差の極値などがあり、異なる長さでこれらのバリエーションが多く含まれています。 初めて見ると、訓練されていない目には、他の
作者のその他のプロダクト
MFI Modern PRO
Davit Beridze
4.94 (51)
Def ault settings   are just for visu alis ation, it c an not be profit able with it.  Get a Free EA as a Bonus when you Purchase the Indicator! Plus, Receive 4 Interesting Additional Indicators. Recommended set files for backtesting the indicator on recommended pairs are available in the comments section (last page). Please note that this product is exclusively sold on the MQL5 market. Any other sources offering it are scams, and the author bears no responsibility. To receive the bonus gifts,
You get Ea based on MRA Index for free as a Bonus in case of indicator purchase.  For sc alping I optimize sets on period of l ast 12 months  and use it next 1 month, this w ay it works very well ! Def ault settings   are just for visu alis ation, it c an not be profit able with it, recommended set files I sh are with buyers. The "MRA Index" forex indicator is a versatile tool that combines various technical elements to provide traders with valuable insights into potential market trends and entr
MA Speedometer
Davit Beridze
4.71 (14)
Non standard attitude to the standard moving average indicator. The essence of the indicator is to determine the strength and speed of the price direction by determining the tilt angle of the moving average. A point is taken on the fifteenth MA candle and a point on the last closed MA candle, a straight line is drawn between them, it is movable and on a hemisphere shows an angle of inclination from 90 degrees to -90. above 30 degrees is the buying area, below -30 degrees is the selling area. abo
RSI Entry Points is the upgrade of the standard RSI indicator to avoid lagging. Indicator draws the clouds and the arrows to have clear picture where price is and what to wait for. Why standard RSI is lagging? because mostly we do not use it correctly and it is with very weak visual flexibility, less informativity. With my current upgrade I tried to Fix both problems same time and I got much better results and more exact entries than standard RSI has. To make yourself sure check out the screens
after getting indic ator cont act me for Bonus E a. Non Repaint TMA channel with special conditioned arrows on price cross of channel lines plus market Volatility factor, which makes product much more accurate than any usual tma channel indicators.  It is proven to be profitable with Ea built based on it which you will get as a BONUS in case of indicator purchase. Good luck.
B acktest with set files from comments section (L a st comment) with method open price only. Watch video and Turn ON Subtitles when watching! This EA contains Few stop out levels built in what makes it much safer than any other method! Never pay attention to the Stereotips. Any method can be risky if you use them without a Sense. Steady Ranger EA is an advanced automated channel trading system with potential to find out hundreds of profitable set files according to the back tests. This EA is n
Check my p a id tools they   work  perfect please r ate Here is an Upgraded version with Bonus Ea in case of purchase it costs 30$ only and you get Ea as Bonus:  https://www.mql5.com/en/market/product/96835 This indicator is experimetal, it shows TMA channel arrows with Volatility filter built in to avoid lagging. Try to experiment with it, search for better conditions of use. It is possible to adjust different timeframes for TMA and for Volatility filter Same time on the current chart, so it ma
FREE
Re ad First Before Testing. This Ea goes as a Bonus to  MFI Modern PRO indicator users only. Set files generated  after upgrade you can check in comments section. This Expert advisor is based on MFI Modern PRO indicator   https://www.mql5.com/en/market/product/80765 just to  give possibility to indicator users for fastly test the indicator Before buying. In comments section recommended set files are uploaded by which you can prove yourself that backtest data from indicator overview are real. Thi
Check my p a id tools they   work  perfect please r ate Adjustable PIN BAR indicator is usefull tool alowing to search for pin bars you wish to find on the price chart, it has 2 parameters to filter out what type of pin bars you wish to search for: 1) MinTailProc 75% (default) which means to show pin bars that has minimum size of the Nose (Tail) as 75% of full candle size. If Upper Nose (Tail) size of the candle is minimum 75% of the candle size fully than candle is painted in RED. If Lower Nose
FREE
Non standard attitude to the standard moving average indicator. The essence of the indicator is to determine the strength and speed of the price direction by determining the tilt angle of the moving average. A point is taken on the fifteenth MA candle and a point on the last closed MA candle, a straight line is drawn between them, it is movable and on a hemisphere shows an angle of inclination from 90 degrees to -90. above 30 degrees is the buying area, below -30 degrees is the selling area. abo
Check my paid tools they work great and I share Ea's based on them for free please r ate The Dual Timeframe RSI (Relative Strength Index) indicator is a novel trading tool that allows traders to monitor RSI readings from two different timeframes on a single chart. This dual perspective enables traders to identify potential trend confirmations and divergences more effectively. For instance, a trader might use a 1-hour RSI alongside a daily RSI to ensure that short-term trades align with the bro
FREE
Indicator shows buy/sell arrows depending on volatility factor. Indicator does not repaint! It works on any pair and any timeframe. It is well tested through strategy builders and shows quite interesting results as a good filter indicator and as independent signaler as well (check the screenshots). It is possible to search for a lot of interesting parameters for profitable trading, some of which are shown on the screenshots. There are next inputs in indicator settings: N-volatility period; Level
RSI Entry Points is the upgrade of the standard RSI indicator to avoid lagging. Indicator draws the clouds and the arrows to have clear picture where price is and what to wait for. Why standard RSI is lagging? because mostly we do not use it correctly and it is with very weak visual flexibility, less informative. With my current upgrade I tried to Fix both problems same time and I got much better results and more exact entries than standard RSI has. I Made RSI line Dynamic, it gets more flexible
This EA is Created just for RSI Entry points Indicator ( https://www.mql5.com/en/market/product/67581 Test, to show indicators profitable parameters and to give potential buyers possibility to backtest indicator Entries. EA opens Buy orders on Buy Arrows and Sell orders on Sell Arrows of the indicator, orders are closed on opposite signals. EA is not created for Live automated trading, thats not the goal to sell EA, but any ways if you like it and need it, you can rent. Default settings are f
"Period Cross RSI" Is a New indicator idea that shows crosses of two RSI lines with different periods which creates ascending and descending zones for confirmation of long and short trading. This indicator is brend new and will be upgraded further, for now I recommend to use it as a confirmation, filter indicator for determination of long/short trading zones, not as a signaler indicator for now. Further upgrades can make it as a signaler indicator as well.  currently cross of two RSI lines with
MA Revolution is upgraded version of standard Moving   A verage. With the current upgrade moving average line got more sensitive with different market conditions. It gets more flexible by decreasing default period step by step while market is sharp and incrasing period back to default period step by step while market is normal again. testing of the ide a shows th at this upgr aded version gives much more acur acy for detecting m arket direction, ch anges in direction are shown much e arly th an
Fiter
Davit Beridze
5 (1)
Indicator customers will get Ea based on Fiter indicator for free as a Bonus. (watch video to see Ea in action) Fiter is EMA+ATR*RSI hibrid yellow line combined with Moving average red line, cross of which gives much smoother results than two simple Ma cross usage in trading. Effectiveness is proven by backtest and comparison with two simple Ma crosses. History shows that this method Fits with different market conditions and it can be boldly used in real manual trading for determining big trend
Indicator shows buy/sell arrows depending on volatility factor. Indicator does not repaint! It works on any pair and any timeframe. It is well tested through strategy builders and shows quite interesting results as a good filter indicator and as independent signaler as well (check the screenshots). It is possible to search for a lot of interesting parameters for profitable trading, some of which are shown on the screenshots. There are next inputs in indicator settings: N-volatility period; Level
フィルタ:
Epsilon Hogas
1468
Epsilon Hogas 2023.04.09 18:05 
 

I use it to assist my entries in combination with differnet TI so far, author is honest and helpful

レビューに返信
バージョン 1.6 2023.03.18
vrong version fixed with correct one
バージョン 1.5 2023.03.18
1) nuts changed with arrows as they were loading terminal.
2) indicator window removed and logic left in arrows only to have more clear signals.
3) Bug fixed with CCI TF.
4) added one new option "distance" that prevents signal to appear same direction if it is too close from previous one. ( 0 means no distance option to work.)
5) added option to chose one from 3 modes: 1) first arrow only per direction. 2) signals with best price only after first signal, (new buys only belowe previous, new sells only above previous) 3) all signals (as it was before).
Contact me to get upgraded Ea.