• 概要
  • レビュー
  • コメント

IdeaTools Repeater

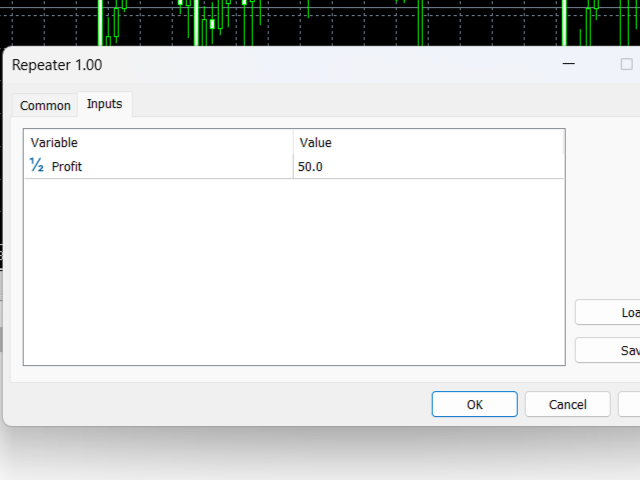
This indicator closes the positions when Profit. This way you can achieve a goal without determine Take Profit. 


Parameters:

Profit: the amount of Dolllars you want to close when profit. 


Just determine Profit section and open new positions. If Any of your positions reaches above Profit , Indicator will close automatically and you will recieve your Profit. 

おすすめのプロダクト
Hello, In this indicator, I started with a simple moving average crossover algorithm. However, in order ot get more succesfull results, I created different scenarios by basin the intersections and aptimized values of the moving averages on opening, closing, high and low values. I am presenting you with the most stable version of the moving averages that you have probably seen in any environment. We added a bit of volume into it. In my opinion, adding the Bollinger Band indicator from the ready-
MT5インジケーター「トラフィックシグナル」は、RSI、ストキャスティクス、CCI、トレンドの水準を分析する特別な戦略に基づいて、すべての時間枠で最も正確なエントリーシグナルを得るための特別な戦略に基づいて動作します。トラフィックシグナルは、成功した取引の世界への入り口です!精度と専門知識で設計されたこの革新的なインジケーターは、先進的なテクニカルインジケーターであるRSI、ストキャスティクス、CCI、トレンドを全時間枠で活用し、前例のない自信を持って市場をナビゲートするための最も正確なエントリーシグナルを提供します。 トラフィックシグナルを使用することで、収益性の高い取引機会を検出するために精密に調整された重要なテクニカル指標の包括的な分析にアクセスできます。不確実性を払拭し、情報を基にした意思決定の新たな時代を迎えましょう。RSI、ストキャスティクス、CCI、トレンドの潜在能力を引き出すトラフィックシグナルは、これまでにない市場のダイナミクスを鮮明に描写します。 トラフィックシグナルを使って、市場のトレンドとパターンを容易に把握できます。短期的なエネルギーサージまたは長期的な戦略的
バイナリ オプションの可能なコールおよびプット エントリを生成する人工知能に基づくインジケーター。 このインジケーターは 3 つの異なる戦略で機能します。 1) 出来高を読み取ることで、価格が反転する時期にシグナルを送信します。 2) 価格と出来高の乖離を通じて、トレンドが継続するか反転するかを知らせます。 3) 価格と出来高の収束を通じて、トレンドが継続すべき時期にシグナルを送信します。 この指標はすべての時間枠で機能しますが、最良の結果は 3 分または 5 分の期限で得られます (制度的な攻撃は短い時間枠で見られるため)。 最も流動性の高い時間帯、つまりグリニッジ標準時 7 時からグリニッジ標準時 18 時までが最適です。 このインジケーターは正しいシグナルの 70% 以上を生成しますが、価格を操作する機関同士の争いに遭遇したり、相互に拒否したりして、一連の誤ったシグナルが生成される可能性があります。そのため、適切な資金管理を使用することをお勧めします (Masaniello の例) )
EYeQ インジケーターは、STEP INDEX、VOLATILITY 10、25、50、75 100、BOOM、および CRUSH でエントリーシグナルを提供するための強力なツールです。 BOOMやCRUSH 300、500、1000でのSPIKESをより効果的にキャッチ。 EYeQ インジケーターは、複数の時間枠にわたって市場を分析し、トレンドに基づいて最適なエントリー ポイントを見つけます。デスクトップ アラートをオンにするだけで、シグナルがリリースされたときに通知を受け取ることができます。電話やタブレットなどの他のポータブル デバイスへのプッシュ通知を許可して、そのようなデバイスでのリモート取引のアラートを受け取ります。 N/B: Boom および Crush インデックスでの TRADING TICKS の取引は避けてください。また、指標は終了ポイントを提供しないことに注意してください。MetaTrader プラットフォームの各商品の最小ロット サイズで 3 USD の利益が発生した場合は、終了する必要があります。 例: 最低ロットサイズ;ステップインデック
Limitless MT5 is a universal indicator suitable for every beginner and experienced trader. works on all currency pairs, cryptocurrencies, raw stocks Limitless MT5 - already configured and does not require additional configuration And now the main thing Why Limitless MT5? 1 complete lack of redrawing 2 two years of testing by the best specialists in trading 3 the accuracy of correct signals exceeds 80% 4 performed well in trading during news releases Trading rules 1 buy signa
The  Market Sessions Indicator for MT5 helps you  predict market turnarounds  by detecting major supply and demand areas. These pivot points tend to occur after a new session has started and the previous one is still open. It is also used to gauge how many points or pips the market moves on average during a session. This helps us to place better our take profits and stop losses. The indicator works on all forex pairs, gold, silver, commodities, stocks, indices and any other instrument that your
The best quality application of the famous Super Trend indicator that requires no introduction. It is completely faithful to the original algorithm and powered by the CCI indicator. - easy to trade - It implements all kinds of warnings. - It implements a multi-timezone dashboard. - It cannot be repainted or backpainted. Input parameters - ATR Period – This is the average true range period. - ATR Multiplier - The ATR multiplier that defines the trend. - CCI - Makes trend following powerful. -
このインジケーターは人工知能に基づいており、フットプリントを読み取ることで市場の反転ポイントの可能性を特定し、市場の小さな変動が発生する前に事前に通知します。 「遅い」エントリーを生成する価格や出来高のインジケーターとは異なり、つまり、方向の変化で価格または出来高の確認がすでに発生しており、したがって動きはすでに終了していることが多い場合、このインジケーターは、フットプリントは、「動きが起こるべきとき」に基づいているため、動きが始まったらすぐに市場に参入する可能性を提供します。 反転のシグナルを生成するだけでなく、すでに進行中のトレンドの継続のシグナルも生成します。 この指標は、人工知能のおかげで、各レベルの市場で実際に約定された契約を読み取ります (約定を待っているブック内の契約ではなく、約定直前にアルゴ取引によって削除されます)。 このインジケーターは、売り買いで実行された契約を区別することができます(したがって基本的に積極的な注文と消極的な注文を認識します)、それらが市場で約定される頻度と積極性を区別できます(したがって、大手オペレーターの「プッシュ」する意図を検出します)
To get access to MT4 version please click here . This is the exact conversion from TradingView:"HIGH AND LOW Optimized Trend TrackerHL OTT" by "kivancozbilgic" This is a light-load processing indicator. It is a non-repaint indicator. All input options are available.  Buffers are available for processing in EAs. You can message in private chat for further changes you need. Thanks.
The indicator determines a special pattern of Joe Dinapoli. It gives very high probability buy and sell signals. Indicator does not repaint. Indicator Usage Buy Signal ''B'' Entry : Market buy order at signal bar close Stop : Low of signal bar Take Profit : First swing high Sell Signal ''S'' Entry : Market sell order at signal bar close Stop : High of signal bar Take Profit : First swing low Indicator Parameters Fast EMA : External Parameter (should be kept as default) Slow EMA: External Param
Introducing our latest innovation in MetaTrader 5 indicators, designed to dramatically improve your trading workflow with high functionality and ease-of-use. It features a robust collection of features designed to help you streamline chart analysis and make the most of your trading decisions. Here's a quick rundown of its incredible features: Fast Drawing of Objects : Save precious time with the quick draw feature. With just a click of a button, you can create various trading objects on your ch
To download MT4 version please click here . - This is the exact conversion from TradingView: "Linear Regression Candles" By "ugurvu". - The overall look of the indicator is like Heiken Ashi. - It can be used as a trend confirmation indicator to detect the right trend direction. - This indicator lets you read the buffers for Candles' OHLC. - This is a non-repaint and light processing load indicator - You can message in private chat for further changes you need. Thanks
The indicator scans for TD Sequential signals in multiple timeframes for the all markets filtered and shows the results on Dashboard. Key Features Dashboard can be used for all markets It can scan for signals on MN1, W1, D1, H4, H1, M30, M15 ,M5, M1 timeframes Parameters UseMarketWatch: Set true to copy all symbols available in market watch MarketWatchCount : Set the number of symbols that you want to copy from the market watch list. CustomSymbols: Enter the custom symbols that you want to be a
ADRアラートダッシュボードは、価格が通常の1日の平均範囲に関連して現在取引されている場所を一目で示します。価格が選択した平均範囲とレベルを超えると、ポップアップ、電子メール、またはプッシュを介して即座にアラートを受け取るため、プルバックと逆転にすばやくジャンプできます。ダッシュは空白のチャートに配置されるように設計されており、バックグラウンドに座ってレベルに達したときに警告を発するので、座って見たり、まったく見たりする必要はありません。 ここで利用可能なMT4バージョン:https:// www.mql5.com/en/market/product/62756 NEW:毎週と毎月の平均範囲とそれらへのアラートも表示されるようになりました! ここでチャートのレベルを下げるADRリバースインジケーターを入手してください:https:// www.mql5.com/en/market/product/64477 通常の1日平均レンジ(ADR)内で価格が取引され、これらのレベルを上回っている時間の約60%は、通常、その後の引き戻し(利益確定)の動きを伴う急激な価格の動きの指
This indicator works on atr with some edited . The AI ​​MACD FILTER indicator is used for confirmation. Certainly, the indicator contains an alert when the signal appears, and you use the exit of the deal on the saturation that occurs at the AI ​​MACD. The accuracy of the work is high on gold, the time frame is five minutes, while staying away from trading at the time of news that occurs on the US dollar. And using high liquidity trading times, which are two hours before the opening of the Lo
All 11 indicators quickly turn off and turn on quickly! Set of indicators: 2 indicators "TREND"   : - fast = line 4 colors - slow = dots 4 colors The coloring of the indicators depends on the direction of the trend and the RSI indicator: 1) uptrend and RSI<50% 2) uptrend and RSI>50% 3) downtrend RSI<50% 4) downtrend RSI   >   50% Set indicator periods for each timeframe: M5 M10 M15 M30 H1 H2 H4 H6 H12 D1 W1 MN Do not enter trades if at least 1 of the indicators is horizontal. For a
Buy Sell Visual MTF
Naththapach Thanakulchayanan
This MT5 indicator, Bull Bear Visual MTF (21 Time Frames), summarize the strength color graphic and percentages of power for both  Bull and Bear in current market emotion stage which will show you in multi time frames and sum of the total Bull and Bear power strength which is an important information for traders especially you can see all Bull and Bear power in visualized graphic easily, Hope it will be helpful tool for you for making a good decision in trading.
Expert Market Edge is scalping, trending, reversal indicator, with alerts . You can use it all and fit with your strategy whatever it fits you. My recommendation is to combine with my Colored RSI , and when 2 signals are matched, and pointing same direction (for example buy on this indicator, and green on RSI, you can take a long position, stop loss should be last local low, if you want to be more conservative, add ATR. ) you can take position. If you using moving averages, that's even better i
Dear traders and investors, Introducing   Vikopo BB Candle MT5 , Developed by a team of experienced traders with trading experience of over 15 years. MT4 Version : https://www.mql5.com/en/market/product/115116 products List : https://www.mql5.com/en/users/vikopoadvise/seller Strategy Introduction : When utilizing this robot, we have harnessed the power of cutting-edge neural plugins to enhance its capabilities. By integrating these neural plugins, our trading robot is equipped wi
Trade Extractor MT5
Philip Pankaj Suthagar
2 (1)
TRADE EXTRACTOR   is the fastest self-learning AI Algorithm, which will learn any market situation with ease.As a Manual trader, I came across the difficulty of finding the right parameter and the right condition to trade. There are infinite combinations of indicators and objects(trendlines, gann grid, fibo levels etc) which as an human, I can’t decide their winning rate or performance. Many claim to have a winning strategy but won’t have enough statistical support to prove their claims. Due to
A useful scanner/dashboard that shows the RSI values for multiple symbols and Time-frames. It can be easily hidden/displayed with a simple click on the scanner man top left of the dashboard. You can input upper and lower RSI values and the colours can be set to show when above/below these values. The default values are 70 and 30. There are also input colours for when the RSI is above or below 50 (but not exceeding the upper/lower levels Symbols and time-frames are input separated by commas.
Heikin Ashi Heikin Ashi is a charting technique that can be used to predict future price movements. It is similar to traditional candlestick charts. However, unlike a regular candlestick chart, the Heikin Ashi chart attempts to filter out some of the market noise by smoothing out strong price swings to better identify trend movements in the market. To create Heiken Ashi, a formula is used in which price data is entered, while ordinary candles are built only on bare numbers, without using any
Volume Trade Levels
Mahmoud Sabry Mohamed Youssef
The idea behind this indicator is very simple , First it contains 2 mechanisms to place your trades: 1- Enter the Pips you want to duplicate to price levels. 2- Automatically let the indicator specify the largest Buy / Sell Volume Candle and place duplicated levels based on the candle itself. How it works: 1- Enter the Pips you want to duplicate to price levels:    1- once the indicator is loaded you will need first to Specify the number of pips in the indicator Configuration window ,you can
Mean Reversal Heikin Ashi Indicator calculates special trade reversal points based on Heikin Ashi candlesticks patterns. This indicator can be used on all symbols, even in Forex or B3 Brazillian Markets. You can configure just the position of each arrow. Then, after include the indicator on the graphic, pay attention on each arrow that indicates a long or short trade.
Round Numbers And Psychological Levels (Multi Pair And Multi Time Frame) :   ---LIMITED TIME OFFER: NEXT 25 CLIENTS ONLY ---46% OFF REGULAR PRICE AND 2 FREE BONUSES ---SEE BELOW FOR FULL DETAILS Studies show that more orders end in '0' than any other number.  Also know as 'round numbers', or 'psychological levels', these levels act as price barriers where large amounts of orders will generally accumulate. And the larger the number, the larger the psychological significance. Meaning that even
Bu indikatör Deriv firmasındaki Boom ve Crash çiftlerinde spike hareketlerini tespit etmek ve işleme girmek için kullanılır. Kullanılan çiftler Boom300, Boom500, Boom1000, Crash300, Crash500, Crash1000. İndikatör, beklenen yönde ok işareti verdiği zaman işleme girilir ve indikatörün gösterdiği destek/direnç bölgelerine Stop Loss koyulmalıdır. İndikatör yeniden boyama(repaint) yapmaz. Trend takibi için değil, spike yönünde işleme girmek için kullanılır. Tavisye edilen; sadece spike yönünde işlem
The indicator monitors the Dinapoli MACD trend in multiple timeframes for the all markets filtered and shows the results on Dashboard. Key Features Indicator can be used for all markets Monitors every timeframe, from 1 Min to Monthly Parameters UseMarketWatch: Set true to copy all symbols available in market watch MarketWatchCount : Set the number of symbols that you want to copy from the market watch list. CustomSymbols: Enter the custom symbols that you want to be available in dashboard.
The Glider indicator gives accurate and timely signals to enter and exit the transaction that appear on the current candle. Using the indicator is very simple. When a dot and a blue line appear, open a buy deal. When a dot and a red line appear, open a sell deal. The main purpose of this indicator is to determine the moments of entry and exit from transactions, therefore the Glider indicator will display only the trend line and entry points, i.e. displays displays the entry points to the mark
My PVSR
Ashok Kumar Singha
My PVSR   is based on All Type of Pivot Points. Use this Indicator to get proper Support / Resistance Zone and Trade accordingly.. Recommendation: Use this Indicator along with my another Indicator --->>> Dr. Trend   <<<--- Click Here ; To get the best output result feel free to contact me ; Best of Luck It can be used for: All Pairs: Forex, Cryptocurrencies, Metals, Stocks, Indices etc. All Timeframe All Brokers All type of Trading Style like Scalping, Swing, Intraday, Short-Term, Lon
XFlow shows an expanding price channel that helps determine the trend and the moments of its reversal. It is also used when accompanying transactions to set take profit/stop loss and averages. It has practically no parameters and is very easy to use - just specify an important moment in the history for you and the indicator will calculate the price channel. DISPLAYED LINES ROTATE - a thick solid line. The center of the general price rotation. The price makes wide cyclical movements around the
このプロダクトを購入した人は以下も購入しています
Bill Williams Advanced is designed for automatic chart analysis using Bill Williams' "Profitunity" system. The indicator analyzes four timeframes at once. Manual (Be sure to read before purchasing) Advantages 1. Automatically analyzes the chart using the "Profitunity" system of Bill Williams. The found signals are placed in a table in the corner of the screen. 2. Equipped with a trend filter based on the Alligator indicator. Most of the system signals are recommended to be used only accordi
note: this indicator is for METATRADER4, if you want the version for METATRADER5 this is the link:  https://www.mql5.com/it/market/product/108106 TRENDMAESTRO recognizes a new TREND in the bud, he never makes mistakes. The certainty of identifying a new TREND is priceless. DESCRIPTION TRENDMAESTRO identifies a new TREND in the bud, this indicator examines the volatility, volumes and momentum to identify the moment in which there is an explosion of one or more of these data and therefore the mome
VTrende Pro
Andrii Diachenko
5 (1)
VTrende Pro - MTF indicator for trend trading with a display panel for MT5 *** Videos can be translated into any language using subtitles (video language - Russian) Although the signals of the VTrende Pro indicator can be used as signals of a full-fledged trading system, it is recommended to use them in conjunction with the Bill Williams TS. VTrende Pro is an extended version of the VTrende indicator. Difference between Pro version and VTrende: - Time zones - Signal V - signal 1-2 waves
IVISTscalp5
Vadym Zhukovskyi
5 (3)
iVISTscalp5インジケーターをご紹介します。このインジケーターは、トレーディングにおいて独自でありながら効果的です。時間データに基づくこのインジケーターは、多年にわたる経験と金融市場の深い分析の結果です。iVISTscalp5インジケーターは、手動トレーディングにとって優れたツールです。便利さ、簡単さ、可視化 - すべての複雑さが内部に隠されています。私たちは、iVISTscalp5インジケーターの設定と使用を最大限に簡素化しました。このインジケーターは、MT5ターミナルにあるすべての金融商品に適しています。 稼働時間は、4時から20時(UTC+3)です。 iVISTscalp5インジケーターメニュー(スクリーンショット1を参照): History - 引用を計算する週数 dT_min - 時間間隔の選択(分) TFline - 水平ボリュームの作成(時間枠) BARSline - 水平ボリュームの作成(バー数) TFtrend1 - デイリーチャンネルの作成(時間枠) BARStrend1 - デイリーチャンネルの作成(バー数) TFtrend2 - 週次チャンネルの作成(時
SMCpro MT5  Original Price  $440   ---  Currently Price  40% OFF  ( for unlimited use ) Hello World! Introducing.. SMCpro tool and Indicator for  MetaTrader 5 , a cutting-edge feature designed to revolutionize your trading experience. With innovative ICT Smart Money Concept, you gain unparalleled insight into market dynamics, empowering you to make informed trading decisions like never before. Built on the foundation of advanced algorithms and real-time data analysis, SMCpro tool and Indicat
Weis Wave with Alert MT5
Trade The Volume Waves Single Member P.C.
4.93 (15)
Rental/Lifetime Package Options and Privileges  * For optimum results the yearly or lifetime package is suggested due to live training ! Rent Monthly Six Months   Yearly/Lifetime Weis Wave with Speed with Alert+Speed Index x x x Manual  x x x Quick Set up Video x x x Blog x x x Lifetime Updates x x x Setup and Training Material x x Free Rectangle Break Alert Tool      x Discord Access Channel "The SI traders" x 2-hour live methodology training x How to trade with it:    http://
これはほぼ間違いなく、MetaTraderプラットフォームで見つけることができる最も完全な調和価格形成自動認識インジケーターです。 19種類のパターンを検出し、フィボナッチプロジェクションをあなたと同じように真剣に受け止め、潜在的逆転ゾーン(PRZ)を表示し、適切なストップロスとテイクプロフィットレベルを見つけます。 [ インストールガイド | 更新ガイド | トラブルシューティング | よくある質問 | すべての製品 ] 19の異なる調和価格形成を検出します プライマリ、派生および補完フィボナッチ投影(PRZ)をプロットします 過去の価格行動を評価し、過去のすべてのパターンを表示します この指標は、独自の品質とパフォーマンスを分析します 適切なストップロスとテイクプロフィットのレベルを表示します ブレイクアウトを使用して適切な取引を通知します すべてのパターン比をグラフにプロットします 電子メール/音声/視覚アラートを実装します スコット・M・カーニーの本に着想を得て、この指標は最も純粋で急を要するトレーダーのニーズを満たすように設計されています。ただし、トレードを
RAD CRITICAL LEVES RAD indicator tracks “Relevant Volume” in real time, identifying accumulation and distribution processes, projecting them in the chart as SUPPORT or RESISTANCE zones. Natural   support   and resistance levels are generated by Volume Accumulation and Distribution processes. As these processes evolve, levels at which the relevant volume in the market place is positioned, become difficult areas to cross upwards or downwards. By using this information, traders can identify very s
"Piranha" - an autonomous trading system that determines overbought and oversold levels on the chart. Red and blue zones represent overbought and oversold levels respectively. Entry points are marked with arrows: a downward arrow in the red zone for "sell" and an upward arrow in the blue zone for "buy". The Take profit level is indicated by the green moving average. Key features: Adjusting the Take profit level as the green moving average changes position. Averaging ability when a new market e
Big Player Range
Thalles Nascimento De Carvalho
5 (2)
「BigPlayerRange」インジケーターへようこそ。これは金融機関が市場で示す重要なエリアを特定するために開発されたテクニカル分析ツールです。このインジケーターは、主要な市場参加者が相当な活動と興味を示す価格範囲を正確に分析します。 主な特徴: 1. 金融機関の関心エリアのマッピング:「BigPlayerRange」は金融機関が強い活動を示すチャート上のエリアを正確に強調表示します。これらのポイントは戦略的に重要であり、市場の将来の動きについての洞察を提供します。 2. 出口の基準としてのプロジェクション:関心のあるエリアを特定するだけでなく、このインジケーターはプロジェクションを使用して可能な出口の基準としています。これらのプロジェクションは市場が将来どの方向に動くかに基づいて戦略を計画するのに役立ちます。 3. 識別された範囲に戻るときの引き戻しの確率:「BigPlayerRange」のユニークな機能の1つは、価格が関心のある範囲に戻ったときの引き戻しの確率を計算できることです。これは潜在的なトレンドの反転を評価するのに役立ちます。 「BigPl
The indicator is designed to close positions on the market in time. For example: to take profits ahead of schedule if the price has not reached TakeProfit, and the market is turning around. The indicator analyzes the momentum, not the trend. He does not give any information about the trend. The indicator is well suited for finding divergence. The Ershov 38 Parrots indicator dynamically adjusts to the market and detects price movement impulses of medium and high amplitude. It almost does not rea
Tatino Super Signals is Non Repaint Indicator for Binary Option trading and Forex trading. Recommendations: Timeframe: All timeframes. For best results we recommend using it on M1, M5 and M15 timeframes. Currency pairs: All Pairs Account type: All Type Broker time: Any Brokers : Alls Binary Trading : Expired 1 Candle Buffer Buy=1, Sell=0, Entry Next Candle Recommended Forex trading stop loss : 15 pips Recommended  Forex tradingTake profit levels : 15 pips Specifications: Does not repaint  
The Smooth Price technical indicator is used for plotting a smoothed line as close to the price of the financial instrument as possible, and serves to eliminate its noise components. The indicator is part of the Monarch trading system, but here it is presented as an independent technical analysis tool. The indicator is based on the cluster digital filter , which, unlike the ClusterSMA , is applied directly to the price time series. Smooth Price does not redraw (except the very last, zero bar) an
How to use Pair Trading Station Pair Trading Station is recommended for H1 time frame and you can use it for any currency pairs. To generate buy and sell signal, follow few steps below to apply Pair Trading Station to your MetaTrader terminal. When you load Pair Trading Station on your chart, Pair Trading station will assess available historical data in your MetaTrader platforms for each currency pair. On your chart, the amount of historical data available will be displayed for each currency pai
Teniendo una entrada de precios suavizados, los cuales son procesador por un ZigZag en tiempo real, dando como resultado un suavizador ajustado a un ZigZag. Con valores de entrada (periodo) mayores se vuelve un poco lenta en M1,, Ideal para H1, H4, D1 Trabaja bien con otros suavizadores, ya que su intersección es ideal Al iniciar empiza con mayor precisión desde el momento de activación, siendo el historial (anterior) de referencia ----------------------------------------------------------------
Super Suavizador
Cesar Juan Flores Navarro
Indicador en MQL5 que obtiene el promedio de 10 EMAS que son alineadas y procesadas según Fibonacci luego el promedio es suavizado"  Se ingresa un número de 2 a N que multiplica los EMA-Fibonacci y por consiguiente aumenta los fibonacci, resultando un promedio.   Se ingresa un número que suaviza los EMA-Fibonacci. Considerando los números 1/1 seria la suavización minima. Considerando los números 3/5 seria la suavización media. Considerando los números 10/30 seria la suavización alta.....etc
Entry Pro
Bartlomiej Tadeusz Tomaja
Entry Pro Indicator is a powerful multi-functional trading tool designed to increase your market entry accuracy. It combines the power of several key market trend indicators, including ATR Trailing Stop and both fast and slow EMA, to provide comprehensive market insight. It offers easy-to-interpret market entry signals represented by colored arrows. Also, it's fully customizable, allowing you to adjust ATR and EMA periods to suit your trading strategy. Trend filters and alerts can be toggled on
A scalping indicator based on mathematical patterns, which on average gives signals with relatively small SL, and also occasionally helps to catch big moves in the markets (more information in the video) This indicator has three main types of notifications: The first type warns of a possible/upcoming signal on the next bar The second type indicates the presence of a ready signal to enter the market/open a position The third type is for SL and TP levels - you will be notified every time price r
Классификатор силы тренда. Показания на истории не меняет. Изменяется классификация только незакрытого бара. По идее подобен полной системе ASCTrend, сигнальный модуль которой, точнее его аппроксимация в несколько "урезанном" виде, есть в свободном доступе, а также в терминале как сигнальный индикатор SilverTrend . Точной копией системы ASCTrend не является. Работает на всех инструментах и всех временных диапазонах. Индикатор использует несколько некоррелируемых между собой алгоритмов для класси
このインジケーターは、H.M.Gartley (「株式市場の利益」、1935 年) の開発に従って調和パターン (XABCD) を識別します。 D 点を透視投影の点として投影します (設定で ProjectionD_Mode = true を指定します)。 再描画はしません。 作業時間枠のバーが閉じるとき、特定されたパターン ポイントが Patterns_Fractal_Bars バーの間に移動していない場合、チャート上に (予想される価格変動の方向に) 矢印が表示されます。 この瞬間から、矢印はチャート上に永久に残ります。 連続した 2 ~ 3 つ以上の矢印 - これは市場状況の変化であり、再描画/再描画ではありません (時間枠を前後に切り替えてはなりません)。 注: 2 ~ 3 つ以上の矢印が連続している場合 - これは市況の変化であり、再描画ではありません。 パターンの総数は 85 です (Gartley-222 と Gartley-222WS を含む。完全なリストはコメント セクションにあります)。 識別されたすべてのパターンのうち、最後に識別されたパター
Currency Index Watcher is a simple and user-friendly tool for whoever wish to trade Forex using currencies indexes. Currency Index Watcher is configurable and usable directly from the panel. Indexes of 8 custom currencies EUR, USD, GBP, JPY, CHF, AUD, CAD, NZD (default) Any 3-chars symbol from your market watch could be used (BTC = bitcoin, RUB = ruble, CNH = yuan etc ...) : double click the symbol label  Ability to select which currencies and made-of pairs will be analyzed : check/uncheck want
The SmartTrendMt5 trend indicator generates signals based on the principle of combined analysis of calculated reference points within the Keltner channel. The indicator plots the Keltner channel in a separate window (by default, red lines and a blue line - the middle of the channel), and also draws the histogram of calculated reference points for each candle (by default, the histogram bars are yellow). The should be attached to a chart of any timeframe and any trading symbol in the usual way.
If there is only one MT5 indicator you ever buy for trading forex – this has to be it. Your success as a forex trader depends on being able to identify when a currency or currency pair is oversold or overbought. If it is strong or weak. It is this concept which lies at the heart of forex trading. Without the Quantum Currency Strength indicator, it is almost impossible. There are simply too many currencies and too many pairs to do this quickly and easily yourself. You need help! The Quantum C
Forex Relative Performance indicator This indicator calculates the relative strength of major currencies against the US dollar. The basic idea behind this indicator is "to buy strong currency and to sell weak currency". This indicator allows you to quickly identify the best forex pair to trade according to your trading style (Intraday, Scalping, Swing, or Long Term)
The latest most requested Binary Options arrow indicator in the Garuda Signals product line is now on MT5! Binary options signal based on multiple time frame cross over analysis. Gets confirmation from the most consistent signals known to man; Ichimoku, SMA, Bollinger Bands; and also uses the 1 Hour time frame as trend confirmation , so you don't have to open up multiple chart and waste time. - Can be used for all time frames up to 1 hour, but is most POWERFUL for 1 and 5 min options. - Place yo
プレミアムレベルは、正しい予測の精度が80%を超える独自の指標です。 この指標は、最高のトレーディングスペシャリストによって2か月以上テストされています。 あなたが他のどこにも見つけられない作者の指標! スクリーンショットから、このツールの正確さを自分で確認できます。 1は、1キャンドルの有効期限を持つバイナリーオプションの取引に最適です。 2はすべての通貨ペア、株式、商品、暗号通貨で機能します 手順: 赤い矢印が表示されたらすぐにダウントレードを開き、青い矢印が表示されたら閉じます。青い矢印の後に開くこともできます。 試してテストしてください!推奨設定はデフォルトです! 日足チャートで最高の精度を示します! インディケータは、2600 Pipsの収益性に対して、約10Pipsという非常に小さなマージンを使用します。
Funciona identificando picos de máximos y mínimos, para luego eliminarlos haciendo una linea o curva, pudiendo el usuario ingresar el valor de que tanto puede suavizar. Nos facilita poder ver la tendencia así como ver el cruce que puede hacer con otros indicadores, mostrando a simple vista los inicios y salidas de una tendencia u operación. Así también facilita la visualización de subidas y bajadas.
Indicador en base a la pendiente de la linea de precio, dibuja una línea de color cuando sube a base de los precios que previamente has sido procesados o linealizados, y cuando baja la pendiente la linea linealizada toma otro color. En este caso se a considerado 6 lineas de diferentes procesos desde pendientes largas hacia las cortas, observándose que cuando coincidan las pendientes se produce un máximo o mínimo, lo que a simple vista nos permitirá hacer una COMPRA O VENTA.
Description Very precise patterns to detect: entry signals as well as breakout, support and resistance reversal patterns. It points out zones in which, with a high probability, institutional orders with the potential to change the price’s direction and keep moving towards it, have been placed. Support:   We create great tools for the entire trading community. Most of them are free. If you believe in what we do  Support Us Here.   KEY LINKS:   Indicator Manual  -  All Products  How is this ind
Индикатор Coefficient Of Determination (COD) представляет собой значение коэффициента детерминации или квадрат коэффициента корреляции между зависимой переменной — ценой и объясняющей переменной — тиковым объемом. Что это дает нам на практике? COD отлично распознает кульминацию трендовых движений, что позволяет подбирать оптимальные точки и ловить развороты рынка. Как использовать индикатор: Наиболее популярная торговая стратегия строится совместно с трендовым индикатором Moving Average (MA), пе
作者のその他のプロダクト
This Indicator analyses the Trend and shows signals. When you open the Chart , Indicator shows you Buy or Sell Signal as Alert.  Usage: Activate Algo Trading , Activate the Indicator and drag new currencies into chart. Indicator shows you Buy or Sell Signal as Alert. Results - Buy Signal - Sell Signal - No Signal For any question please don't hesitate to contact.
フィルタ:
レビューなし
レビューに返信