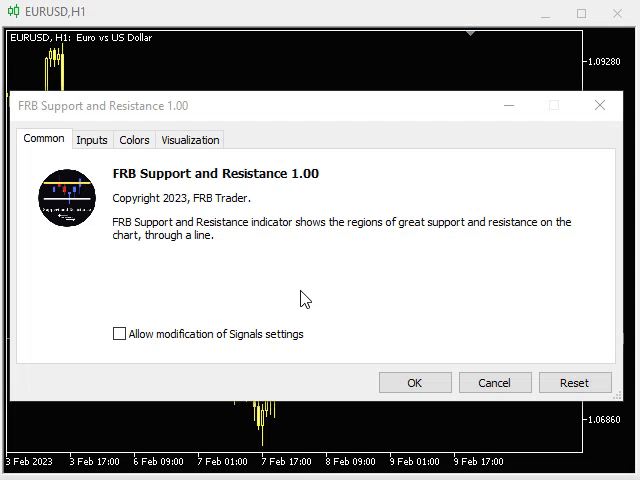
FRB Support and Resistance
- インディケータ
- Fernando Baratieri
- バージョン: 1.30
- アップデート済み: 15 2月 2023
- アクティベーション: 5
FRB Trader
- Our mission is to provide the best support to customers through conted and tools so that they can achieve the expected results
FRB Support and Resistance
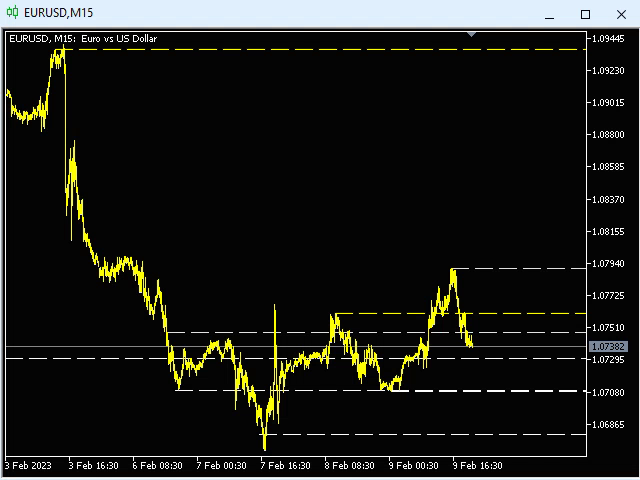
- Indicator places lines on the chart to show Support and Resistance regions.
- You can choose the timeframe you want to calculate, as well as the colors of the lines.
- Algorithm calculates the points where the strengths of the asset are considered and are extremely important for decision making.

ユーザーは評価に対して何もコメントを残しませんでした