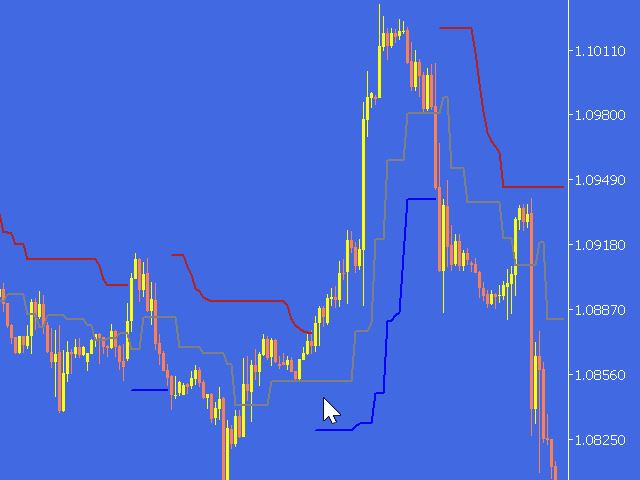
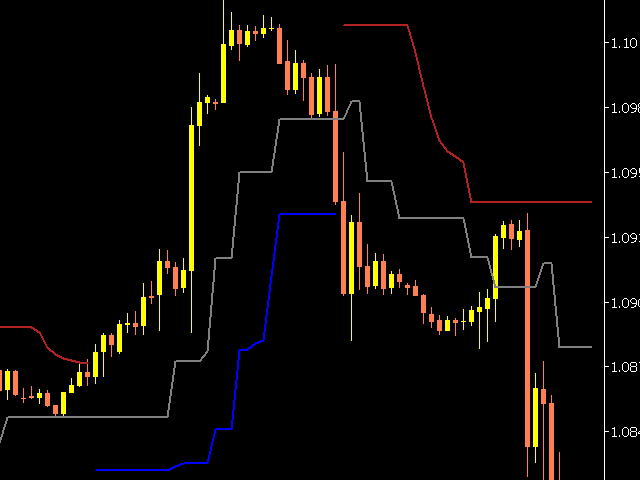
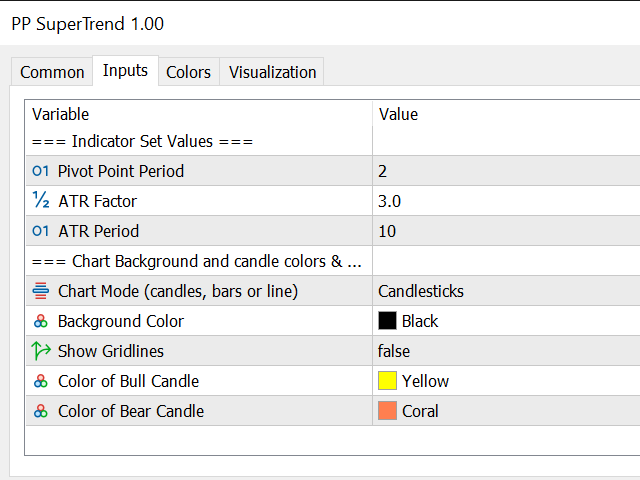
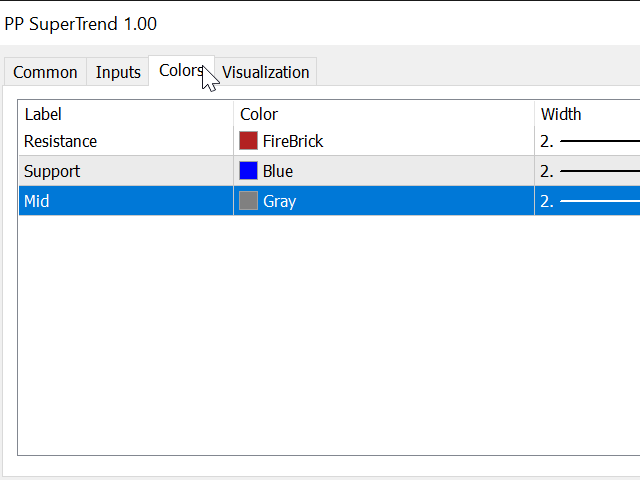
Pivot Point Super Trend
- インディケータ
- Yasir Zaidi
- バージョン: 1.0
Pivot Point Supertrend (corresponds to Pivot Point Super Trend indicator from Trading View)
Pivot Point Period: Pivot point defined as highest high and highest low... input 2 = defining highest high and highest low with 2 bars on each side which are lower (for highest high) and are higher (for lowest low calculation)
ATR Length : the ATR calculation is based on 10 periods
ATR Factor: ATR multiplied by 3

Super Indikator