Essential Trader MT5
- インディケータ
- Innovicient Limited
- バージョン: 1.0
- アクティベーション: 10
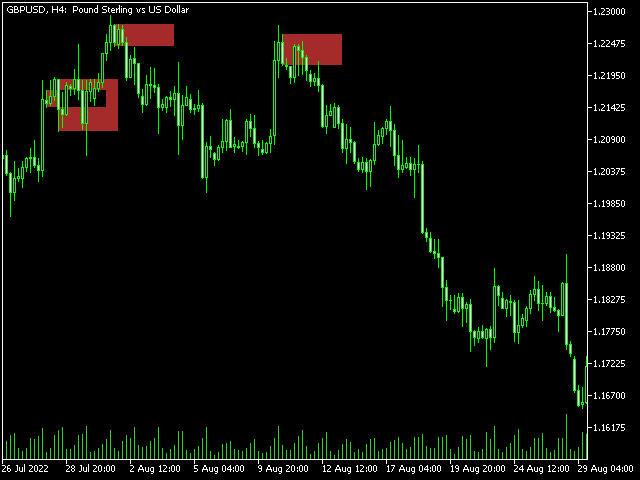
The Essential Trader indicator pinpoints the important entry areas for any trading instrument you through at it. This indicator is more comfortable with whipsaw/ranging market conditions. It is not a complicated trading indicator and can be used on any timeframe with high level of confidence. Besides, it has notifications and alerts.
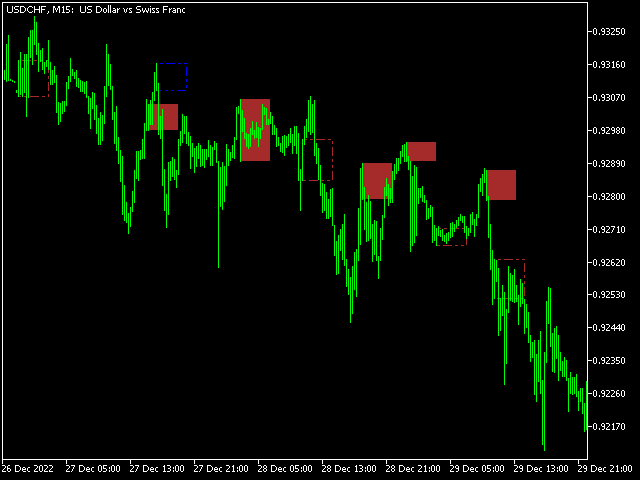
The dotted essential points show spots where you can make immediate entries and benefit from breakout on either side of the region.
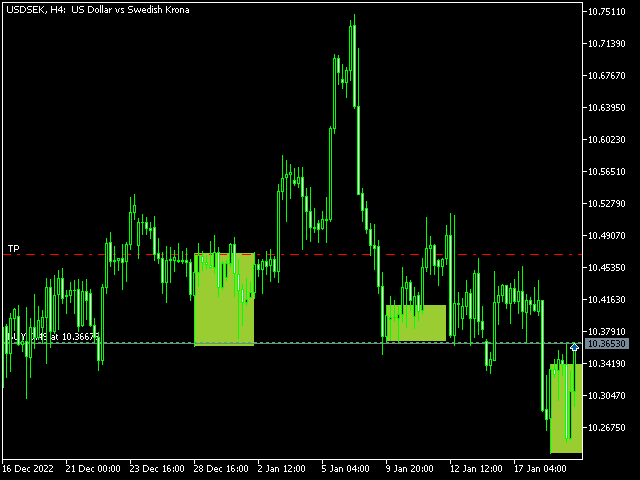
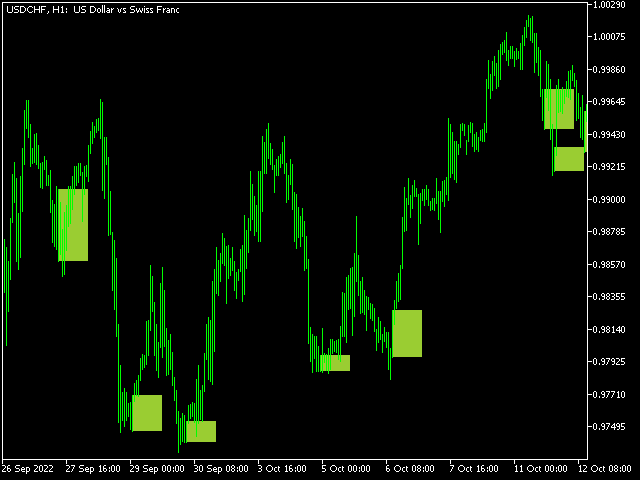
On the other hand, the color filled points display reversal regions. These are important in that you can trade along the trend or switch when the trend changes direction. Importantly, just like the dotted Essential regions, you can use them as breakout strategy.
The Essential Trader can be used for scalping or long-term trading. If you think charts above 4HR period do not generate enough trading signals, the Essential Trader gives you more than enough. All you need is to adjust the region radius.