FRB Day Points
- インディケータ
- Fernando Baratieri
- バージョン: 1.10
- アップデート済み: 10 3月 2023
Day Points
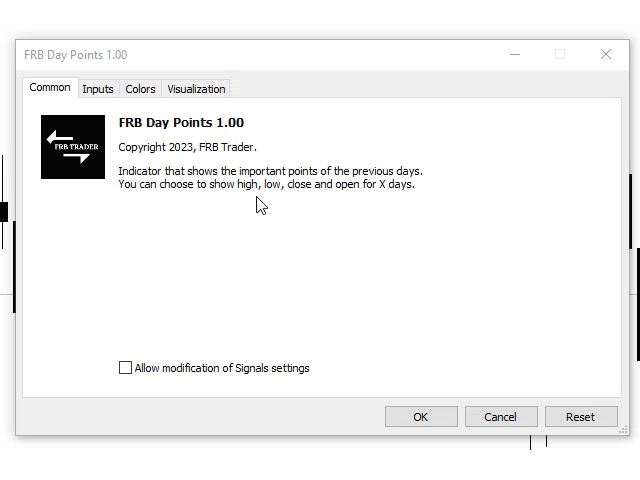
Indicadtor that shows the points considered important for X days. (Open,Close, High, Low)
Used a lot by those who do day trade. These points can be used for decision making by a trader.
You will choose the amount of days ago for it to show.
Settings

High/Low/Close/Open

Show - True/False.

Days - Number of days that will show on the chart.

Color - Line Color.

Style - Line Style.